
Seasonal Differences in Expression of Neuropeptide Y (NPY) in Visual Centers of Spotted Munia (Lonchura punctulata)


Department of Zoology, University of Lucknow, Lucknow 226007, India
*
Author to whom correspondence should be addressed.
Birds 2022, 3(3), 245-259; https://doi.org/10.3390/birds3030016
Submission received: 31 March 2022
/
Revised: 6 July 2022
/
Accepted: 22 July 2022
/
Published: 28 July 2022
(This article belongs to the Special Issue Feature Papers of Birds 2021)
Abstract
:Simple Summary
Vision plays a prominent role during the reproductive phase of the lives of animals, and especially birds, for which vision is the most important and energy-demanding physiological process. In the current study, Spotted Munia were procured from the wild at different times of the year. At a physiological level, their body mass, food intake, glucose levels, and testicular volume, and at a neurochemical level, the expression of Neuropeptide Y (NPY) in brain areas associated with vision, were observed. NPY, an orexigenic, nonphotic neuropeptide is found in various areas of the brain in birds and other vertebrates, and is associated with numerous functions. The immunoreactivity (ir) of NPY varies during different times of the year in the HA (hyperpallium apicale), HP (hippocampus), RoT (nucleus rotundus), TeO (optic tectum), and GLv (geniculatus lateralis ventralis). Higher numbers of ir-cells were observed in all the three nuclei associated with vision in the month of September, which is the peak breeding window of Spotted Munia. The insight from these results indicates that the vision of Spotted Munia is enhanced during the reproductive phase of their lives.
Abstract
The visual perception of birds is an incredibly exciting subject of research. Birds have significantly higher visual acuity than most other animals, which helps them stay safe in flight and detect their prey. Understanding how the eyes send information to the brain for additional processing is crucial. The brain has sections (nuclei) that accept input from the retina. The key areas where information is processed are the hyperpallium apicale (HA), hippocampus (HP), optic tectum (TeO), nucleus rotundus (RoT), and the geniculatus lateralis ventralis (Glv); among these, the RoT is one of the most investigated nuclei for vision. This study looked at how the visual centers of non-photoperiodic songbirds (Spotted Munia) adapt in different life history stages by looking at NPY expression. We immunohistochemically quantified NPY expression in four different seasons, including pre-breeding (June), breeding (September), post-breeding (December), and regressed (March) in the brain of Spotted Munia. We evaluated changes in the expression levels of the peptide throughout the year, by determining the expression at four different periods throughout the year. Peptide expression levels were projected to fluctuate within photoperiod-induced seasons. It was discovered that the parts of the brain related to vision (RoT, HA, and HP) have a higher number of immunoreactive cells during their mating season, i.e., during the summer. The appearance of NPY, a non-photic marker, in brain areas linked with light perception, was fascinating. Indirectly, NPY aids avian reproduction in a variety of ways. These findings demonstrate the importance of these nuclei in the process of reproduction, as well as the involvement of NPY in the visual brain areas of Spotted Munia.
1. Introduction
Visual perception is the ability of the brain to perceive, interpret, and act on visual inputs. Birds have substantially stronger visual perspicacity than the majority of animals, which is necessary for flying safety and identifying predators [1]. They gather information from the environment in order to determine their speed for the purposes of high accuracy flight, for the recognition of mates and competition from conspecific species, and for feeding and other similar tasks (i.e., finding flowers containing larger amounts of nectar in a foraging patch), through vision, which is considered the most prominent sensory approach to acquire the aforementioned information. With variations of birds having eyes in suitable portions of their body mass, the variety in bird eye morphology may be easily noticed [2]. Interestingly, in several gallinaceous bird species, the visual system is highly developed and acts as the principal sensory system engaged in reproductive behavior. The retina of the eyes is where discrete visual stimuli in the environment, such as a brilliantly colored patch of feathers on a conspecific species, reach the neurological system. When blinded by bilateral enucleation, some species, such as farmed quail, fail to demonstrate gonadal reactions to variations in photoperiod [3]. Another visual cue for successful mating comes in the form of nesting material, as in the instance of the cockatiel [4], or species-specific and/or sex-specific traits of a possible partner. Birds, for example, have a lot of plumage and demonstrate courting behaviors. Male birds are well known for using visual displays to indicate sexual interest [5]. Other visual cues are associated with more modest responses that occur during reproductive activity. Some bird species choose mates based on UV plumage colors, which humans cannot see [6,7]. Another type of visual signal used to induce sexual behavior in potential mates is courtship dances. These sexual displays have been extensively examined and show how birds may employ visual clues to sexually arouse members of the opposing sex. Understanding how the eyes send information to the brain for additional processing is a crucial area of study. The RoT (nucleus rotundus) is one of the most-researched nuclei for vision since it receives information from the retina. The primary places where information is processed are the HA (hyperpallium apicale), HP (hippocampus), TeO (optic tectum), and Glv (geniculatus lateralis ventralis). The retina captures light from the environment and transmits it to the Suprachiasmatic nucleus (SCN) in the animal’s brain, and this is the direct pathway; however, there is also an indirect pathway that uses neuropeptide Y [8] to convey information from the intergeniculate leaflet (IGL) of the lateral geniculate nucleus (LGN). NPY is a neuropeptide that is found in most brain nuclei and is involved in a variety of physiological reactions. It is found in cyclostomes [9], fishes [10], amphibians [11], reptiles [12], birds [13], and mammals [14]. It has a variety of functions, including the regulation of food intake, sexual maturation [15], and the development of secondary sexual traits such as singing behavior [16]. The presence of NPY in the optic accessory system of the retina suggests that it has a role in the optokinetic response (OKR), which is a reflexive eye movement triggered by wide visual-field motion [17,18]. Many researchers suggest that NPY may have a role in seasonal fluctuation. It is also linked to environmental signals that are not photic. In the hypothalamus of hens (Gallus gallus), Indian weaverbirds (Ploceus philippinus), and redheaded buntings, GnRH-I and NPY fibers have a tight connection [19]. In animals, NPY has been identified as being involved in the control of seasonal reproduction as well as luteinizing hormone (LH) release. Evidence was also found to support the concept that NPY has an effect on LH cells in catfish (Clarias batrachus). Many data point to the presence of NPY in brain regions with GnRH-I and GnIH cells, indicating that NPY is important in reproduction [20]. GnRH-I mRNA and peptides have been found in the lateral septum of female turkey brains, which also contains NPY-immunoreactive (-ir) fibers in the bunting brain. Furthermore, NPY has the ability to influence GnRH-I directly. As a result, NPY is thought to be in charge of photoperiod-induced seasonal responses in birds. The hypothalamic pathways involved in the translation of the photoperiodic information into the neuroendocrine response are thought to contain NPY [21].
Numerous important neuromodulatory tasks are carried out by NPY in the brain in mammals [22,23,24,25]. It also seems to have significant functions in the visual brain. NPY has been detected in the visual cortex of numerous animals. Its immunoreactive (ir) neurons were discovered to be largely located in deep cortical areas in the visual cortexes of humans [26,27], monkeys [28,29,30,31], cats [32,33,34], rats [14,28,35], and mice [36]. It has also been discovered in non-mammalian species, including in the killifish optic tecta [37], in the octopus optic lobe [38], in chameleons [39] and frogs [31,40], and in the pigeon visual wulst (an avian analogue of the mammalian striate cortex).
NPY has a variety of roles in the brain’s visual regions. In the visual cortices of humans and cats, for instance, NPY-ir fibers and varicosities near blood vessels play a role in controlling blood flow [26,27,32,41]. NPY-ir neurons may be involved in pattern perception and binocular processing because they are typically found outside of cytochrome oxidase patches in the macaque monkey [29,30]. The neuroprotective effects of NPY are associated with neurological disorders [42,43]. As a result, a lower number of NPY-positive cells in the adult mouse visual cortex were associated with an animal model of autism.
The existence of NPY in the visual center of the brain of mammals has been extensively studied whereas little knowledge is available in the literature on this intriguing subject for birds. Birds serve as an excellent animal model for studying the central visual system as they have the highest visual acuity in animal kingdom; however, one of the most abundant neuropeptides in the brain, NPY, has not been studied in the bird’s visual centers.
Therefore, the purpose of the present study was to investigate the organization of NPY in visual centers of the brain of Spotted Munia, a resident passerine finch found in several of parts of India, except for the arid regions of Punjab and parts of Rajasthan. In the current study, we attempted to shed light on the existence of NPY-ir neurons in the visual centers of the brain of Spotted Munia, as well as the significance of NPY-ir in visual centers throughout the bird’s breeding season by immunohistochemistry and its quantitative analysis.
We immunohistochemically measured the NPY-ir at several life history phases of the bird, including pre-breeding (June), breeding (September), post-breeding (December), and regressed breeding (March), in order to understand the relevance of NPY-ir in the visual centers during different life history phases of the bird. For this, we identified brain regions that either directly or indirectly contribute to the bird’s visual system. Since these nuclei are involved in the passerines’ visual pathway, HA, HP, RoT, TeO and GLv were taken into consideration for this investigation. We were expecting a positive correlation between NPY in visual centers and the breeding phase of the bird, as vision acuity was more enhanced during the breeding season of the bird as compared to other phase of the year.
2. Material and Methods
2.1. Animal Housing and Experiment
We have selected an autumn-breeder, Spotted Munia (Lonchura punctulata, family: Estrildidae; order: Passeriformes) for this study (Linnaeus 1758). The birds were procured from nature around Lucknow (26°55′ N, 80°59′ E), India at four times of the year [pre-breeding (June), breeding (September), post-breeding (December) and regressive breeding (March)], and kept in an outdoor aviary (2.95 m × 1.73 m × 2.21 m) under natural light–dark and temperature conditions (NDL), where food (seeds of Setaria italica and Oryza sativa) and water were present ad libitum. A food rich in protein and vitamins, which was prepared by mixing crushed egg shells, cottage cheese, bread crumbs, boiled eggs, and multi-vitamins (Vimeral, containing vitamins A, D3, E and B12, Virbac Animal Health India, Mumbai, India), was also given on alternate days as a supplement. Birds (N = 5) during different times of the year as mentioned were perfused. Earlier studies were performed on the same species with the same sample size and had given adequate results [19,20,21]. The brains were dissected out and processed for the quantification of Neuropeptide Y expression. The Institutional Ethics Committee’s guidelines (LU/ZOOL/IAEC/05/19/10) were followed during the experiment. After 4–5 days of capturing, experimental schedules were started, which included body mass, two days of food intake, and bleeding for glucose, and the birds were then perfused for immunocytochemistry of NPY in the brain.
2.2. Measurement of Body Mass and Food Intake
Measurement of the birds’ body weight was taken by wrapping them in a cloth and placing them on a top-pan balance providing an accuracy of 0.1 g. Food intake was measured by placing a paper inside the cage and giving the birds 120 g of food for 2 days.
2.3. Tissue Preparation
Five birds from each phase, i.e., non-breeding, breeding, post-breeding and regressive breeding, were deeply anaesthetized by injecting ketamine-xylazine solution (0.003 mL/g body weight) and perfused transcardially consecutively with ice-cold saline (pH 7.4) and 4% paraformaldehyde (PFA) solution (in 0.1 M phosphate buffer, pH 7.4). The brains were post-fixed overnight in the PFA solution at 4 °C, cryoprotected in sucrose solution, embedded in 15% PVP solution (polyvinyl pyrrolidone; PVP40 T; Sigma-Aldrich, USA), sectioned at −30 μm thickness on a Leica 1850 cryostat, and collected in five bins in PBS (phosphate buffer saline, 10 mM, pH 7.4). Thus, sections of each bin were separated by 150 μm. The five bin sections were thaw-mounted onto poly-L-lysine-coated slides and Crystal violet stained [44]; these were used for the identification of the brain areas of interest. Separate bins were used for immunohistochemistry.
2.3.1. Immunohistochemistry
The immunohistochemistry for the detection and quantification of Neuropeptide Y was completed using the standard avidin–biotin protocol with minor modifications as described by Kumar and colleagues [45]. Briefly, the incubation steps were followed by rinsing sections in the phosphate buffer saline (PBS; three times, 10 min each). Endogenous peroxidase activity was blocked by 1% normal bovine serum albumin (BSA) dissolved in PBS containing 0.3% Triton-X 100 (PBSBT; 40 min). The sections were then incubated with NPY (N9528; Sigma-Aldrich, USA; raised against porcine NPY;] 1:25,000) primary antibody for 2 h at room temperature followed by overnight at 4 °C. The primary antibody used has been used previously in our lab and has shown positive results [46,47]. This step was followed by incubation for 2 h each with respective secondary antibodies and avidin–biotin complex (1:200; Elite ABC Kit, Vector Laboratories, Burlingame, CA, USA). After washing in PBS three times, sections were incubated with the diaminobenzidine solution (DAB; DAB Substrate kit, SK-4100, Vetcor Laboratories, Burlingame, CA, USA,) prepared in double-distilled water (pH 7.4 for 1–2 min, to visualize the antigen–antibody reaction). The color reaction was stopped by adding PBS, when minimal background coloration became evident. The sections were rinsed in distilled water, ordered, mounted onto slides by mounting media (mounting media 50% and 50% PBS), and dried overnight. Thereafter, the sections were dehydrated in the ascending grades of alcohol, cleared in xylene, coverslipped in DPX (Merck, Kenilworth, NJ, USA), and observed for further analysis. The sections from all five birds at all of the time points were processed together to avoid any technical errors. Our control procedures included the omission of the primary antibody from the reaction, and the replacement of the primary antibody with PBSBT, BSA, or normal goat serum.
2.3.2. Microscopy and Photography
A Leica DM 3000 microscope equipped with a Leica DFC 420 C camera was used for the observation of sections. The required fields from sections were photographed using the standardized illumination for all sections. For the adjustment (if required) of size, brightness, and contrast, Adobe Photoshop 7.0, 1990–2002, Adobe Systems incorpated, San Jose, CA, USA was used. Corel Draw X3 Version 13.0.0.739, 2005, Corel Corporation, Canada was used for panelizing selected images. The nomenclature of Stokes et al. [48], Kuenzel and Masson [49], and Reiners’ et al. [50] was adopted for describing the brain areas of interest.
2.3.3. NPY-ir Cell Counting
Specific nuclei of interest were captured (40×) by a Nikon E400 microscope attached to a DS-Fi1 Nikon digital camera, Tokyo, Japan. The dimension of the analyzed image was 2560 × 1920 pixel RGB 8 bit. The magnification/numerical aperture (NA) used was 100×/0.25. The counting was completed using the Nikon NIS-element BR Program (version 2.3), Tokyo, Japan. For each bird, the NPY-ir cell immunoreactivity of the entire specified region was taken into consideration. To avoid staining-intensity-based bias in quantification, we counted both strongly- and weakly-stained cells [51,52,53]. According to the studies of Gentner and Shimizu [51,52], a threshold optical density was defined manually based on background staining, and cells which had an optical density higher than the threshold were counted as immunoreactive cells. To minimize error, two independent observers with no knowledge of the actual experimental protocol repeated the counting procedure. Their numbers were averaged for each neuronal group. Finally, mean ± SD for the group was calculated.
2.3.4. NPY-ir Fiber Area
NPY-ir fibers in different areas related to vision (TeO and GLv) were analyzed. The measurement of fibers in the aforementioned areas was carried out as described by Sakharkar et al. [54]. The area (in µm2) occupied by each fiber per unit field was measured using a frame of 200 × 200μm, and the overall area was estimated by taking into account all of the sections from the corresponding region of the brain. Each brain was measured in a predetermined field, and the data from the various time points were aggregated, averaged, and represented as mean SEM.
2.4. Statistics
Initially the normality of the dataset was checked; a Shapiro–Wilk test was used to determine whether the data had a normal distribution. One-way analysis of variance (one-way ANOVA) was employed once the normality had been verified to ascertain the impact of seasons on birds; if the ANOVA revealed a significant difference, the groups were compared using the Newman–Keuls test. However, if the data had not been distributed normally, the Kruskal–Wallis test was carried out, with Dunn’s multiple comparison tests.
The dataset of glucose was normally distributed (non-breeding: W = 0.9011, p = 0.4162; pre- breeding: W = 0.9118, p = 0.4783; breeding: W = 0.9455, p = 0.7049; post-breeding: W = 0.9395, p = 0.6226, Shapiro–Wilk test). A one-way ANOVA followed by the Newman–Keuls multiple comparison test determined the significant changes in blood glucose levels of the birds at different life history stages. A one-way ANOVA followed by the Newman–Keuls multiple comparison test was used to compare the difference in body mass due to seasons, as the dataset was normally distributed (regressed breeding: W = 0.9204, p = 0. 5323; pre-breeding: W = 0.9626 p = 0.8262; breeding: W = 0.8823, p = 0.3200; post-breeding: W = 0.9800, p = 0.9346, Shapiro–Wilk test).
For the analysis of changes in testicular volume, food intake, and NPY peptide immunoreactivity (cell counts) between different life history stages, the Kruskal–Wallis followed by Dunn’s multiple comparison test were carried out. Statistically significant difference was considered at p < 0.05. All statistical analyses were performed using Graph Pad Prism software (version 5.0), San Diego, CA, USA.
For the NPY-ir fiber area (in TeO and GLv), the dataset was checked for normality, and found to be normally distributed. TeO (regressed-breeding: W = 0.9185, p = 0. 5203; pre- breeding: W = 0.9124, p = 0.4825; breeding: W = 0.8638, p = 0.2424; post-breeding: W = 0.9257, p = 0.5672, Shapiro–Wilk test). GLv (regressed breeding: W = 0.8919, p = 0. 3667; pre- breeding: W = 0.9742, p = 0.9016; breeding: W = 0.8708, p = 0.2698; post-breeding: W = 0.8976, p = 0.3969, Shapiro–Wilk test), hence a one-way ANOVA followed by the Newman–Keuls comparison test was applied.
3. Results
3.1. Effect on Physiology
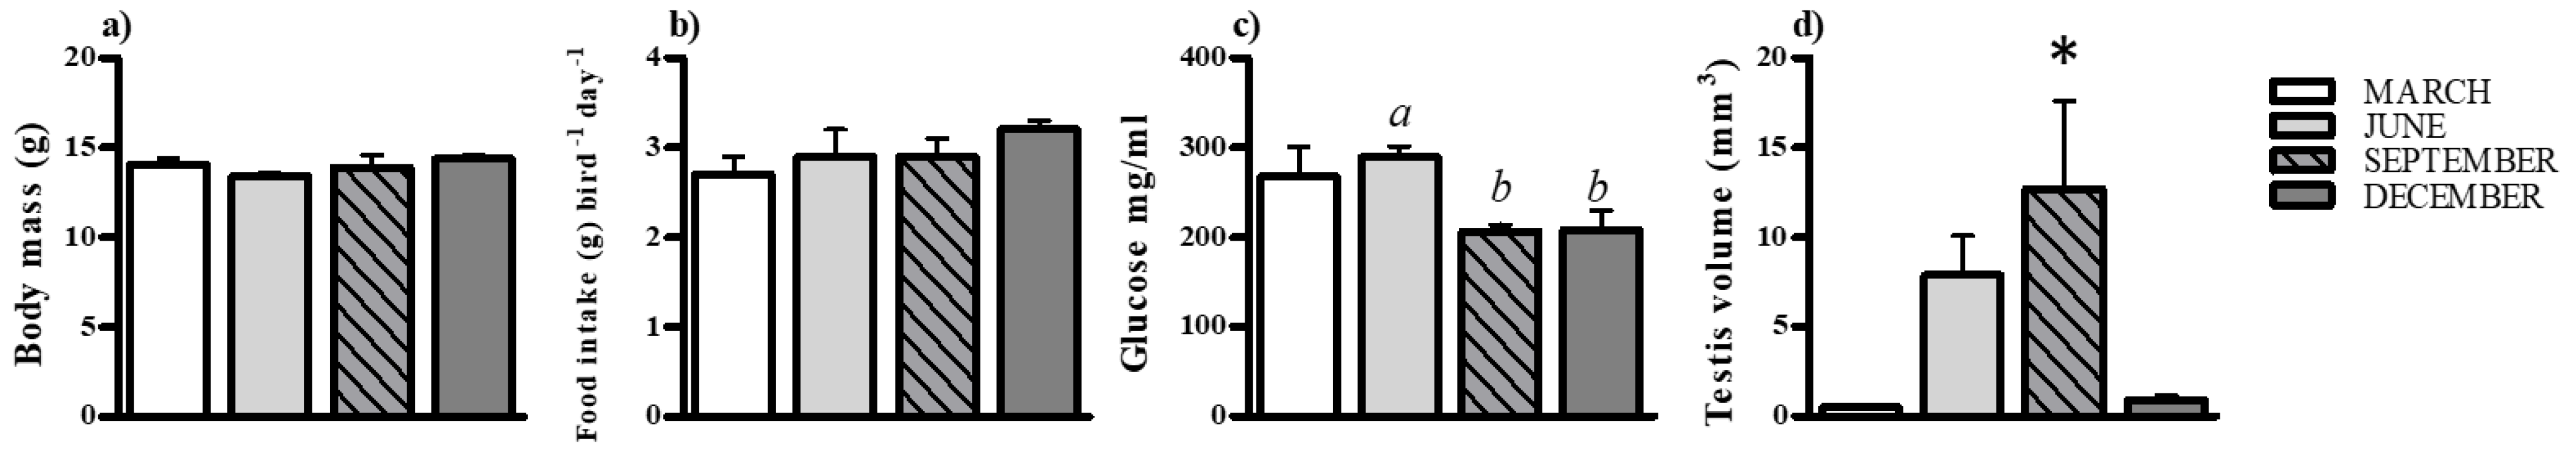
Body mass does not change during the different life history stages of the bird (F3,16 = 1.751, p = 0.1971, one-way ANOVA followed by Newman–Keuls multiple comparison test). Additionally, food intake does not vary throughout the different life history phases of the bird, (K–W test value = 6.747, df = 3, p = 0.0804, Kruskal–Wallis followed by Dunn’s multiple comparison test). Blood glucose levels were significantly varied at different phases, with a significant difference between the pre-breeding and breeding phases (F3,16 = 4.709, p = 0.0153, one-way ANOVA followed by Newman–Keuls multiple comparison test). The sizes of testes significantly varied between life history phases (K–W test values = 15.26, df = 3, p = 0.0016; Kruskal–Wallis followed by Dunn’s multiple comparison test), with significantly larger testes evident during the breeding phase of the bird (Figure 1).
3.2. Effect on Neuropeptide Y (NPY) Immunoreactivity
All five of the participants (n = 5/time point) in this investigation found consistent and homogeneous data for the distribution pattern of NPY peptide (by IHC) for cell number and fiber area. The expression of NPY showed season-dependent expression in the HA (K–W test values = 8.669, df = 3, p = 0.0340, Kruskal–Wallis test), HP: (K–W test values = 7.807, df = 3, p < 0.05, Kruskal–Wallis test), ROT (K–W test values = 7.914, df = 3, p = 0.0478, Kruskal–Wallis test) with higher expression under breeding phase (Figure 2).
The effect of seasons on the NPY-ir fiber was analyzed through fiber areas in the visual centers TeO and GLv. Upon analysis, we found a significant difference in the GLv fiber area, with a significantly greater fiber area during the breeding phase (F3,16 = 14.08, p < 0.0001), whereas no significant effect of different life history phases was observed on the TeO fiber area (F3,16 = 0.3627, p = 0.7808) (Figure 3).
4. Discussion
4.1. Effect of Different Seasons on Physiology
We demonstrate that NPY protein expression has a life-history-dependent effect connected with vision and reproduction in captive Spotted Munia. These findings are particularly fascinating because they demonstrate life-history-dependent changes in the physiology and neuropeptide of NPY in brain nuclei linked with vision in Spotted Munia. The physiological outcomes of the trial, such as body mass and food consumption, indicate little variation throughout the year, though testicular volume and blood glucose levels showed considerable changes throughout the study. The breeding window of Spotted Munia begins in June and ends in September–October [55]. The considerable rise in testicular volume in the breeding phase was to achieve maturity during this phase, and therefore testicular volume reached its peak. Variations in blood glucose levels were discovered to be seasonal. The blood glucose level discovered was consistent with previous research [56], which had revealed that starlings (Sturnus vulgaris) had higher blood glucose levels during simulated long days similar to those of summer. In this study, the blood glucose levels of Spotted Munia were higher in the regressive breeding and pre-breeding phases, when the days are longer, as compared to the breeding and post-breeding phases, when the days are shorter and the nights are longer. The elevation in blood glucose levels throughout the pre-breeding phase of the bird indicates an increase in metabolic demand at that time in the life history phase of the bird. Pre-breeding is the stage of an animal’s, or in our case bird’s, life; this is when it requires more energy for a variety of behavioral tasks such as nest building, territory defense, molting, and other breeding/nesting behaviors, and glucose is the most abundant source of energy. According to unpublished data from our lab, the rate of feather molting was highest in pre-breeding as compared to breeding, non-breeding, and regressive breeding. Additionally, molting is the second most energy-demanding and stressful activity after reproduction, according to prior studies; moreover, it is a pre-breeding behavior that commences before the period of breeding [57].
The rise in glucose levels occurs as a result of stretching exercise over pre-breeding days. Blood glucose levels are not correlated in any way with body mass or food intake [58]. The blood glucose level of birds appears to be independent of body mass, according to earlier data published by Beuchat and Chong (1998) [59], since all species evaluated in that study had plasma glucose greater than those of other mammals of a similar body mass, [60,61]; in their study it was found that the 6 h starvation of a chick did not have an effect on its plasma glucose level. As a result, it is probable that the high metabolic rate of birds can cover blood glucose rises brought on by liver glycogenolysis and gluconeogenesis or that the liver is capable of keeping glucose levels in check in birds.
4.2. Effect of Different Seasons on Expression of NPY
The location of NPY-ir neurons and fibers observed was consistent with previous research [46]. The expression of NPY in the visual areas of the brain of Spotted Munia was life-history dependent. Along with the visual centers of brain, NPY-ir has been reported in the retina of most animals. Its function is found to be diverse. Localization of NPY has been found in the iris, the choroid, and in nerve fibers innervating several eye regions such as the anterior uvea, ciliary body, ciliary epithelium, retinal cells, retinal vasculature, and others [62,63,64,65,66,67,68,69,70,71,72,73,74]. NPY is one of the neuropeptides with the highest degree of phylogenetic preservation [75]. In pigeons, chickens, pigs, and baboons, NPY-ir is found in processes that ramify in the inner plexiform layer (IPL) [76,77,78]. It appears to play a function in retinal development at the start and throughout, according to several studies. In the inner nuclear layer (INL) of the retina, NPY-immunoreactive retinal neuroblasts from chickens develop at embryonic day 13. NPY has been found in undifferentiated retinal cells in several studies, suggesting that it may play a role in retinal development [79,80,81,82,83,84,85,86]. NPY has also been suggested as a neuromodulator in retina in several investigations. In rat retinal neurons, NPY affects the intracellular calcium concentration (Ca2+). Through the activation of NPY Y2 receptors, NPY suppresses the depolarization-evoked Ca2+ influx into rod bipolar cells [87].
The visual areas of the brain consist of: GLv, a part of the accessory optic system which is used by the optokinetic reflexes. It has been shown that GLv and SCN (suprachiasmatic nucleus) are both under the photic regulation of circadian entrainment and period determination in birds. According to Morin and Allen (2006) [88], it contains several connections to the rest of the brain, including the hypothalamus.
TeO (optic tectum), a part of the brain visual system which is involved in the tectofugal pathway’s initial transmission of visual information. The higher brain centers, such as the n. rotundus (RoT), entopallium (E), which surrounds the nidopallium (N), and ventral mesopallium, acquire the visual information from the retina through TeO [89], and RoT processes visual information concerning color, ambient light, and motion in pigeons [90]. HA and HP play an accessory nuclei in the visual pathway [46], though both nuclei are also involved in other responses; for example, HP was found to be involved in memory and learning in mammals [91]. It has been suggested that the hippocampus, a component of the limbic system, is crucial for relational memory (i.e., spatial and episodic memory), as well as for behavioral responses to environmental stimuli [92]. HA, along with GLd (dorsal geniculate complex) and a few other nuclei, forms the thalamofugal pathway for vision in birds [93]. The presence of NPY nuclei in the optic accessory system indicates that they play a role in optokinectic reflexes [17,18]. Because n. reticularis pontis caudalis pars gigantocellularis (RPgC), is a pre-cerebellar nucleus of the brain, the production of NPY peptide in RPgC shows its involvement in reticular formation in the brain [46]. It may be involved in controlling body posture, synchronization of visceral organ activity, and eye movement.
The NPY-ir peptide was observed in all of the life history phases chosen for consideration, i.e., pre-breeding, breeding, post-breeding and regressive breeding in HA, HP, and RoT regions. NPY-ir cells were observed in HA, HP and RoT whereas only cell fibers were found in the GLv and TeO regions of the brain. Around the n. rotundus (RoT), NPY-ir-peptide-containing cells and fibers formed a peripheral layer among visual tectofugal nuclei. These were bipolar, elongated, or spherical cells having long, thick processes. The visual thalamofugal nuclei had a similar expression. The hyperpallium apicale (HA) had NPY-ir soma and fibers. The cells were rounded, having few processes. NPY-ir fibers were abundant in the hippocampus (HP); however, there were randomly scattered cells tagged with NPY peptide in HP [46]. The breeding window of Spotted Munia lies in June to September. The expression of NPY-ir was observed, with a significantly higher number of cell bodies in HA, HP, and RoT during the breeding phase, as well as a greater NPY-ir cell fiber area in Glv, which forms the tectofugal pathway. In contrast, no significant difference was found in the cell fiber area of TeO between the different life history phases of the bird.
This indicates the relevance of the NPY in these nuclei in the reproductive life phase of the bird. NPY is an orexigenic, nonphotic neuropeptide that performs a variety of roles in an animal’s physiology and homeostasis, as well as in the control of multiple systems, such as that of reproduction in birds [94]; NPY-ir was found in close proximity to GnRH neurons [18,20], and therefore its increased immunoreactive cell count might imply its participation in reproduction indirectly through the visual pathway in response to photoperiod exposure.
At the brain level, more than one, if not many, regulatory pathways are involved in every physiological function, and reproduction is one such function which involves many regulatory pathways. Most of the animal’s systems are in high demand during reproduction, and they work in regulatory way to accomplish the task (reproduction). Visual pathways were rigorously involved in the avian system during the breeding and pre-breeding phases. The biggest distinguishing trait of birds is their vision, having large eyes and deep brain photoreceptors. Therefore, the increased number of immunoreactive cells expressed during the breeding phase demonstrates the necessity of vision during life’s most crucial stage. Many areas of the brain nuclei, such as median eminence (ME), have both GnRH-I&II and NPY-ir fibers in close proximity (ME). These findings are supported by previous research that has shown that NPY has a role in vision [21].
Another aspect which cannot be ruled out is the involvement of deep brain photoreceptors in the breeding phase of the bird. In birds, neurons inside at least four separate brain areas have been postulated to serve in this capacity, rather than the eyes, which do not appear to monitor photoperiodic information. The septum and three regions of the hypothalamus have been revealed to contain deep brain photoreceptors (DBP), which are specialized neurons. Each of the four brain loci contains one or more of the three distinct photopigments melanopsin, neuropsin, and vertebrate ancient opsin [95], whereas vision, on the other hand, was involved in photoreception and non-photoreceptive tasks. In this study, we hypothesized the role of vision as the seeing of brightened plumage color, courtship behavior, and nest building, and examined how this information received from the eyes transfers to the brain through brain nuclei involved in the visual pathway and the expression of some neuropeptides, which increase to show that the animal has been satisfied.
In Spotted Munia, the life-history-dependent expression of NPY suggests that visual acuity plays an important function during breeding. Therefore, we can say that NPY-ir immunoreactivity in the visual centers of the brain of Spotted Munia plays an intriguing role which must be examined in detail in further studies.
5. Conclusions
For the first time, it has been shown that the Spotted Munia expresses the season-dependent neuropeptide Y (NPY) in the visual areas of the brain. Although the brain regions we chose were also engaged in other processes, their involvement in the visual pathway cannot be completely ruled out. We hypothesize that during breeding season, the role of visual acuity was more enhanced or was more involved at this (breeding) stage of the bird’s life. This study does not deny the involvement of deep brain photoreceptors of birds in reproduction, but our focus was on visual acuity; both are different in terms of their role, and in this study we have focused on vision in birds, which may be important due to behavior (i.e., the analysis of courtship behavior, plumage color, different types of dance to gather the attention of females, nest building, etc.) which occurs during the breeding phase. These discoveries could make it easier for us to comprehend how crucial vision is to an animal’s life throughout the reproductive process. This may be the preliminary study on this concept, and more work should be carried out to examine the role of vision in the breeding season of the bird with the involvement of different neuropeptides.
Author Contributions
Conceptualization, S.M., S.R. and A.N.; methodology, S.M., A.N. and V.V. formal analysis, A.N. and S.M.; investigation, A.N. and S.M.; data curation, A.N., V.V. and S.M.; writing—original draft preparation, A.N. and S.M.; writing—review and editing, A.N. and S.M.; supervision, S.M. and S.R.; funding acquisition, UGC, CSIR HRDG, New Delhi, India. All authors have read and agreed to the published version of the manuscript.
Funding
This research was funded by University Grants Commission (New Delhi), through a major research grant [F.No. 43–597/2014 (SR)] to S. M., New Delhi, India. A.N. received a research fellowship from Council of Scientific and Industrial research, New Delhi (F.No. 09/107 (0397)/2018-EMR-I).
Institutional Review Board Statement
The animal study protocol (No. LU/ZOOL/IAEC/05/19/10) was approved by the Institutional Animal Ethical Committee (or Ethics Committee).
Informed Consent Statement
Not applicable.
Data Availability Statement
The data will be available upon request to the corresponding author.
Acknowledgments
We thank Anurag Nishad, Department of Zoology, University of Lucknow for the technical assistance. We also thank the reviewers for their valuable comments.
Conflicts of Interest
The authors declare no conflict of interest.
References
- Corning, A. Birds, Bees, and Human Visual Perception; Radiant Vision Systems: Redmond, WA, USA, 2020. [Google Scholar]
- de L. Brooke, M.; Hanley, S.; Laughlin, S.B. The scaling of eye size with body mass in birds. Proc. R. Soc. B 1999, 266, 1417. [Google Scholar]
- Bons, N.; Jallageas, M.; Assenmacher, I. Influence des recepteurs retiniens et extra-retiniens dans la stimulation testiculaire de la Caille par les “jours longs”. J. Physiol. 1975, 71, 265–266. [Google Scholar]
- Shields, K.M.; Yamamoto, J.T.; Millam, J.R. Reproductive behavior and LH levels of cockatiels (Nymphicus hollandicus) associated with photostimulation, nest-box presentation, and degree of mate access. Horm. Behav. 1989, 23, 68–82. [Google Scholar] [CrossRef]
- Endler, J.A.; Gaburro, J.; Kelley, L.A. Visual effects in great bowerbird sexual displays and their implications for signal design. Proc. R. Soc. B 2014, 281, 20140235. [Google Scholar] [CrossRef] [Green Version]
- Bennett, A.T.D.; Cuthill, I.C.; Partridge, J.C.; Maier, E.J. Ultraviolet vision and mate choice in zebra finch. Nature 1996, 380, 433–435. [Google Scholar]
- Bennett, A.T.D.; Cuthill, I.C.; Partridge, J.C.; Lunau, K. Ultraviolet plumage colors predict mate preferences in starlings. Proc. Natl. Acad. Sci. USA 1997, 94, 8618–8621. [Google Scholar]
- Lall, G.S.; Biello, S.M. Attenuation of phase shifts to light by activity or neuropeptide Y: A time course study. Brain Res. 2002, 957, 109–116. [Google Scholar]
- Söderberg, C.; Pieribone, V.A.; Dahlstrand, J.; Brodin, L.; Larhammar, D. Neuropeptide role of both peptide YY and neuropeptide Y in vertebrates suggested by abundant expression of their mRNAs in a cyclostome brain. J. Neurosci. Res. 1994, 37, 633–640. [Google Scholar] [CrossRef]
- Gaikwad, A.; Biju, K.C.; Saha, S.G.; Subhedar, N. Neuropeptide Y in the olfactory system, forebrain and pituitary of the teleost, Clarias batrachus. J. Chem. Neuroanat. 2004, 27, 55–70. [Google Scholar] [CrossRef]
- Danger, J.M.; Guy, J.; Benyamina, M.; Je’gou, S.; Leboulenger, F.; Cote’, J.; Tonon, M.C.; Pelletier, G.; Vaudry, H. Localization and identification of neuropeptide Y (NPY)-like immunoreactivity in the frog brain. Peptides 1985, 6, 1225–1233. [Google Scholar] [CrossRef]
- Medina, L.; Martì, E.; Artero, C.; Fasolo, A.; Puelles, L. Distribution of neuropeptide Y-like immunoreactivity in the brain of the lizard Gallotia galotti. J. Comp. Neurol. 1992, 319, 387–405. [Google Scholar] [CrossRef] [PubMed]
- Boswell, T.; Millam, J.R.; Li, Q.; Dunn, I.C. Cellular localization of neuropeptide Y mRNA and peptide in the brain of the Japanese quail and domestic chicken. Cell Tissue Res. 1998, 193, 31–38. [Google Scholar] [CrossRef] [PubMed]
- Allen, Y.S.; Adrian, T.E.; Allen, J.M.; Tatemoto, K.; Crow, T.J.; Bloom, S.R.; Polak, J.M. Neuropeptide Y distribution in the rat brain. Science 1983, 221, 877–879. [Google Scholar] [CrossRef] [PubMed]
- Fraley, G.S.; Kuenzel, W.J. Precocious puberty in chicks (Gallus domesticus) induced by central injection of neuropeptide Y. Life Sci. 1993, 52, 1649–1656. [Google Scholar] [CrossRef]
- Fiore, M.; Clayton, N.S.; Pistillo, L.; Angelucci, F.; Alleva, E.; Aloe, L. Song behavior, NGF level and NPY distribution in the brain of adult male zebra finches. Behav. Brain. Res. 1999, 101, 85–92. [Google Scholar] [CrossRef]
- Mercer, R.E.; Chee, M.J.; Colmers, W.F. The role of NPY in hypothalamic mediated food intake. Front. Neuroendocrinol. 2011, 32, 398–415. [Google Scholar] [CrossRef]
- Wallman, J.; McKenna, O.C.; Burns, S.; Velez, J.; Weinstein, B. Relation of the accessory optic system and pretectum to optokinetic responses in chickens. In Progress in oculomotor research; Fuchs, A., Becker, W., Eds.; Elsevier: North Holland, NY, USA, 1981; pp. 435–442. [Google Scholar]
- Mishra, I.; Agarwal, N.; Rani, S.; Kumar, V. Scotostimulation of reproductive neural pathways and gonadal maturation are not correlated with hypothalamic expression of deiodinases in subtropical spotted munia. J. Neuroendocrinol. 2018, 30, e12627. [Google Scholar] [CrossRef]
- Surbhi; Rastogi, A.; Malik, S.; Rani, S.; Kumar, V. Changes in brain peptides associated with reproduction and energy homeostasis in photosensitive and photorefractory migratory redheaded buntings. Gen.Com. Endocrinol. 2016, 230–231, 67–75. [Google Scholar] [CrossRef]
- Rastogi, A.; Kumari, Y.; Rani, S.; Kumar, V. Neural correlates of migration: Activation of hypothalamic clock(s) in and out of migratory state in the black headed bunting (Emberiza melanocephala). PLoS ONE 2013, 8, e70065. [Google Scholar] [CrossRef] [Green Version]
- Thorsell, A.; Heilig, M. Diverse functions of neuropeptide Y revealed using genetically modified animals. Neuropeptides 2002, 36, 182–193. [Google Scholar] [CrossRef] [PubMed]
- Decressac, M.; Barker, R.A. Neuropeptide Y and its role in CNS disease and repair. Exp. Neurol. 2012, 238, 265–272. [Google Scholar] [CrossRef] [PubMed]
- Gotzsche, C.R.; Woldbye, D.P. The role of NPY in learning and memory. Neuropeptides 2016, 55, 79–89. [Google Scholar] [CrossRef] [PubMed]
- Reichmann, F.; Holzer, P. Neuropeptide Y: A stressful review. Neuropeptides 2016, 55, 99–109. [Google Scholar] [CrossRef] [PubMed] [Green Version]
- Berman, N.E.; Fredrickson, E. Morphology and laminar distribution of neuropeptide Y immunoreactive neurons in the human striate cortex. Synapse 1992, 11, 20–27. [Google Scholar] [CrossRef] [PubMed]
- Van Reeth, O.; Goldman, S.; Schiffmann, S.; Verstappen, A.; Pelletier, G.; Vaudry, H.; Vanderhaeghen, J.J. Distribution of neuropeptide Y immunoreactivity in human visual cortex and underlying white matter. Peptides 1987, 8, 1107–1117. [Google Scholar] [CrossRef]
- Hendry, S.H.; Jones, E.G.; Emson, P.C. Morphology, distribution, and synaptic relations of somatostatin- and neuropeptide Y-immunoreactive neurons in rat and monkey neocortex. J. Neurosci. 1984, 4, 2497–2517. [Google Scholar] [CrossRef] [Green Version]
- Kuljis, R.O.; Rakic, P. Neuropeptide Y-containing neurons are situated predominantly outside cytochrome oxidase puffs in macaque visual cortex. Vis. Neurosci. 1989, 2, 57–62. [Google Scholar] [CrossRef]
- Kuljis, R.O.; Rakic, P. Distribution of neuropeptide Y-containing perikarya and axons in various neocortical areas in the macaque monkey. J. Comp. Neurol. 1989, 280, 383–392. [Google Scholar] [CrossRef]
- Kuljis, R.O.; Rakic, P. Multiple types of neuropeptide Y-containing neurons in primate neocortex. J. Comp. Neurol. 1989, 280, 393–409. [Google Scholar] [CrossRef]
- Hogan, D.; Berman, N.E. The development of neuropeptide Y immunoreactive neurons in cat visual cortical areas. Brain Res. Dev. Brain Res. 1992, 67, 343–369. [Google Scholar] [CrossRef]
- Wahle, P.; Meyer, G.; Albus, K. Localization of NPY-immunoreactivity in the cat’s visual cortex. Exp. Brain Res. 1986, 61, 364–374. [Google Scholar] [CrossRef]
- Wahle, P.; Meyer, G. Morphology and quantitative changes of transient NPY-ir neuronal populations during early postnatal development of the cat visual cortex. J. Comp. Neurol. 1987, 261, 165–192. [Google Scholar] [PubMed]
- Papadopoulos, G.C.; Parnavelas, J.G.; Cavanagh, M.E. Extensive co-existence of neuropeptides in the rat visual cortex. Brain Res. 1987, 420, 95–99. [Google Scholar] [CrossRef]
- Gonchar, Y.; Wang, Q.; Burkhalter, A. Multiple distinct subtypes of GABAergic neurons in mouse visual cortex identified by triple immunostaining. Front. Neuroanat. 2008, 28, 3. [Google Scholar] [CrossRef] [PubMed] [Green Version]
- Montesano, A.; Baumgart, M.; Avallone, L.; Castaldo, L.; Lucini, C.; Tozzini, E.T.; Cellerino, A.; D’Angelo, L.; de Girolamo, P. Age-related central regulation of orexin and NPY in the short-lived African killifish Nothobranchius furzeri. J. Comp. Neurol. 2019, 527, 1508–1526. [Google Scholar] [CrossRef] [PubMed]
- Suzuki, H.; Yamamoto, T.; Nakagawa, M.; Uemura, H. Neuropeptide Y-immunoreactive neuronal system and colocalization with FMRFamide in the optic lobe and peduncle complex of the octopus (Octopus vulgaris). Cell Tissue Res. 2002, 307, 255–264. [Google Scholar] [PubMed]
- Bennis, M.; Ba m’hamed, S.; Rio, J.P.; Le Cren, D.; Reperant, J.; Ward, R. The distribution of NPY-like immunoreactivity in the chameleon brain. Anat. Embryol. 2001, 203, 121–128. [Google Scholar] [CrossRef] [PubMed]
- Chapman, A.M.; Debski, E.A. Neuropeptide Y immunoreactivity of a projection from the lateral thalamic nucleus to the optic tectum of the leopard frog. Vis. Neurosci. 1995, 12, 1–9. [Google Scholar] [CrossRef] [PubMed]
- Aoki, C.; Pickel, V.M. Neuropeptide Y in cortex and striatum. Ultrastructural distribution and coexistence with classical neurotransmitters and neuropeptides. Ann. N. Y. Acad. Sci. 1990, 611, 186–205. [Google Scholar]
- Clark, C.M.; Clark, R.M.; Hoyle, J.A.; Dickson, T.C. Pathogenic or protective? Neuropeptide Y in amyotrophic lateral sclerosis. J. Neurochem. 2020, 156, 273–289. [Google Scholar]
- Duarte-Neves, J.; Gonçalves, N.; Cunha-Santos, J.; Simões, A.T.; den Dunnen, W.F.; Hirai, H.; Kügler, S.; Cavadas, C.; Pereira de Almeida, L. Neuropeptide Y mitigates neuropathology and motor deficits in mouse models of Machado-Joseph disease. Hum. Mol. Genet. 2015, 24, 5451–5463. [Google Scholar] [CrossRef] [PubMed] [Green Version]
- Klüver, H.; and Barrera, E. A method for the combined staining of cells and fibres in the nervous system. J. Neuropathol. Exp. Neurol. 1953, 12, 400–403. [Google Scholar] [CrossRef] [PubMed]
- Kumar, V.; Goguen, D.M.; Guido, M.E.; Rusak, B. Melatonin does not influence the expression of c-fos in the suprachiasmatic nucleus of rats and hamsters. Mol. Brain Res. 1997, 52, 242–248. [Google Scholar] [CrossRef]
- Singh, D.; Kumari, Y.; Rastogi, A.; Rani, S.; and Kumar, V. Neuropeptide Y mRNA and peptide in the night-migratory redheaded bunting brain. Cell. Tissue Res. 2013, 354, 551–562. [Google Scholar] [CrossRef]
- Rastogi, A.; Kumari, Y.; Rani, S.; Kumar, V. Phase inversion of neural activity in the olfactory and visual systems of a night-migratory bird during migration. Eur. J. Neurosci. 2011, 34, 99–109. [Google Scholar] [CrossRef]
- Stokes, T.M.; Leonard, C.M.; Nottebohm, F. The telencephalon, diencephalon, and mesencephalon of the canary, Serinus canaria, in stereotaxic coordinates, J. Comp. Neurol. 1974, 156, 337–374. [Google Scholar] [CrossRef]
- Kuenzel, W.J.; Masson, M.A. Stereotaxic Atlas of the Brain of the Chick (Gallus domesticus); Johns Hopkins University Press: Baltimore, MD, USA, 1988. [Google Scholar]
- Reiner, A.; David, J.P.; Bruce, L.L.; Butler, A.B.; Csillag, A.; Kuenzel, W.; Medina, L.A.; Paxinos, G.; Shimizu, T.; Striedter, G.; et al. Revised Nomenclature for Avian Telencephalon and Some Related Brainstem Nuclei. J. Comp. Neurol. 2004, 473, 377–414. [Google Scholar] [CrossRef]
- Gentner, T.Q.; Hulse, S.H.; Duffy, D.; Ball, G.F. Response biases in auditory forebrain regions of female songbirds following exposure to sexually relevant variation in male song. J. Neurobiol. 2001, 46, 48–58. [Google Scholar] [CrossRef]
- Shimizu, T.; Bowers, A.N.; Budzynski, C.A.; Kahn, M.C.; Bingman, V.P. What does a pigeon (Columba livia) brain look like during homing: Selective examination of ZENK expression. Behav. Neurosci. 2004, 118, 845–851. [Google Scholar] [CrossRef]
- Patzke, N.; Manns, M.; Güntürkün, O.; Ioalè, P.; and Gagliardo, A. Navigation-induced ZENK expression in the olfactory system of pigeons (Columba livia). Eur. J. Neurosci. 2010, 31, 2062–2072. [Google Scholar] [CrossRef]
- Sakharkar, A.J.; Singru, P.S.; Sarkar, K.; Subhedar, N. Neuropeptide Y in the forebrain of the adult male cichlid fish Oreochromis mossambicus: Distribution, effects of castration and testosterone replacement. J. Comp. Neurol. 2005, 489, 148–165. [Google Scholar] [CrossRef] [PubMed]
- Bhatt, D.; Lakhera, C.P.; Saklani-Chandola, A. Effect of artificially simulated annual photocycles on testicular cycle of the spotted munia Lonchura punctulata. Indian J. Exp. Biol. 1987, 24, 747–749. [Google Scholar]
- Remage-Healey, L.; Romero, L.M. Daily and seasonal variation in response to stress in captive starlings (Sturnus vulgaris): Glucose. Gen. Comp. Endocrinol. 2000, 119, 60–68. [Google Scholar] [CrossRef]
- Buttemer, W.A.; Addison, B.A.; Klasing, K.C. The energy cost of feather replacement is not intrinsically inefficient. Can. J. Zool. 2019, 98, 2. [Google Scholar] [CrossRef] [Green Version]
- Braun, E.J.; Sweazea, K.L. Glucose regulation in birds. Comp. Bio. Physiol. Part B 2008, 151, 1–9. [Google Scholar] [CrossRef] [PubMed]
- Beuchat, C.A.; Chong, C.R. Hyperglycemia in hummingbirds and its consequences for hemoglobin glycation. Comp. Biochem. Physiol. A. 1998, 120, 409–416. [Google Scholar] [CrossRef]
- Renner, R.; Elcombe, A.M. Metabolic effects of feeding “carbohydrate-free” diets to chicks. J. Nutr. 1967, 93, 31–36. [Google Scholar] [CrossRef]
- Tinker, D.A.; Brosnan, J.T.; Herzberg, G.R. Interorgan metabolism of amino acids, glucose, lactate, glycerol and uric acid in the domestic fowl (Gallus domesticus). Biochem. J. 1986, 240, 829–836. [Google Scholar] [CrossRef] [Green Version]
- Adeghate, E. Pattern of distribution of neuropeptides in the camel lacrimal gland. Neuropeptides. 1996, 30, 566–571. [Google Scholar] [CrossRef]
- Cavallotti, C.; Artico, M.; Pescosolido, N.; Tranquilli Leali, F.M.; Pacella, E. Distribution of peptidergic nerve fibres in the guinea pig trabecular meshwork. Anat. Histol. Embryol. 2000, 29, 387–391. [Google Scholar] [CrossRef]
- Jones, M.A.; Marfurt, C.F. Peptidergic innervation of the rat cornea. Exp. Eye Res. 1998, 66, 421–435. [Google Scholar] [CrossRef]
- Lambiase, A.; Micera, A.; Sacchetti, M.; Cortes, M.; Mantelli, F.; Bonini, S. Alterations of tear neuromediators in dry eye disease. Arch. Ophthalmol. 2011, 129, 981–986. [Google Scholar] [CrossRef]
- Nilsson, S.F. Neuropeptide Y (NPY): A vasoconstrictor in the eye, brain and other tissues in the rabbit. Acta Physiol. Scand. 1991, 141, 455–467. [Google Scholar] [CrossRef]
- Paulsen, F.; Hallmann, U.; Paulsen, J.; Thale, A. Innervation of the cavernous body of the human efferent tear ducts and function in tear outflow mechanism. J. Anat. 2000, 197, 177–187. [Google Scholar] [CrossRef] [Green Version]
- Rittig, M.G.; Licht, K.; Funk, R.H. Innervation of the ciliary process vasculature and epithelium by nerve fibers containing catecholamines and neuropeptide Y. Ophthalmic Res. 1993, 25, 108–118. [Google Scholar] [CrossRef] [PubMed]
- Selbach, J.M.; Gottanka, J.; Wittmann, M.; Lutjen-Drecoll, E. Efferent and afferent innervation of primate trabecular meshwork and scleral spur. Investig. Ophthalmol. Vis. Sci. 2000, 41, 2184–2191. [Google Scholar]
- Selbach, J.M.; Schonfelder, U.; Funk, R.H. Arteriovenous anastomoses of the episcleral vasculature in the rabbit and rat eye. J. Glaucoma. 1998, 7, 50–57. [Google Scholar] [CrossRef]
- Stone, R.A.; Laties, A.M.; Emson, P.C. Neuropeptide Y and the ocular innervations of rat, guinea pig, cat and monkey. Neuroscience 1986, 17, 1207–1216. [Google Scholar] [CrossRef]
- Trivino, A.; de Hoz, R.; Rojas, B.; Salazar, J.J.; Ramirez, A.I.; Ramirez, J.M. NPY and TH innervation in human choroidal whole-mounts. Histol. Histopathol. 2005, 20, 393–402. [Google Scholar]
- Wetzel, R.K.; Eldred, W.D. Specialized neuropeptide Y- and glucagon-like immunoreactive amacrine cells in the peripheral retina of the turtle. Vis. Neurosci. 1997, 14, 867–877. [Google Scholar] [CrossRef] [PubMed]
- Yamaji, K.; Yoshitomi, T.; Usui, S. Action of biologically active peptides on monkey iris sphincter and dilator muscles. Exp. Eye Res. 2005, 80, 815–820. [Google Scholar] [CrossRef] [PubMed]
- Larhammar, D.; Blomqvist, A.G.; Yee, F.; Jazin, E.; Yoo, H.; Wahlested, C. Cloning and functional expression of a human neuropeptide Y/peptide YY receptor of the Y1 type. J. Biol. Chem. 1992, 267, 10935–10938. [Google Scholar] [CrossRef]
- Bruun, A.; Tornqvist, K.; Ehinger, B. Neuropeptide Y (NPY) immunoreactive neurons in the retina of different species. Histochemistry 1986, 86, 135–140. [Google Scholar] [CrossRef] [PubMed]
- Oh, S.J.; D’Angelo, I.; Lee, E.J.; Chun, M.H.; Brecha, N.C. Distribution and synaptic connectivity of neuropeptide Y-immunoreactive amacrine cells in the rat retina. J. Comp. Neurol. 2002, 446, 219–234. [Google Scholar] [CrossRef] [PubMed]
- Sinclair, J.R.; Nirenberg, S. Characterization of neuropeptide Y-expressing cells in the mouse retina using immunohistochemical and transgenic techniques. J. Comp. Neurol. 2001, 432, 296–306. [Google Scholar] [CrossRef]
- Ferriero, D.M.; Sagar, S.M. Development of neuropeptide Y-immunoreactive neurons in the rat retina. Brain Res. Dev. Brain Res. 1989, 48, 19–26. [Google Scholar] [CrossRef]
- Hiscock, J.; Straznicky, C. Neuropeptide Y- and substance P-like immunoreactive amacrine cells in the retina of the developing Xenopus laevis. Brain Res. Dev. Brain Res. 1990, 54, 105–113. [Google Scholar] [CrossRef]
- Hutsler, J.J.; Chalupa, L.M. Development of neuropeptide Y immunoreactive amacrine and ganglion cells in the pre- and postnatal cat retina. J. Comp. Neurol. 1995, 361, 152–164. [Google Scholar] [CrossRef]
- Jen, P.Y.; Li, W.W.; Yew, D.T. Immunohistochemical localization of neuropeptide Y and somatostatin in human fetal retina. Neuroscience 1994, 60, 727–735. [Google Scholar] [CrossRef]
- Jotwani, G.; Itoh, K.; Wadhwa, S. Immunohistochemical localization of tyrosine hydroxylase, substance P, neuropeptide-Y and leucine-enkephalin in developing human retinal amacrine cells. Brain Res. Dev. Brain Res. 1994, 77, 285–289. [Google Scholar] [CrossRef]
- Mathieu, M.; Tagliafierro, G.; Bruzzone, F.; Vallarino, M. Neuropeptide tyrosine-like immunoreactive system in the brain, olfactory organ and retina of the zebrafish, Danio rerio, during development. Brain Res. Dev. Brain Res. 2002, 139, 255–265. [Google Scholar] [CrossRef]
- Negishi, K.; Wagner, H.J. Differentiation of photoreceptors, glia, and neurons in the retina of the cichlid fish Aequidens pulcher; an immunocytochemical study. Brain Res. Dev. Brain Res. 1995, 89, 87–102. [Google Scholar] [CrossRef]
- Prada Oliveira, J.A.; Verastegui Escolano, C.; Gomez Luy, C.; Collantes Ruiz, J. Ontogenic attendance of neuropeptides in the embryo chicken retina. Histol. Histopathol. 2003, 18, 1013–1026. [Google Scholar]
- D’Angelo, I.; Brecha, N.C. Y2 receptor expression and inhibition of voltage dependent Ca2þ influx into rod bipolar cell terminals. Neuroscience 2004, 125, 1039–1049. [Google Scholar] [CrossRef] [PubMed]
- Morin, L.P.; Allen, C.N. The circadian visual system. Brain Res. Rev. 2006, 51, 102–127. [Google Scholar] [CrossRef]
- Benowitz, L.I.; Karten, H.J. Organization of the tectofugal visual pathway in the pigeon: A retrograde transport study. J. Comp. Neurol. 1976, 167, 503–520. [Google Scholar] [CrossRef]
- Granda, A.M.; Yazulla, S. The spectral sensitivity of single units in the nucleus rotundus of Pigeon, Columba livia. J. Gen. Physiol. 1971, 57, 363–384. [Google Scholar] [CrossRef] [Green Version]
- Beck, B.; Pourié, G. Ghrelin. Neuropeptide Y, and other feeding-regulatory peptides active in the hippocampus: Role in learning and memory. Nutr. Rev. 2013, 71, 541–561. [Google Scholar] [CrossRef] [PubMed]
- Kuenzel, W.J. Neuroanatomical substrates involved in the control of food intake. Poult. Sci. 1989, 68, 926–937. [Google Scholar] [CrossRef]
- Krützfeldt, N.O.; Wild, J.M. Definition and novel connections of the entopallium in the pigeon (Columba livia). J. Comp. Neurol. 2005, 490, 40–56. [Google Scholar] [CrossRef]
- Gioanni, H.; Palacios, A.; Sansonetti, A.; Varela, F. Role of the nucleus geniculatus lateralis ventralis (GLv) in the optokinetic reflex: A lesion study in the pigeon. Exp. Brain Res. 1991, 86, 601–607. [Google Scholar] [CrossRef] [PubMed]
- Kuenzel, W.J.; Kang, S.W.; Zhou, Z.J. Exploring avian deep-brain photoreceptors and their role in activating the neuroendocrine regulation of gonadal development. Poult. Sci. 2015, 94, 786–798. [Google Scholar] [CrossRef] [PubMed]
Figure 1.
Physiological response at four different times of the year (regressed, pre-breeding, breeding and post breeding phase of the spotted munia). Changes (mean ± SEM, (a–d) in body mass, food intake, glucose, and testicular volume of Spotted Munia (Lonchura punctulata) at four different times of the year. Different alphabet above the bar represent significant difference whereas, an asterik (*) on the bar indicates the significant difference in the aforementioned physiological parameters at different times of the year, as determined by one-way ANOVA followed by Newman–Keuls for body mass and blood glucose level, and Kruskal–Wallis followed by Dunn’s multiple comparison post-hoc test for testicular volume and food intake; p < 0.05 was considered a statistically significant difference.

Figure 2.
Changes in neuropeptide (NPY) immunoreactivity at four different times of the year (regressed, pre-breeding, breeding and post breeding phase of the spotted munia). Upper panel shows the schematic diagrams of the brain areas taken into consideration for the quantification of NPY expression. Middle panel shows the photomicrographs of brain sections at 10× magnification (inset image-magnified view at 40× magnification) showing immunoreactivity in the hyperpallium apicle (HA) (A–D), hippocampus (HP) (E–H) and nucleus rotundus (RoT) (I–L) of Spotted Munia (Lonchura punctulata) at four different times of the year. The dotted circle shows the nuclei in consideration. The last panel shows (mean ± SEM, n = 5) immunoreactive (-ir) cell numbers calculated from NPY-ir sections. An asterisk (*) indicates a significant difference in the immunoreactivity, as determined by Kruskal–Wallis followed by Dunn’s multiple comparison post-hoc test, p < 0.05 was considered a statistically significant difference. Scale bar: general view—200µm, magnified view—50 µm.

Figure 3.
Changes in neuropeptide (NPY) fiber immunoreactivity at four different times of the year (regressed, pre-breeding, breeding and post breeding phase of the spotted munia). Upper panel shows the schematic diagram of the brain areas taken into consideration for the quantification of NPY fiber area. Middle panel shows the photomicrographs of brain sections at 10× magnification showing immunoreactivity in the opticum tectum (TeO) (A–D), and geniculatus lateralis ventralis (GLv) (E–H) of Spotted Munia (Lonchura punctulata) athe intracellular calcium concentratiot four different times of the year. The circle shows the nuclei in consideration. The lower panel shows (mean ± SEM, n = 5) immunoreactive (ir) cell fiber area calculated from NPY-ir sections. An asterisk (*) indicates a significant difference in the immunoreactivity, as determined by one-way ANOVA followed by Newman–Keuls post-hoc test; p < 0.05 was considered a statistically significant difference. Scale bar: general view- 200µm.

Publisher’s Note: MDPI stays neutral with regard to jurisdictional claims in published maps and institutional affiliations. |
© 2022 by the authors. Licensee MDPI, Basel, Switzerland. This article is an open access article distributed under the terms and conditions of the Creative Commons Attribution (CC BY) license (https://creativecommons.org/licenses/by/4.0/).
Share and Cite
MDPI and ACS Style
Naseem, A.; Vaish, V.; Rani, S.; Malik, S. Seasonal Differences in Expression of Neuropeptide Y (NPY) in Visual Centers of Spotted Munia (Lonchura punctulata). Birds 2022, 3, 245-259. https://doi.org/10.3390/birds3030016
AMA Style
Naseem A, Vaish V, Rani S, Malik S. Seasonal Differences in Expression of Neuropeptide Y (NPY) in Visual Centers of Spotted Munia (Lonchura punctulata). Birds. 2022; 3(3):245-259. https://doi.org/10.3390/birds3030016
Chicago/Turabian StyleNaseem, Asma, Vaibhav Vaish, Sangeeta Rani, and Shalie Malik. 2022. "Seasonal Differences in Expression of Neuropeptide Y (NPY) in Visual Centers of Spotted Munia (Lonchura punctulata)" Birds 3, no. 3: 245-259. https://doi.org/10.3390/birds3030016