Article

Effects of High Dietary Carbohydrate Levels on Growth Performance, Enzyme Activities, Expression of Genes Related to Liver Glucose Metabolism, and the Intestinal Microbiota of Lateolabrax maculatus Juveniles

1
College of Fisheries and Life Sciences, Dalian Ocean University, Dalian 116023, China
2
Key Laboratory of Fishery Resources Development and Utilization in South China Sea, South China Sea Fisheries Research Institute, Ministry of Agriculture and Rural Affairs, Guangzhou 510300, China
3
Key Laboratory of Aquatic Product Processing, Ministry of Agriculture and Rural Affairs, South China Sea Fisheries Research Institute, Chinese Academy of Fishery Sciences, Guangzhou 510300, China
4
Key Laboratory of Efficient Utilization and Processing of Marine Fishery Resources of Hainan Province, Sanya 572426, China
5
Shenzhen Base of South China Sea Fisheries Research Institute, Chinese Academy of Fishery Sciences, Shenzhen 518121, China
*
Authors to whom correspondence should be addressed.
Fishes 2023, 8(9), 431; https://doi.org/10.3390/fishes8090431
Submission received: 8 July 2023 / Revised: 15 August 2023 / Accepted: 16 August 2023 / Published: 23 August 2023

Abstract

:
The present study was conducted to investigate the effects of high dietary carbohydrate levels on growth performance, enzyme activities, and gene expressions related to liver glucose metabolism and the intestinal microbiota of Lateolabrax maculatus juveniles. Two experimental diets with levels of carbohydrates (20% and 30%, named the NCD group and the HCD group, respectively) were designed to feed L. maculatus (initial weight 9.45 ± 0.03 g) for 56 days. The results showed that, compared with the NCD group, the condition factor (CF) was significantly elevated in the HCD group (p < 0.05). The plasma advanced glycosylation end products (AGEs), glycated serum protein (GSP), total cholesterol (TC), triglycerides (TG), high-density lipoprotein (HDL), low-density lipoprotein (LDL), and glutamate aminotransferase (AST) were significantly higher in the HCD group than those in the NCD group (p < 0.05). The intestinal lipase, chymotrypsin, and α-amylase in the HCD group were significantly higher than those in the NCD group (p < 0.05). The liver superoxide dismutase (SOD), total antioxidant capacity (T-AOC), and catalase (CAT) were significantly lower in the HCD group than in the NCD group (p < 0.05). The liver malondialdehyde (MDA) and hexokinase (HK) levels were significantly higher than those in the NCD group (p < 0.05). In the histopathological findings, liver cells in the HCD group appeared to have many vacuoles, and the number of lipid droplets increased. Compared with the NCD group, the relative expression of liver glucokinase (GK) and glycogen synthetase kinase-3 (GSK3β) genes in the HCD group was significantly increased (p < 0.05), while the relative expression of phosphoenolpyruvate carboxykinase (PEPCK) and glycogen phosphorylase (GP) genes in the HCD group was significantly reduced (p < 0.05). High-throughput 16S rRNA gene sequencing showed that high dietary carbohydrate intake changed the composition and structure of the intestinal microbiota. At the phylum level of the intestinal microbiota, high dietary carbohydrates decreased the relative abundance of Firmicutes and increased the relative abundance of Proteobacteria and Bacteroidetes. At the genus level of the intestinal microbiota, high carbohydrates decreased the relative abundance of Bacillus and increased the relative abundance of Photobacterium and Paraclostridium. From the results of this experiment on L. maculatus, high carbohydrates led to increased condition factor and liver glycogen, lipid deposition, decreased antioxidant capacity of the liver, increased relative abundance of harmful intestinal microorganisms, and disrupted glucose metabolism.
Key Contribution: This experiment investigated the effects of high dietary carbohydrate levels on growth performance, intestinal and liver enzyme activities, expression of genes related to liver glucose metabolism, and the intestinal microbiota of Lateolabrax maculatus juveniles.

1. Introduction

For living organisms, carbohydrates provide energy and organic carbon [1]. A carbohydrate source is regarded as the most economical energy source for artificial feed. In addition, including carbohydrates in the diet has a protein-sparing effect, lowers ammonia nitrogen excretion, and minimizes water pollution, all of which contribute to the feed industry’s sustainable growth. Fish, however, have a restricted capacity to use dietary carbohydrates. Usually, hyperglycemia shows up after glucose loading or carbohydrate intake [2]. Carnivorous fish exhibit limited utilization of carbohydrates as a result of their shorter intestine, inadequate secretion of α-amylase, a low count of insulin receptors, and the absence of inhibition in postprandial gluconeogenesis [3]. However, the metabolic variations among fish remain inadequately characterized, thus necessitating an investigation into the dietary carbohydrates’ mechanism of metabolic regulation in fish.
The liver serves as the primary site for glucose metabolism in fish, encompassing various processes such as glycolysis, gluconeogenesis, the pentose phosphate pathway, glycogen synthesis, and glycogenolysis. The regulation of glucose production and storage is influenced by hormonal and nutritional factors, which are contingent upon the expression and activity levels of crucial enzymes involved in the gluconeogenic and glycolytic pathways. Both the loss of glycemic control in coho salmon (O. kisutch) given a streptozotocin injection and insulin production by Atlantic hagfish (Myxine glutinosa) induced by glucose demonstrate the existence of a glucose homeostasis system in fish [4,5]. Glycolysis, gluconeogenesis, glycogen synthesis, and glycogenolysis are all involved in the control of homeostasis glucose [6]. As a result of increased 6-phosphofructo-1-kinase (FBP), pyruvate kinase (PK), and glucokinase (GK) activity, the glycolytic pathway is up-regulated in the liver of many carnivorous fish species during postprandial settings. In earlier studies, carbohydrates had an impact on the gut microbiota and the transcription of genes involved in glucose metabolism. According to a previous study on Megalobrama amblycephala, neither the number of dietary carbohydrates nor the timing of the samples had an impact on the transcription of phosphoenolpyruvate carboxylase (PEPCK). However, the transcriptions of GK, PK, and glycogen synthase (GS) were considerably greater in the high-carbohydrates group than in the control group, whereas the transcriptions of FBP were the opposite [3]. High carbohydrate levels were found to enhance the prevalence of the hazardous microorganisms Vibrio, Photobacterium, and Mycoplasma in Trachinotus ovatus studies [7]. Glycogen synthase (GS) and glycogen phosphorylase are two important enzymes that control the accumulation of glycogen with regard to glycogen metabolism; increased hepatic glycogen after dietary carbohydrate consumption has been documented in certain fish. According to previous studies, after consuming a high-carbohydrate diet, the hepatic glycogen levels were increased by inducing glycogen synthesis and inhibiting glycogenolysis [8,9]. However, the exact mechanism by which a high-carbohydrate diet affects crucial glucose metabolism enzymes and thus results in abnormalities of glucose metabolism in Lateolabrax maculatus is still not fully understood and warrants further study.
Animals’ bodies require intestinal microflora, which also plays a crucial physiological function in the host’s immunological antagonism and the absorption of nutrients [8]. The consumed feed served as the major source of gut flora [10]. Numerous studies have demonstrated a connection between diseases and metabolic disorders and excessive carbohydrate intake [11]. Studies on the impact of dietary carbohydrate levels on the health of fish guts, however, are few [11].
The spotted sea bass (L. maculatus), a carnivorous fish that belongs to the family Moronidae (Perciformes), has distinctive conspicuous black spots on the side of its body [12]. Since the creation of the genus Lateolabrax, it has been regarded as a congeneric species alongside Lateolabrax japonicus. The L. maculatus has a larger geographic range than L. japonicus, extending from the Bohai Sea to the Indo-Chinese peninsula [13]. Due to its broad adaptability, quick growth, and high market demand, the cultivation of L. maculatus is becoming more widespread. According to the 2022 China Fisheries Statistical Yearbook, 199,106 tons of this fish are produced in China [14]. In light of this, the authors of this study examined the effects of increased carbohydrate intake on growth performance, plasma biochemical indices, intestinal and liver enzyme activities, liver glucose metabolism gene expression, and intestinal microflora in L. maculatus.

2. Materials and Methods

2.1. Experimental Design and Diet Formulation

The formulation and chemical composition of the experimental diets are presented in Table 1. The protein sources mainly include fish meals and casein. The lipid source is mainly fish oil. The carbohydrate source is mostly cornstarch. A normal carbohydrate diet and a high carbohydrate diet (NCD: 20%; HCD: 30%) were formulated as two dietary carbohydrate levels for L. maculatus. The ingredients were ground through a 40-mesh screen. Minerals and vitamins were mixed by the progressive enlargement method [15]. For the premixed dry ingredients, we added lipid and distilled water to a feed mixer and thoroughly mixed until homogenous [16]. The 2.5-mm-diameter pellets were wet-extruded by a pelletizer (F-26, South China University of Technology, Guangzhou, China) and air-dried. All diets in plastic bags were sealed and stored at −20 °C.

2.2. Animal Rearing and Feeding Trial

L. maculatus was obtained from Shenzhen Long Qi Zhuang Industrial Development Co., Ltd. (Shenzhen, China). Fish were adapted for 14 days in polythene cages and fed commercial diets of L. maculatus (Guangdong Yuequn Marine Life Research and Development Co., Ltd., Jieyang, China). Then, similar-sized fish (average weight, 9.45 ± 0.03 g) were randomly distributed into six cages (1.0 m × 1.0 m × 1.5 m) at a rate of 25 fish per cage. One of two experimental diets was randomly assigned to fish in each cage, and each diet was tested triplicate. Fish were fed two times daily to apparent satiation (6:00 and 18:00 h) for 56 days. During experiments, the pH and the water temperature were 7.63–8.44 and 28.2–32.3 °C, respectively; the salinity and the dissolved oxygen were 25‰ and greater than 5.1 mg/L, respectively.

2.3. Sampling

After completing the feeding experiment, we weighed the fish after a whole day of starvation. The diluted MS-222 was used for fish that were anesthetized (Sigma, St. Louis, MO, USA). Three fish were sampled randomly from each cage for sampling. Intraperitoneal lipids and individual liver viscera were all quickly separated. Blood was collected from the caudal vein. Intestinal and liver were peeled from each L. maculatus, and the samples were quickly frozen in nitrogen and stored at −80 °C until analyses. Three fish were sampled randomly from each cage to obtain intestinal samples, which were immediately fixed in a 4% paraformaldehyde solution. Three fish were sampled randomly from each cage to obtain liver samples, which were immediately fixed fish liver sections in neutral-buffered formalin.

2.4. Measurements of Liver Glycogen

The liver glycogen content is determined by the colorimetric method using commercial assay kits (Beijing Huaying Biotechnology Research Institute, Beijing, China, Serial Number: HY-M0023).

2.5. Biochemical Parameters

We measured plasma glucose using the glucose oxidase method [17,18]. Insulin (INS), plasma lactate (LD), pyruvate (PA), glycated serum protein (GSP), and Advanced Glycation End Products (AGES) levels were determined by means of an enzyme-linked immunosorbent assay (ELISA) using the Huawei Delong DR-200BS Enzyme Labeling Analyzer. Determinations of total cholesterol (TC), triglycerides (TG), high-density lipoprotein (HDL), low-density lipoprotein (LDL), glutamate aminotransferase (AST), alanine aminotransferase (ALT), intestinal digestive enzymes (lipase, α-amylase, chymotrypsin), tissue protein, total antioxidant capacity (T-AOC), superoxide dismutase (SOD), catalase (CAT), and malondialdehyde (MDA) were determined using an automatic biochemical analyzer (Myriad BS-420 Automatic Biochemical Instrument). The liver lipid peroxidation product (MDA), antioxidant enzymes (T-AOD, SOD, CAT), hexokinase (HK), and phosphoenolpyruvate carboxykinase (PEPCK) were all determined using commercial assay kits (Beijing Huaying Biotechnology Research Institute, Beijing, China, Serial Number: HY-M0003, HY-60021, HY-M0018, HY-M0001, HY-60087, HY-NE286).

2.6. Intestinal and Liver Histology

The intestine samples were fixed and dehydrated in a hierarchical series of ethyl alcohol embedded in paraffin, sliced into 5-μm thick sections, which use hematoxylin and eosin to stain (H&E). The intestine villus height was measured by Case Viewer, with ten values for each group. Liver and intestinal morphology were examined using a light microscope (Olympus CKX41 microscope, Tokyo, Japan). Liver samples were fixed in 10% buffered formalin, dehydrated in a graded ethanol series, and embedded in paraffin. Sections series of 4 μm were stained with hematoxylin and eosin (H&E). Oil Red O staining was performed as described in a previous study [19,20].

2.7. Real-Time PCR

Bass liver RNA was extracted using the Fore gene RNA kit, RNA quality was measured with 1% agarose gel electrophoresis, RNA concentration was measured with Nanodrop 2000 (Thermo Fisher Scientific, Waltham, MA USA), and RNA was reverse transcribed into cDNA using a kit (Evo M-MLV RT Kit with g DNA Clean for qPCR II (Accurate Biotechnology)) and stored at −20 °C. The real-time PCR amplification system (10 μL) consisted of 2 × SYBR Green Pro Taq HS Premix 5 μL, cDNA template 4.5 μL, upstream primer 0.25 μL, and downstream primer 0.25 μL. In this study, β-actin was selected as the internal reference, and the relative expression of the target gene was calculated using the 2−ΔΔCt method. The real-time PCR primer sequences of the gene of interest and the reference gene β-actin are shown in Table 2.

2.8. Intestinal Microbiota Communities

We used Hi Pure Soil DNA Kits (Magen, Guangzhou, China) to extract microbial DNA. We used PCR to amplify the 16S rDNA V4 region of the ribosomal RNA gene, using primers Arch519:CAGCMGCCGCGGTAA; Arch915R: GTGCTCCCCCGCCAATTCCT. In triplicate, we used a 50 μL mixture containing 5 μL of 10 × KOD Buffer, 5 μL of 2.5 mM dNTPs, 1.5 μL of each primer (5 μM), 1 μL of KOD Polymerase, and 100 ng of template DNA for PCR reactions. The AxyPrep DNA Gel Extraction Kit (Axygen Biosciences, Union City, CA, USA) was used for amplicons extracted from 2% agarose gels. The ABI Step One Plus Real-Time PCR System (Life Technologies, Foster City, CA, USA) was used to quantify. According to the standard protocols, purified amplicons were pooled in equimolar quantities and paired-end sequenced (2 × 250) on an Illumina platform.

2.9. Statistical Analysis

Statistical analysis was performed using IBM SPSS Statistics 26.0 software (IBM Corporation, Somers, NY, USA) to determine differences using an independent sample t-test. Normality and homoscedasticity assumptions were confirmed prior to any statistical analysis. Significant differences in values between the NCD and HCD groups (p < 0.05) are indicated by an asterisk above the histogram. All results are indicated as the mean ± standard error.

3. Results

3.1. Growth Performance

Compared with the NCD group, the CF and liver glycogen were significantly increased in the HCD group (p < 0.05) (Table 3). The survival rate (SR), weight gain rate (WGR), specific growth rate (SGR), and viscerosomatic index (VSI) in the HCD group decreased, and there was no significant difference between the two groups (p > 0.05). The feed coefficient (FCR), hepatosomatic index (HSI), carcass index (CI), and visceral adipose index (VAI) increased, and there was no significant difference between the two groups (p > 0.05).
Weight gain rate (WGR, %) = (final weight (g) − initial weight (g))/initial weight (g) × 100
Specific growth rate (SGR, %·d−1) = (ln final weight − ln initial weight)/days × 100
Feed coefficient (FC) = total feed consumption/(final gross weight − initial gross weight)
Hepatosomatic index (HSI) = liver weight/body weight × 100
Viscerosomatic index (VSI) = visceral weight/body weight × 100
Condition factor (CF) = body weight (g) × 100/body length (cm3)
Survival rate (SR, %) = terminal number/initial mantissa × 100
Carcass index (CI, %) = carcass weight/body weight × 100
Visceral adipose index (VAI, %) = (visceral adipose weight (g)/whole body weight (g)) × 100
Feed conversion ratio (FCR) = feed intake (g)/(final weight (g) − initial weight (g) × 100

3.2. Plasma Metabolites Levels

AGEs, GSP, TC, TG, HDL, LDL, and AST in the HCD group were significantly higher than those in the NCD group (p < 0.05) (Table 4). Compared with the NCD group, INS, LD, PA, GLU, and ALT increased in the HCD group, and there was no significant difference between the two groups (p > 0.05).

3.3. Intestinal and Liver Enzyme Activities

The intestinal lipase, α-amylase, and chymotrypsin in the HCD group were significantly higher than those in the NCD group (p < 0.05) (Table 5). The liver SOD, T-AOC, and CAT in the HCD group were significantly lower than those in the NCD group (p < 0.05), and MDA was significantly higher than that in the NCD group (p < 0.05) (Table 6). The liver HK was significantly higher than that in the NCD group (p < 0.05). There was no significant difference in PEPCK between the two groups (p > 0.05) (Table 7).

3.4. Intestinal Morphology and Liver Morphology

Compared with the NCD group, the HCD group’s height uniformity and integrity of the intestinal villi were compromised, and there was a tendency for the intestinal villi to shorten and the spacing of the villi to increase (Figure 1b). The villus height in the HCD group was significantly lower than that in the NCD group (p < 0.05) (Table 8).
The high carbohydrate effects on liver morphology and liver lipid content in L. maculatus are shown in Figure 2. In the NCD group, which had a complete structure and uniform shape, the density of nuclei in hepatocytes was uniform and numerous (Figure 2a). In the HCD group, the liver vacuoles increased, cell boundaries were blurred, and the number of nuclei decreased (Figure 2b). Compared with the NCD group, in the HCD group, the number of lipid droplets in the oil red O stained under high carbohydrate conditions increased, and the lipid droplets became larger (Figure 2c,d).

3.5. Liver Transcription of Genes Related to Glucose Metabolism

The mRNA levels of GK in the HCD group increased compared to the NCD group (p < 0.05) (Figure 3). The transcription of phosphofructokinase 1 (PFK) and pyruvate kinase (PK) was not affected by dietary carbohydrate levels (p > 0.05). The mRNA levels of PEPCK were significantly reduced in the HCD group compared with the NCD group (p < 0.05) (Figure 4). The transcription of pyruvate carboxylase (PC), glucose-6 phosphatase (G6pase), and fructose-1,6-bisphosphatase (FBP) was not affected by dietary carbohydrate levels (p > 0.05). Compared with the NCD group, the mRNA levels of glycogen synthase kinase3β (GSK3β) in the HCD group were significantly increased (p < 0.05) (Figure 5). The mRNA levels of glycogen phosphorylase (GP) were significantly reduced (p < 0.05). The transcription of glucose 6-phosphate dehydrogenase (G6PD) was not affected by dietary carbohydrate levels (p > 0.05).

3.6. Intestinal Microbiota Community Structures

The main intestinal phylum levels of L. maculatus are Firmicutes, Proteobacteria, and Bacteroidetes are shown in Figure 6. The relative abundance of the intestinal microbiota varied, and the total number of OTUs increased as the level of carbohydrates increased (Table 9). Compared with the NCD group, the relative abundance of Firmicutes in the HCD group decreased. The relative abundance of Proteobacteria and Bacteroidetes increased. The genera of intestinal dominance in L. maculatus juveniles are Bacillus, Paraclostridium, and Photobacterium (Figure 7). As carbohydrate levels increased, the relative abundance of intestinal flora changed. Compared with the NCD group, the relative abundance of Bacillus in the HCD group decreased, whereas the relative abundance of Paraclostridium and Photobacterium increased. The principal coordinate analysis confirmed no similarity in the composition of intestinal microorganisms between the two groups, indicating that high carbohydrates affected the composition of L. maculatus intestinal microbiota (Figure 8).

4. Discussion

As one of the three main sources of energy, carbohydrates are also one of the least expensive. Carbohydrates are added to the feed and utilized effectively, lowering feed costs and reducing the need for protein [21]. High-carbohydrate diets have been linked to low disease resistance, slow growth, and high mortality in fish, according to earlier research [22]. In the current study, the CF in the HCD group was noticeably higher than that in the NCD group, which was comparable to hybrid snakehead [23]. The growth balance was evaluated using the CF [24]. Therefore, it is hypothesized that the rise in CF shows that increased carbohydrate levels might promote lipid deposition. The SR, WGR, SGR, and VSI in the HCD group dropped, indicating that a 30% cornstarch level could negatively affect the growth of L. maculatus and cause some nutritional stress, similar to what occurs in Micropterus salmoides [25]. These findings suggested that the inability of fish to efficiently utilize carbohydrates may be related to their congenital diabetes [26]. Specifically in the liver or abdominal cavity, carbohydrates are transformed into glycogen through glycogen synthesis or lipid through lipid synthesis [27]. High carbohydrate intake improved liver glycogen, HSI, CI, and VAI in the current study. Similar results were seen for HSI and hepatic glycogen in other fish species, including Nile tilapia and M. amblycephala [3,28]. The steady rise in HSI, glycogen, or lipid is thought to be the outcome of either glycogen deposition or lipid deposition in L. maculatus.
An essential biomarker for assessing the body’s health is the blood indicator [27]. Many fish species (mostly carnivorous fish) exhibit chronic postprandial hyperglycemia after being fed digestible carbohydrates, which stimulates INS secretion [27]. In the present study, high carbohydrate intake caused higher INS. Reducing sugars (like glucose, for example) and free amino groups on proteins, lipids, and nucleic acids intensify their non-enzymatic glycosylation process, which results in the formation of irreversible Maillard products AGEs [29]. In mice, AGEs disrupted the metabolism of glucolipids and enhanced the inflammatory reaction [30]. GSP is a glycated protein with ketamine bonds created by a non-enzymatic glycation process between blood glucose and the amino group at the N-terminus of albumin and other protein molecules [31]. High-carbohydrate stimulation on M. amblycephala results in an increase in GLU, AGEs, and GSP, which is similar to the findings of the present study [32]. The glycolysis cycle produces PA, which can be changed into lactic acid [33]. High carbohydrate intake in the current study increased plasma PA. The balance of lipid metabolism depends on the transport of TC by HDL and LDL to organs such as the liver [34]. As a result, an increase in TC levels will likewise cause an increase in HDL and LDL levels. In the present study, elevated levels of TC, TG, HDL, and LDL levels in the HCD group suggested that high carbohydrate intake increased the production of lipids. This result is in line with the previous investigation into M. amblycephala [3]. The liver contains the enzymes AST and ALT, which are only released into the bloodstream in the event that the cell membranes and mitochondria of the liver are damaged [35]. In this study, high carbohydrate intake led to a rise in AST and ALT values. These findings suggested that L. maculatus’s liver health had been negatively impacted by a high-carbohydrate diet.
The organism’s ability to absorb and use nutrients can be seen in the activity of intestinal digestive enzymes. Chymotrypsin is a proteolytic enzyme released by the pancreas and can reflect how an organism uses proteins [36,37]. In the present study, the chymotrypsin activity of the HCD group was significantly higher than that in the NCD group, and this finding demonstrated that raising the level of carbohydrates promoted L. maculatus to use protein. Similar findings were presented in a previous study on C. carpio songpu, which discovered that the protease activity in the low-starch group was significantly lower than that of the high-starch group [36]. The study of Phoxinus lagowskii Dybowski showed that both omnivorous fish and herbivorous fish have a promoting effect on protease activity after the ingestion of high-carbohydrate feed [38]. In the study of S. meridionalis, carbohydrates slightly changed the activity of the protease activity. According to research on S. meridionalis, the variations in amylase activity at different carbohydrate levels were not statistically significant [39]. In contrast, the results of the present study indicated that amylase activity was significantly higher in the HCD group than in the NCD group, which is comparable with those found in Acanthopagrus schlegelii, Pseudosciaena crocea, and carp [40,41,42]. According to these findings, high dietary carbohydrate promotes glucose metabolism. One of the intestinal digestive enzymes, lipase, is involved in lipid synthesis [43]. In the current study, lipase activity was significantly higher in the HCD group than in the NCD group. Given that the findings were consistent with the elevated TC and TG levels in the plasma and the lipid accumulation in the liver in our investigation, we assume that a high-carbohydrate diet may promote lipid synthesis in L. maculatus. A similar result was obtained on Phoxinus lagowskii Dybowski [38]. However, studies on A. schlegelii and S. meridionalis have demonstrated that intestinal lipase activity is not significantly affected by dietary carbohydrate levels [42,44]. There is disagreement on how dietary carbohydrates affect lipase, and there are no reliable results. This topic might be further studied in the future.
SOD and CAT are crucial enzymes in the body’s first line of defense against the production of free radicals and other reactive chemicals in cells. Free radicals cause a number of diseases as they accumulate in the body [45]. MDA, the end product of polyunsaturated fatty acid (PUFA) degradation, is a marker of lipid peroxidation [46]. The body’s antioxidant system can be evaluated for functionality using T-AOC [47]. In this study, SOD, CAT, and T-AOC activities were significantly lower in the HCD group compared to the NCD group, although the MDA level was the opposite. It was hypothesized that high levels of carbohydrates would limit the body’s ability to produce antioxidants and result in a significant amount of the harmful chemical MDA. This result is similar to the research on M. amblycephala [16].
The first key enzyme in glycolytic and metabolic pathways is hexokinase (HK) [48]. In the present study, the activity of HK in the HCD group was significantly higher, indicating that high dietary carbohydrate intake may promote the glycolysis response. A similar result was also obtained in a previous study on Pelteobagrus vachelli [49]. However, previous studies on common carp and Dicentrarchus labrax revealed that the presence of carbohydrates has no impact on the activity of HK [50,51]. This could be due to the fact that hexokinase, which is virtually saturated, cannot react to slight fluctuations in blood glucose levels [52]. As a rate-limiting enzyme, PEPCK is a phosphoenolpyruvate carboxykinase that participates in the reaction of gluconeogenesis [53]. Similar to the findings for rainbow trout [54], the activity of PEPCK in this study was unaffected by dietary carbohydrate intake. However, some studies suggest that as carbohydrate levels rise, PEPCK activity declines [55]. When evaluating glucose metabolism, it is essential to consider not just diet composition but also feeding habits, life stage, and size, among other factors [27].
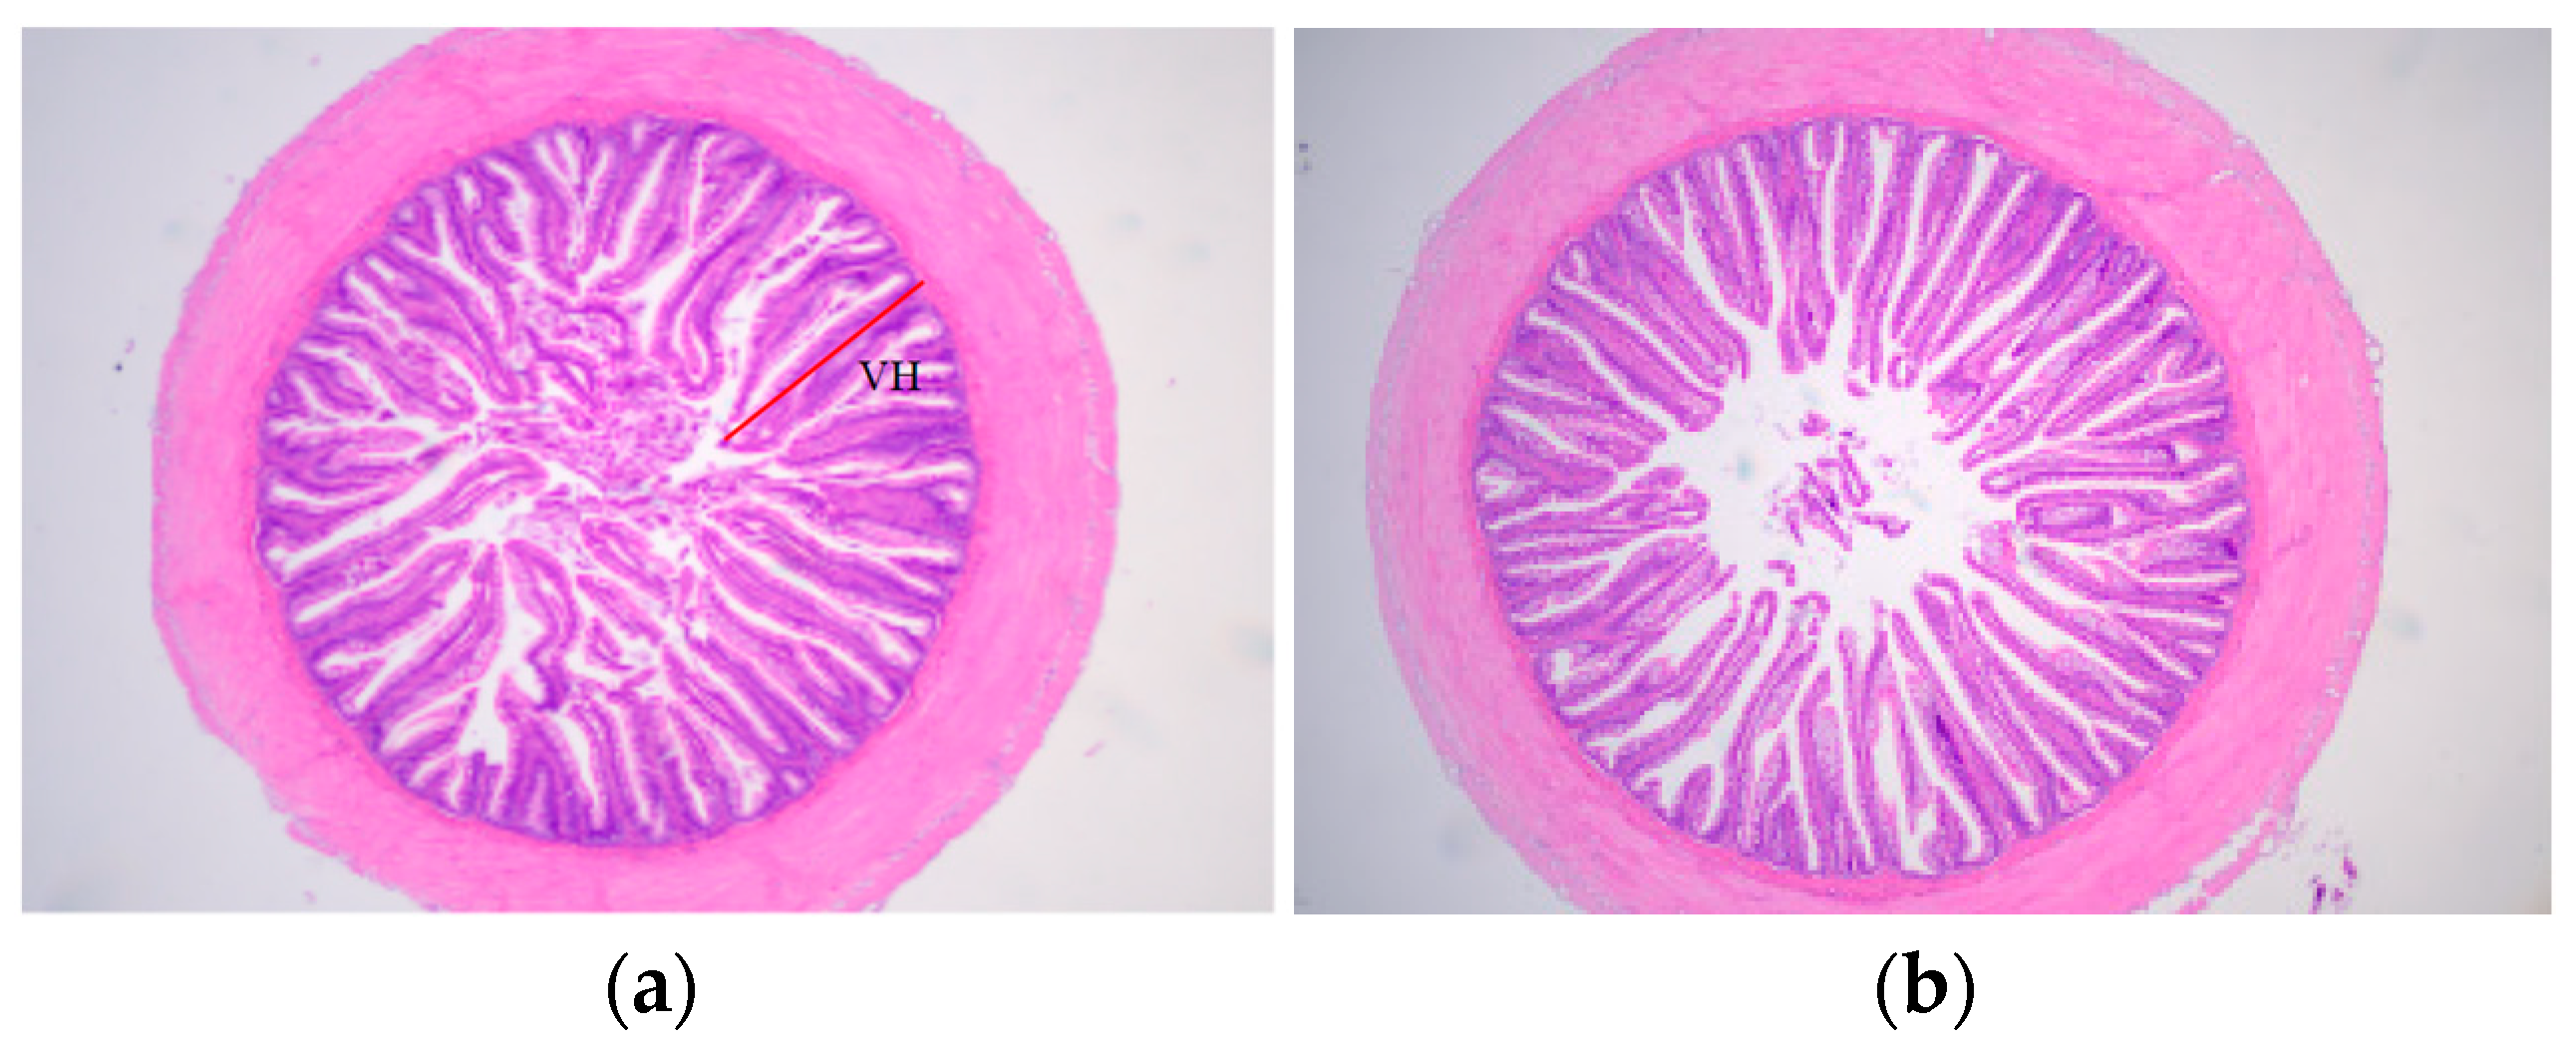
In fish species, the intestine is the primary site for digestion and absorption site [56]. The villi height and muscular layer thickness are indicators of the intestine’s capacity for absorption and digestion [57]. In the present study, the intestinal villi’s height was reduced, increasing the villi’s spacing in the high-carbohydrate group. This indicated that excessive carbohydrate levels changed the morphology of the gut and therefore reduced its capacity for digestion and absorption. The decrease in SR, WGR, and SGR in the HCD group correlated with the shortening of the intestinal villi, which decreases the contact area of food with the intestinal villi and weakens intestinal digestion. Similar results were also discovered in previous studies on M. amblycephala [58] and gilthead sea bream [
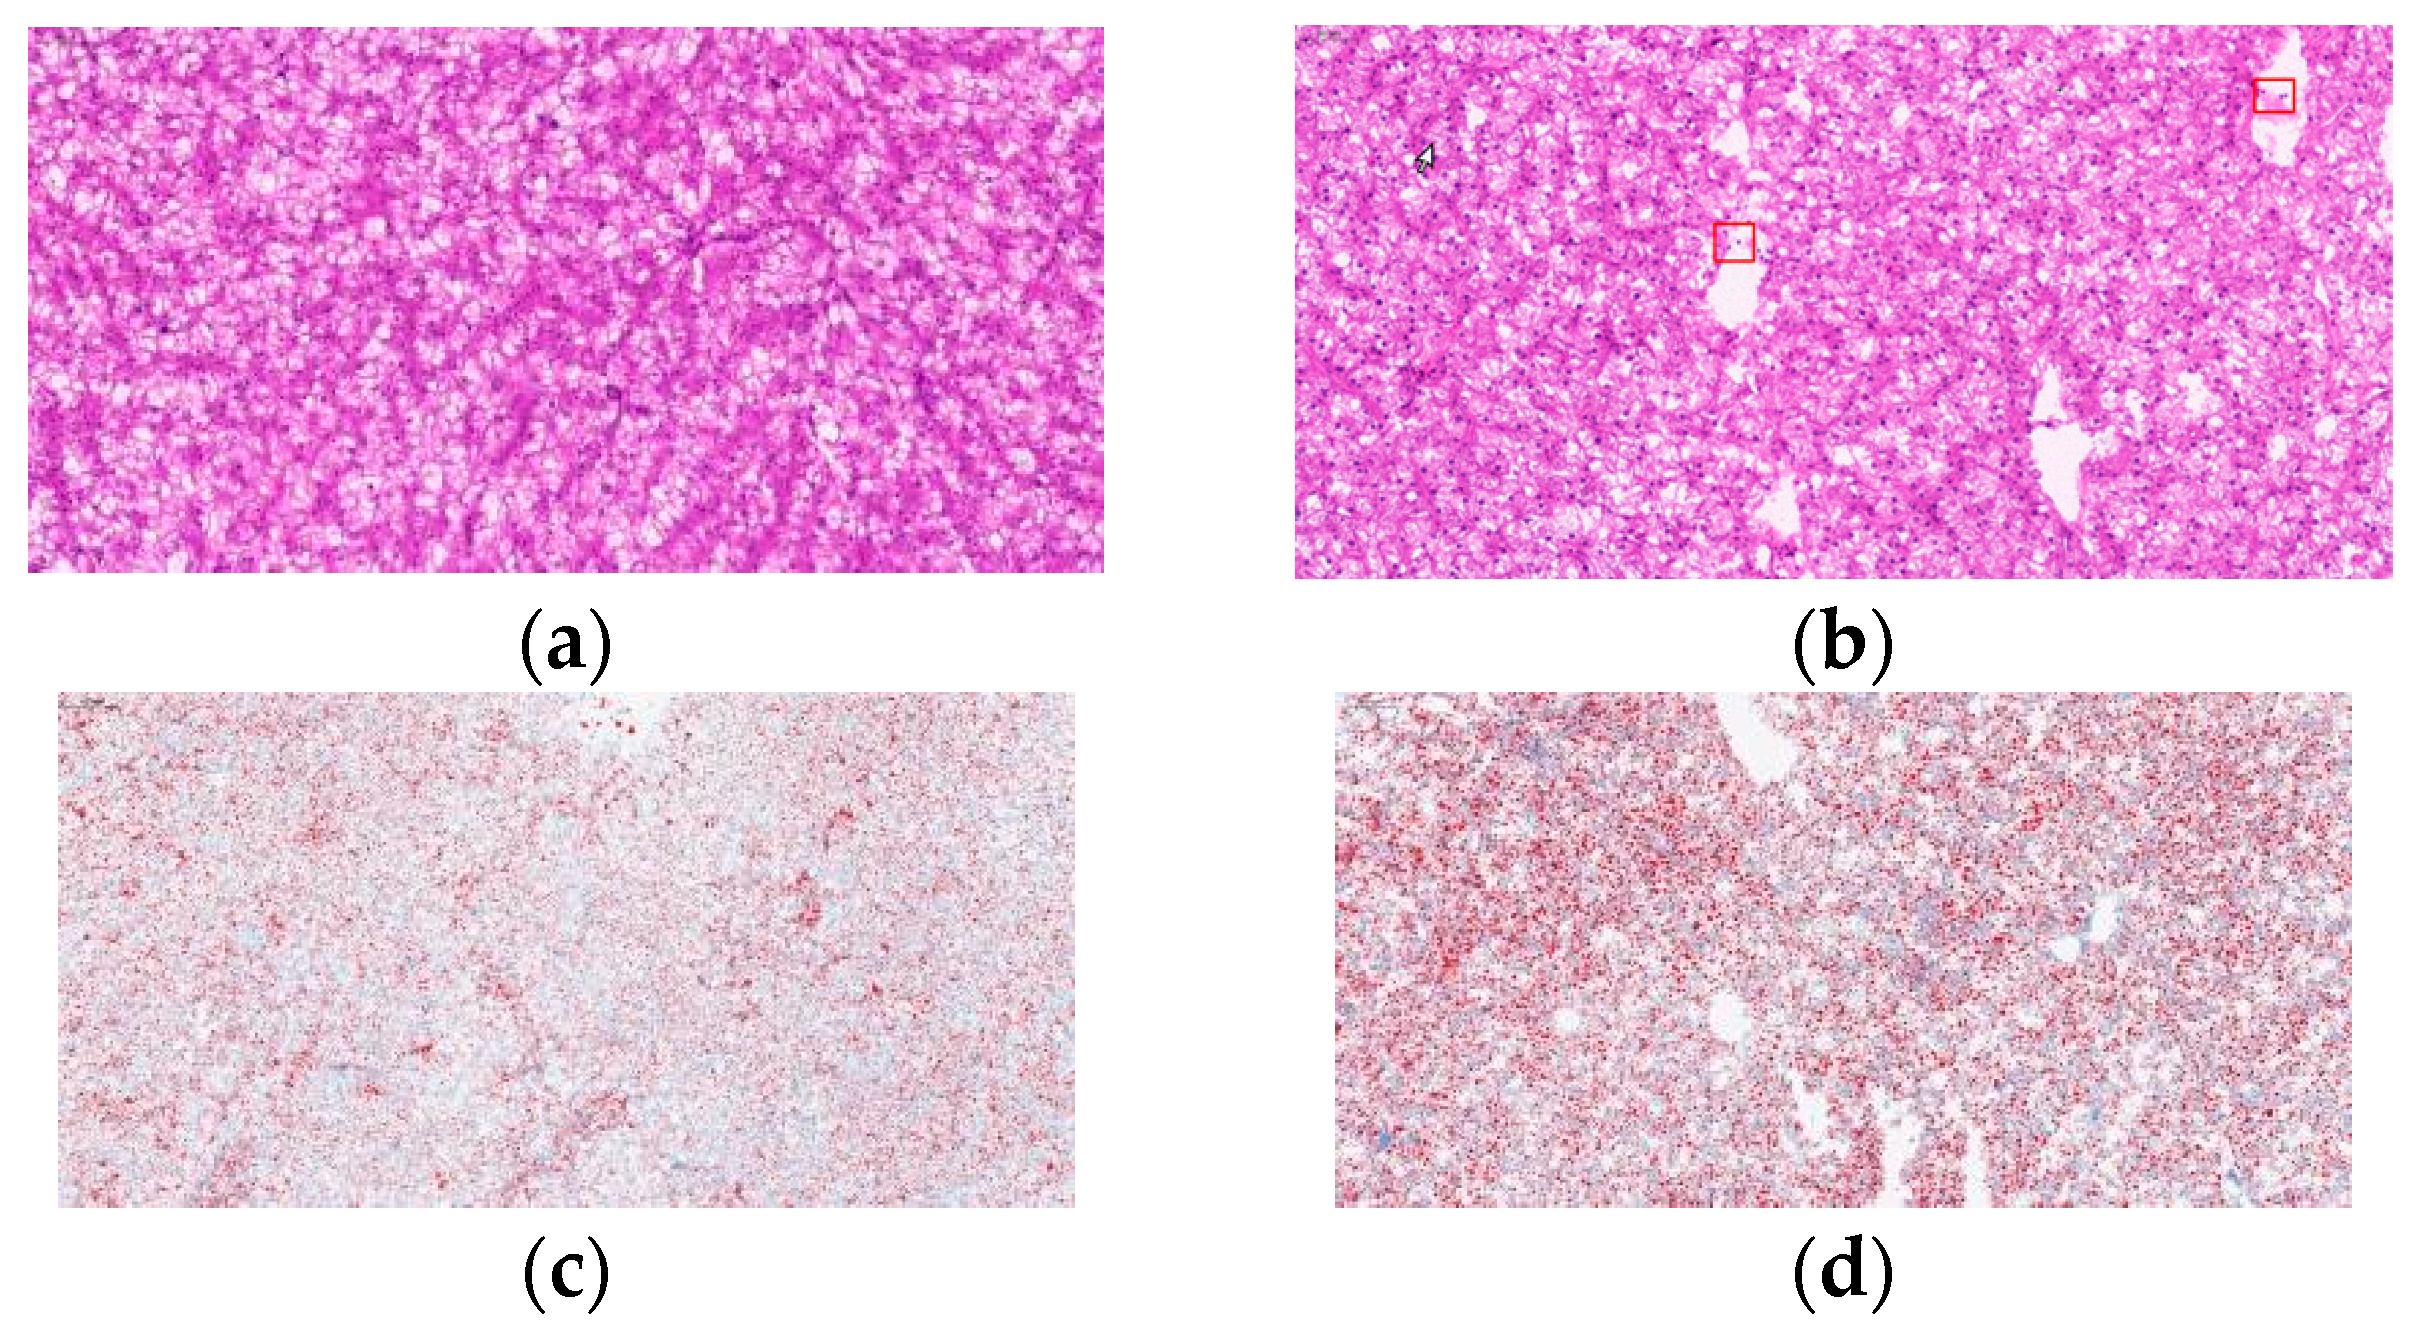
59]. The liver, a crucial organ for the metabolism of glucose in fish species, deposits glycogen and lipids when dietary carbohydrate intake is excessive [60]. According to previous studies, high dietary carbohydrate intake led to pathologic symptoms including lipid droplet vacuolation with displaced nuclei and cytoplasm loss [61,62,63]. Similar to the present study, the liver cells in the HCD group showed many vacuoles. In line with this, oil red O staining revealed a significant rise in lipid droplets in the HCD group. These findings suggested that liver injury in L. maculatus may occur from high carbohydrate-induced liver lipid accumulation.
In almost all types of organisms, the metabolic pathway and anaerobic energy source known as glycolysis has evolved [64]. 
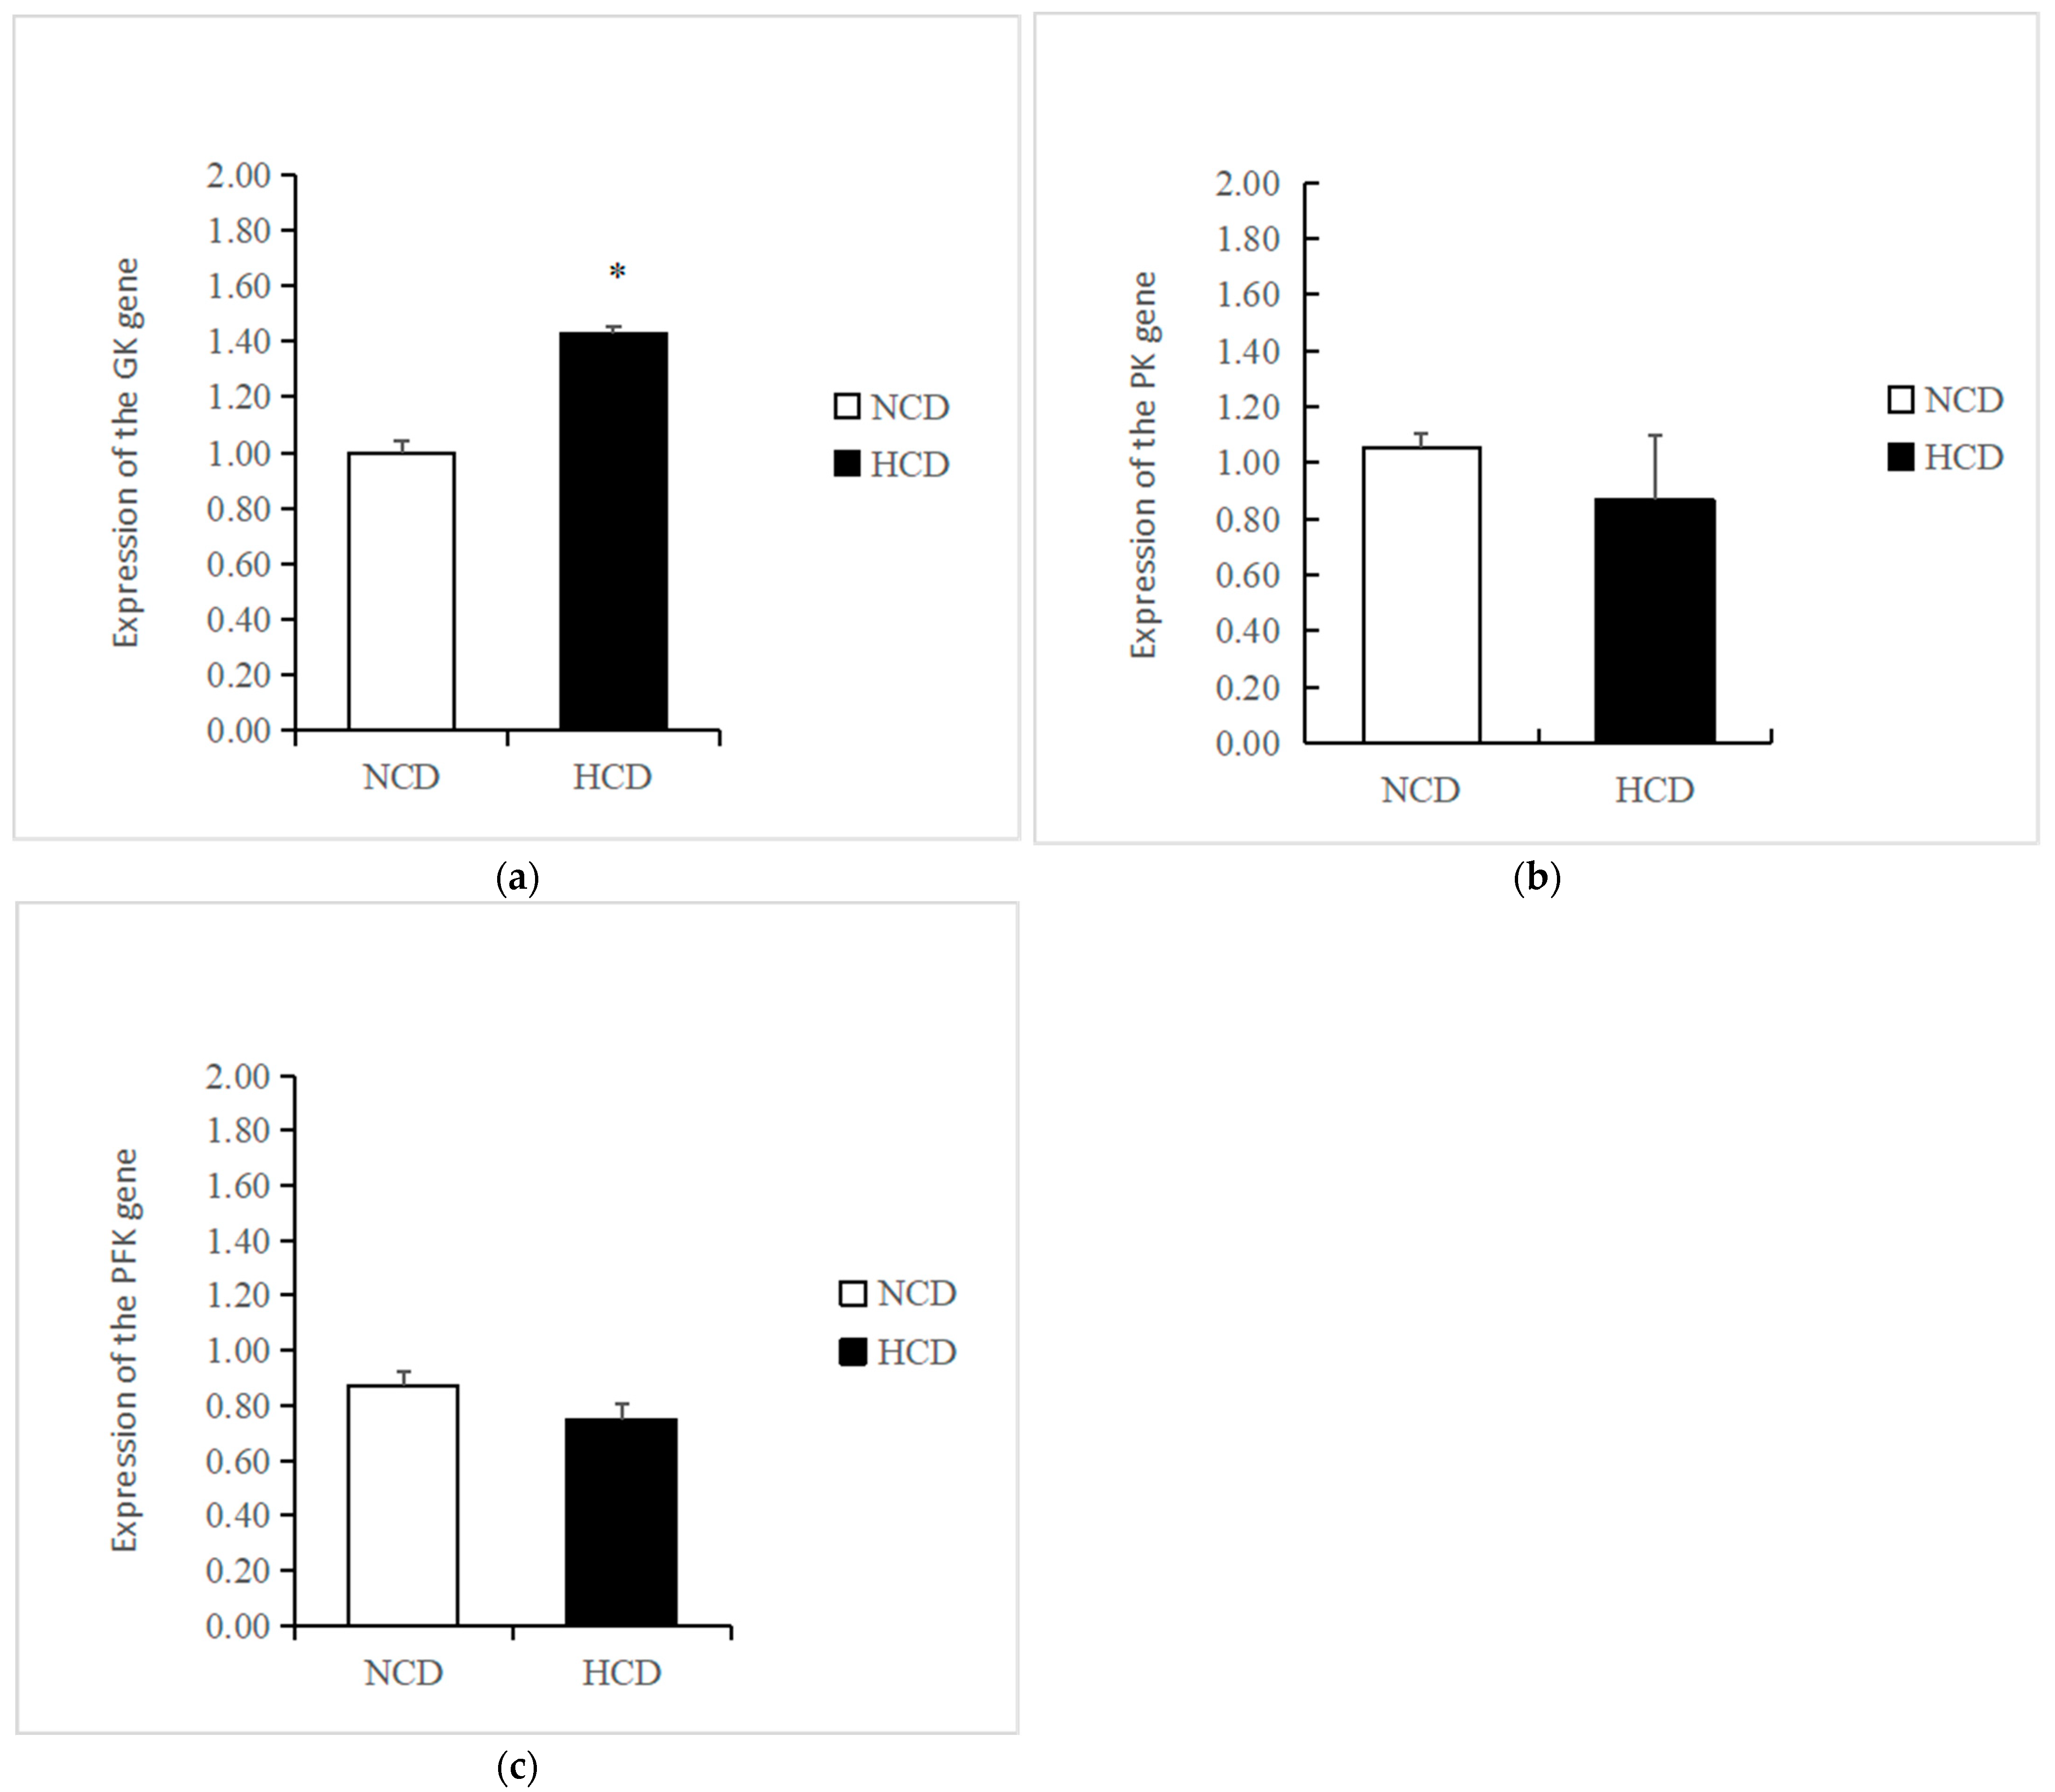
GK is a special type of hexokinase that, strictly speaking, operates on liver glucose as the initial and limiting step in the storage of excess glucose. It occurs in several species [7,9]. In the current study, the expression of GK genes was up-regulated by high carbohydrates. Similar to this, previous studies revealed that the expression of the GK gene is induced by carbohydrate levels and positively linked with the rise in carbohydrate levels in C. carpio, T. ovatus, and O. mykiss [52,65,66]. According to the results of the current study, high carbohydrate levels had no effect on the expression of PFK genes, which is in line with the previous findings of O. mykiss [67]. However, in Sparus aurata, PFK gene expression increased as carbohydrate levels rose [68].
The liver can replenish and restore glycogen by gluconeogenesis, which can keep plasma glucose steady [69]. 
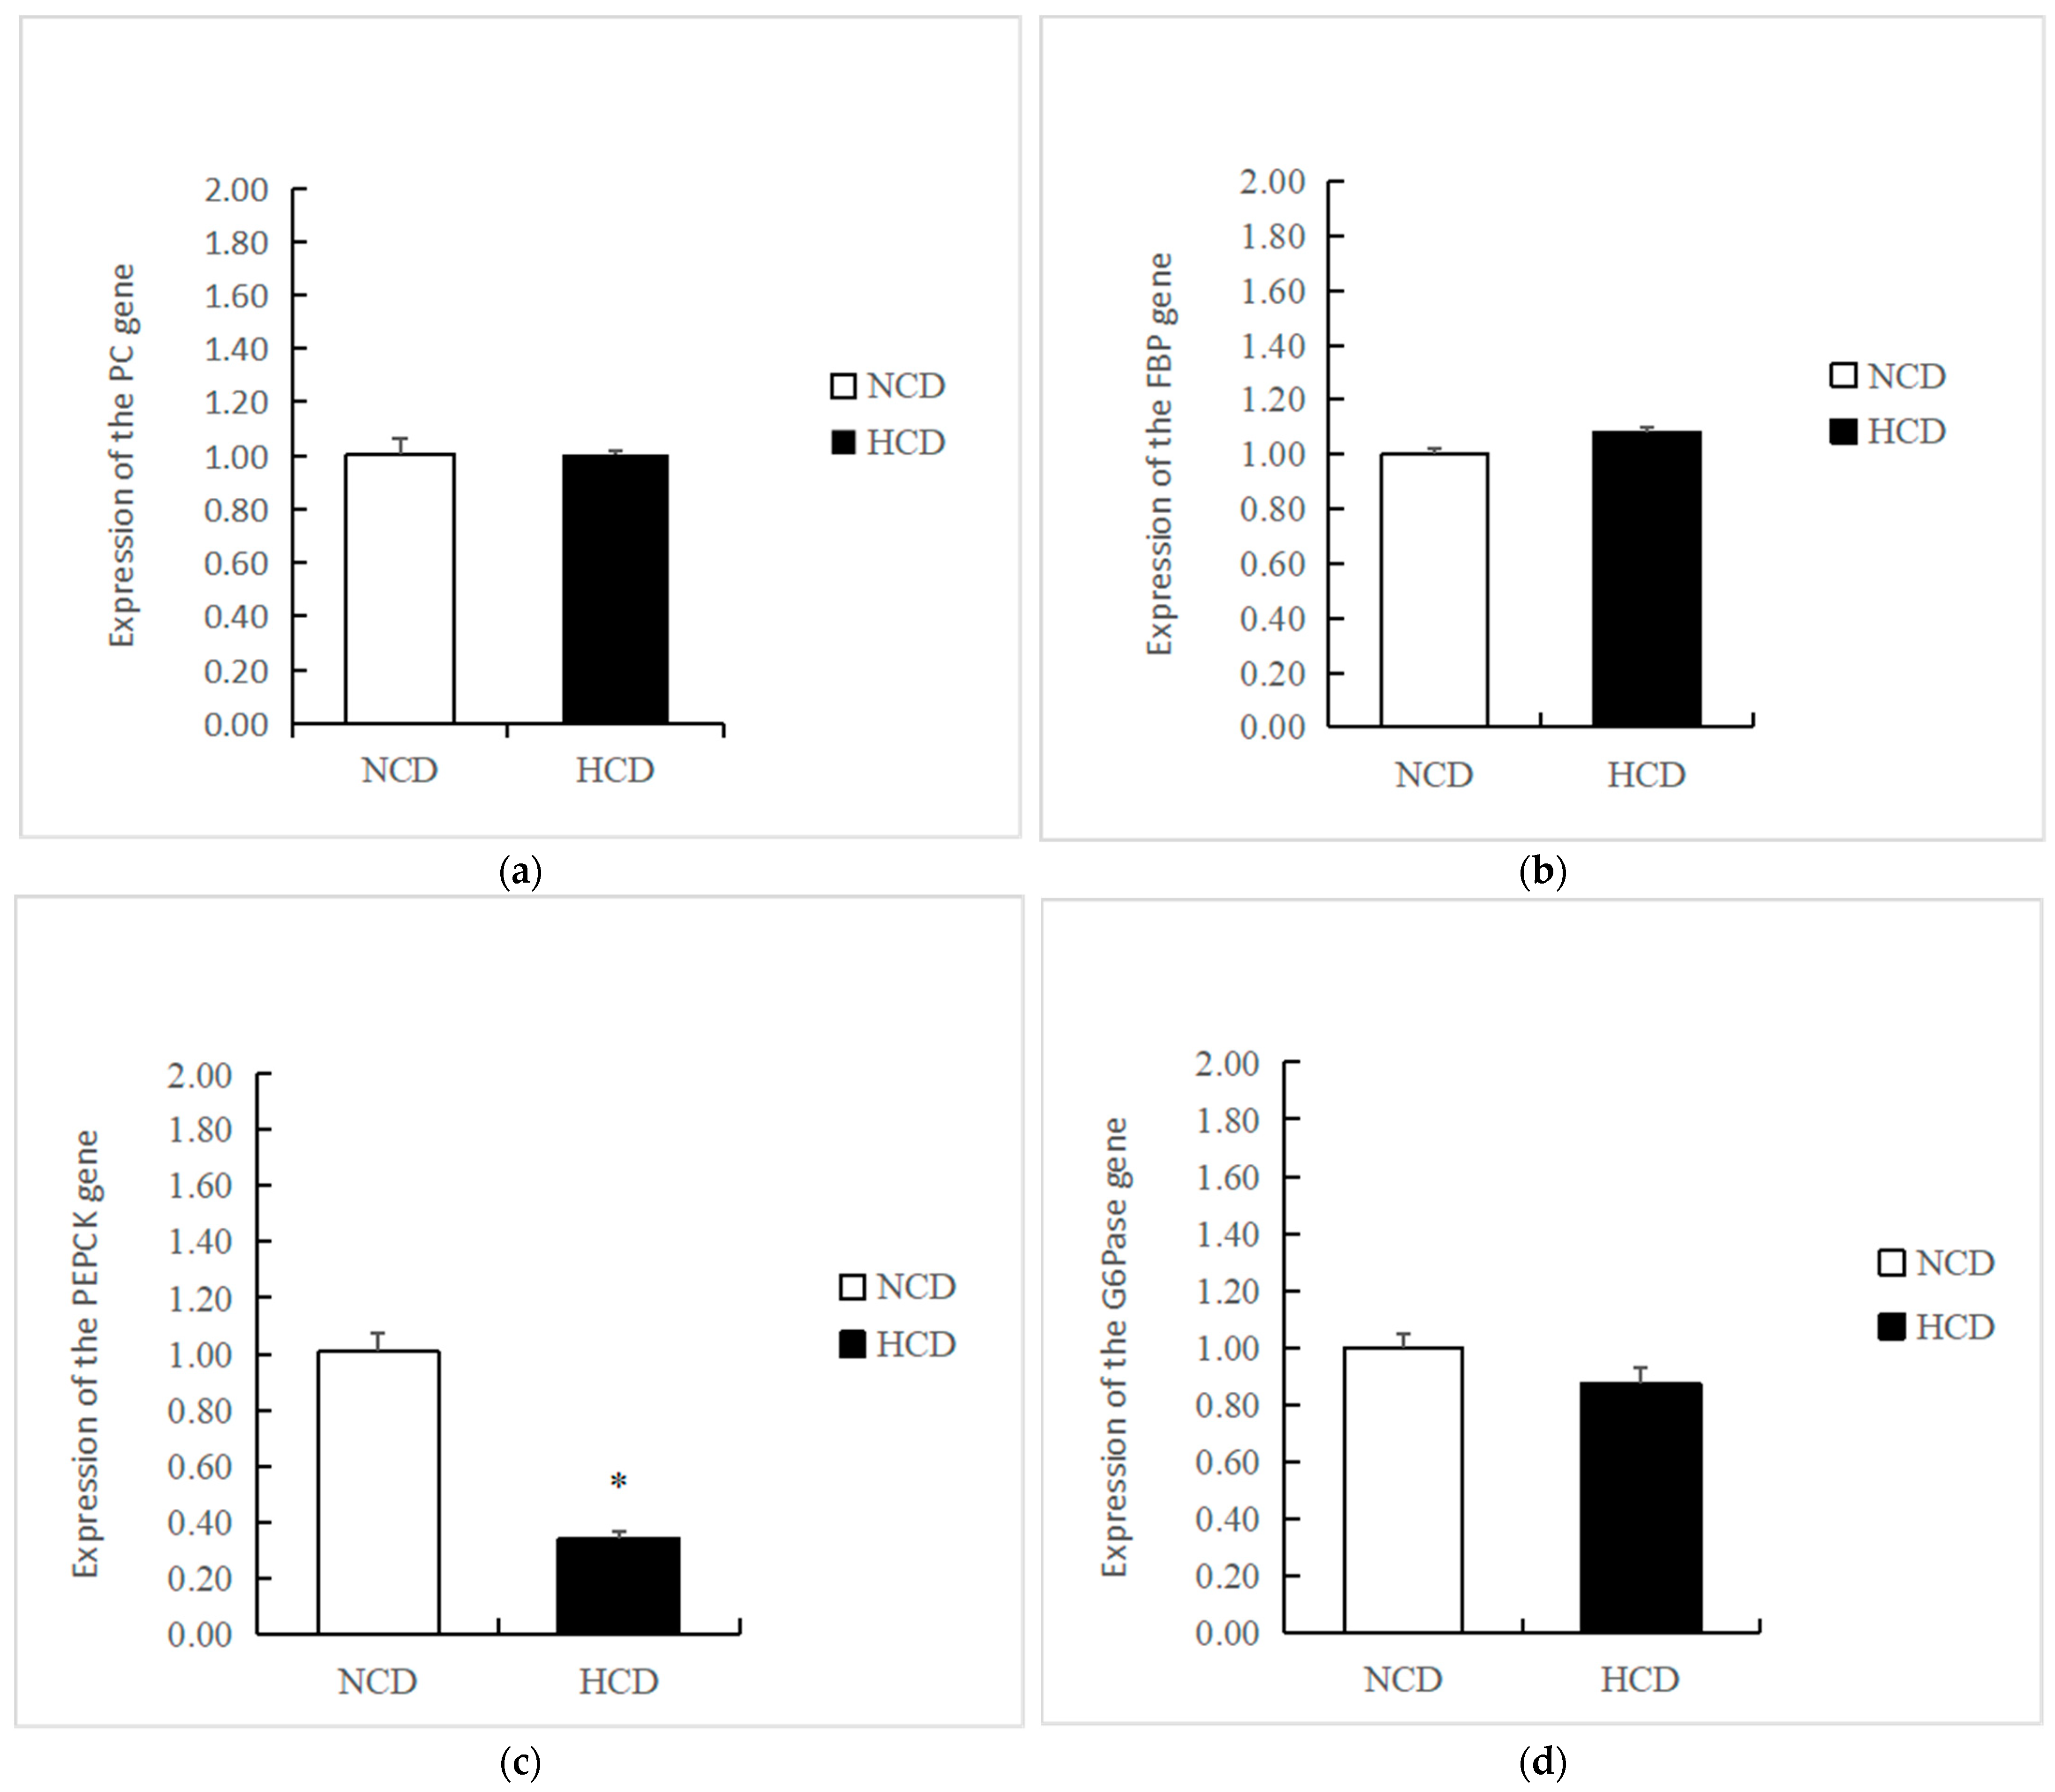
G6pase is mostly found in fish livers, where it is highly active but is inactive in the hearts and muscles of fish [70]. In previous studies, the expression of the G6pase gene was affected by high dietary carbohydrate intake in Erythroculter ilishaeformis [71]. High dietary carbohydrate intake did not, however, have an impact on the expression of the G6pase gene in the current study. Similarly, the earlier study found that feeding rainbow trout different starches had no impact on the expression of the G6pase gene in the liver [66]. The rate-limiting enzyme, FBP, is involved in the second step of the gluconeogenesis reaction. According to some earlier studies, dietary carbohydrates cannot regulate the activity or gene expression of PEPCK and FBP [56,72]. In the present study, high carbohydrate intake had no effect on FBP gene expression. Similarly, previous studies on O. mykiss and M. salmoides found that the FBP gene in the liver was unaffected by dietary carbohydrates [56,73]. In the current study, the expression of the PEPCK gene was significantly reduced in the HCD group, which is consistent with the results of Cyprinus carpio [
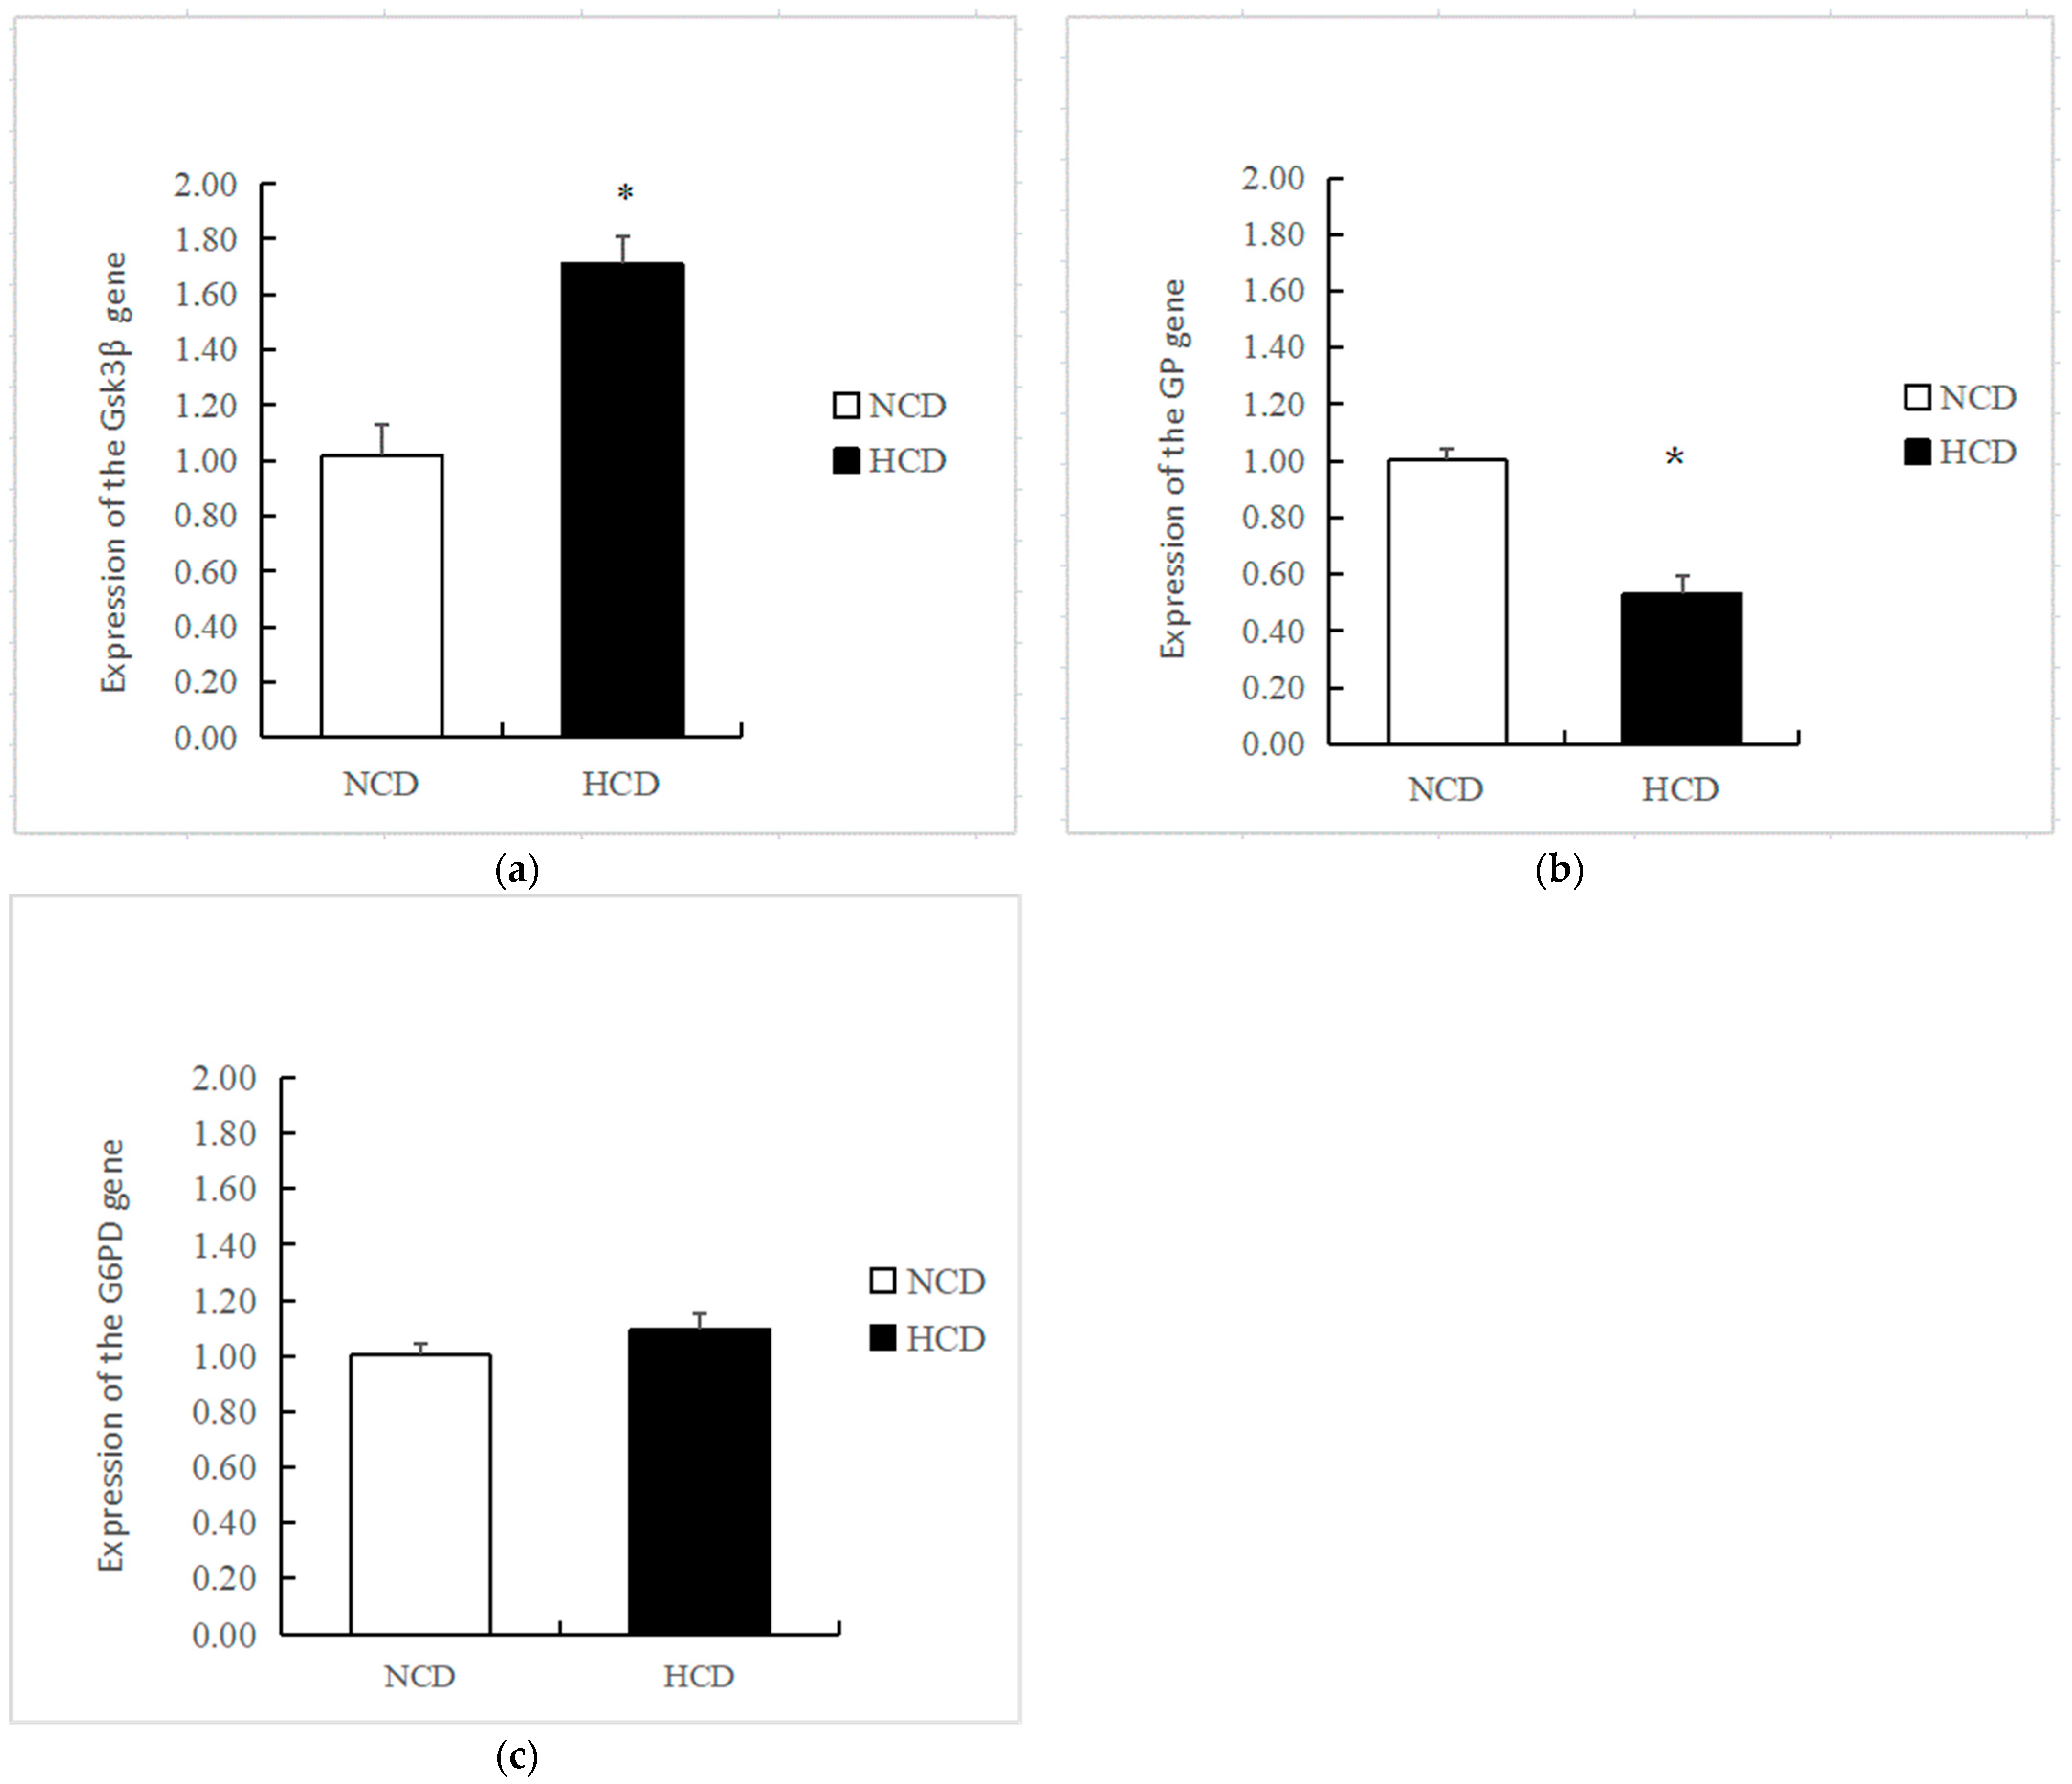
67]. GSK3-β is an essential gene in glycogen synthesis, and GP is a key gene for glycogenolysis [74]. Glucose is stored in liver cells as glycogen, which can be then broken down and converted to glucose and released into the blood [75]. In the present study, high-carbohydrate diets promoted hepatic glycogen synthesis and inhibited hepatic glycogenolysis in L. maculatus. Similar results were observed in recent work in Ctenopharyngodon idella, where gene expression related to glycogen synthesis was significantly increased in the high-carbohydrate group [9]. In prior work on Leiocassis longirostris, GP gene expression in the high-carbohydrate group was likewise significantly reduced [9].
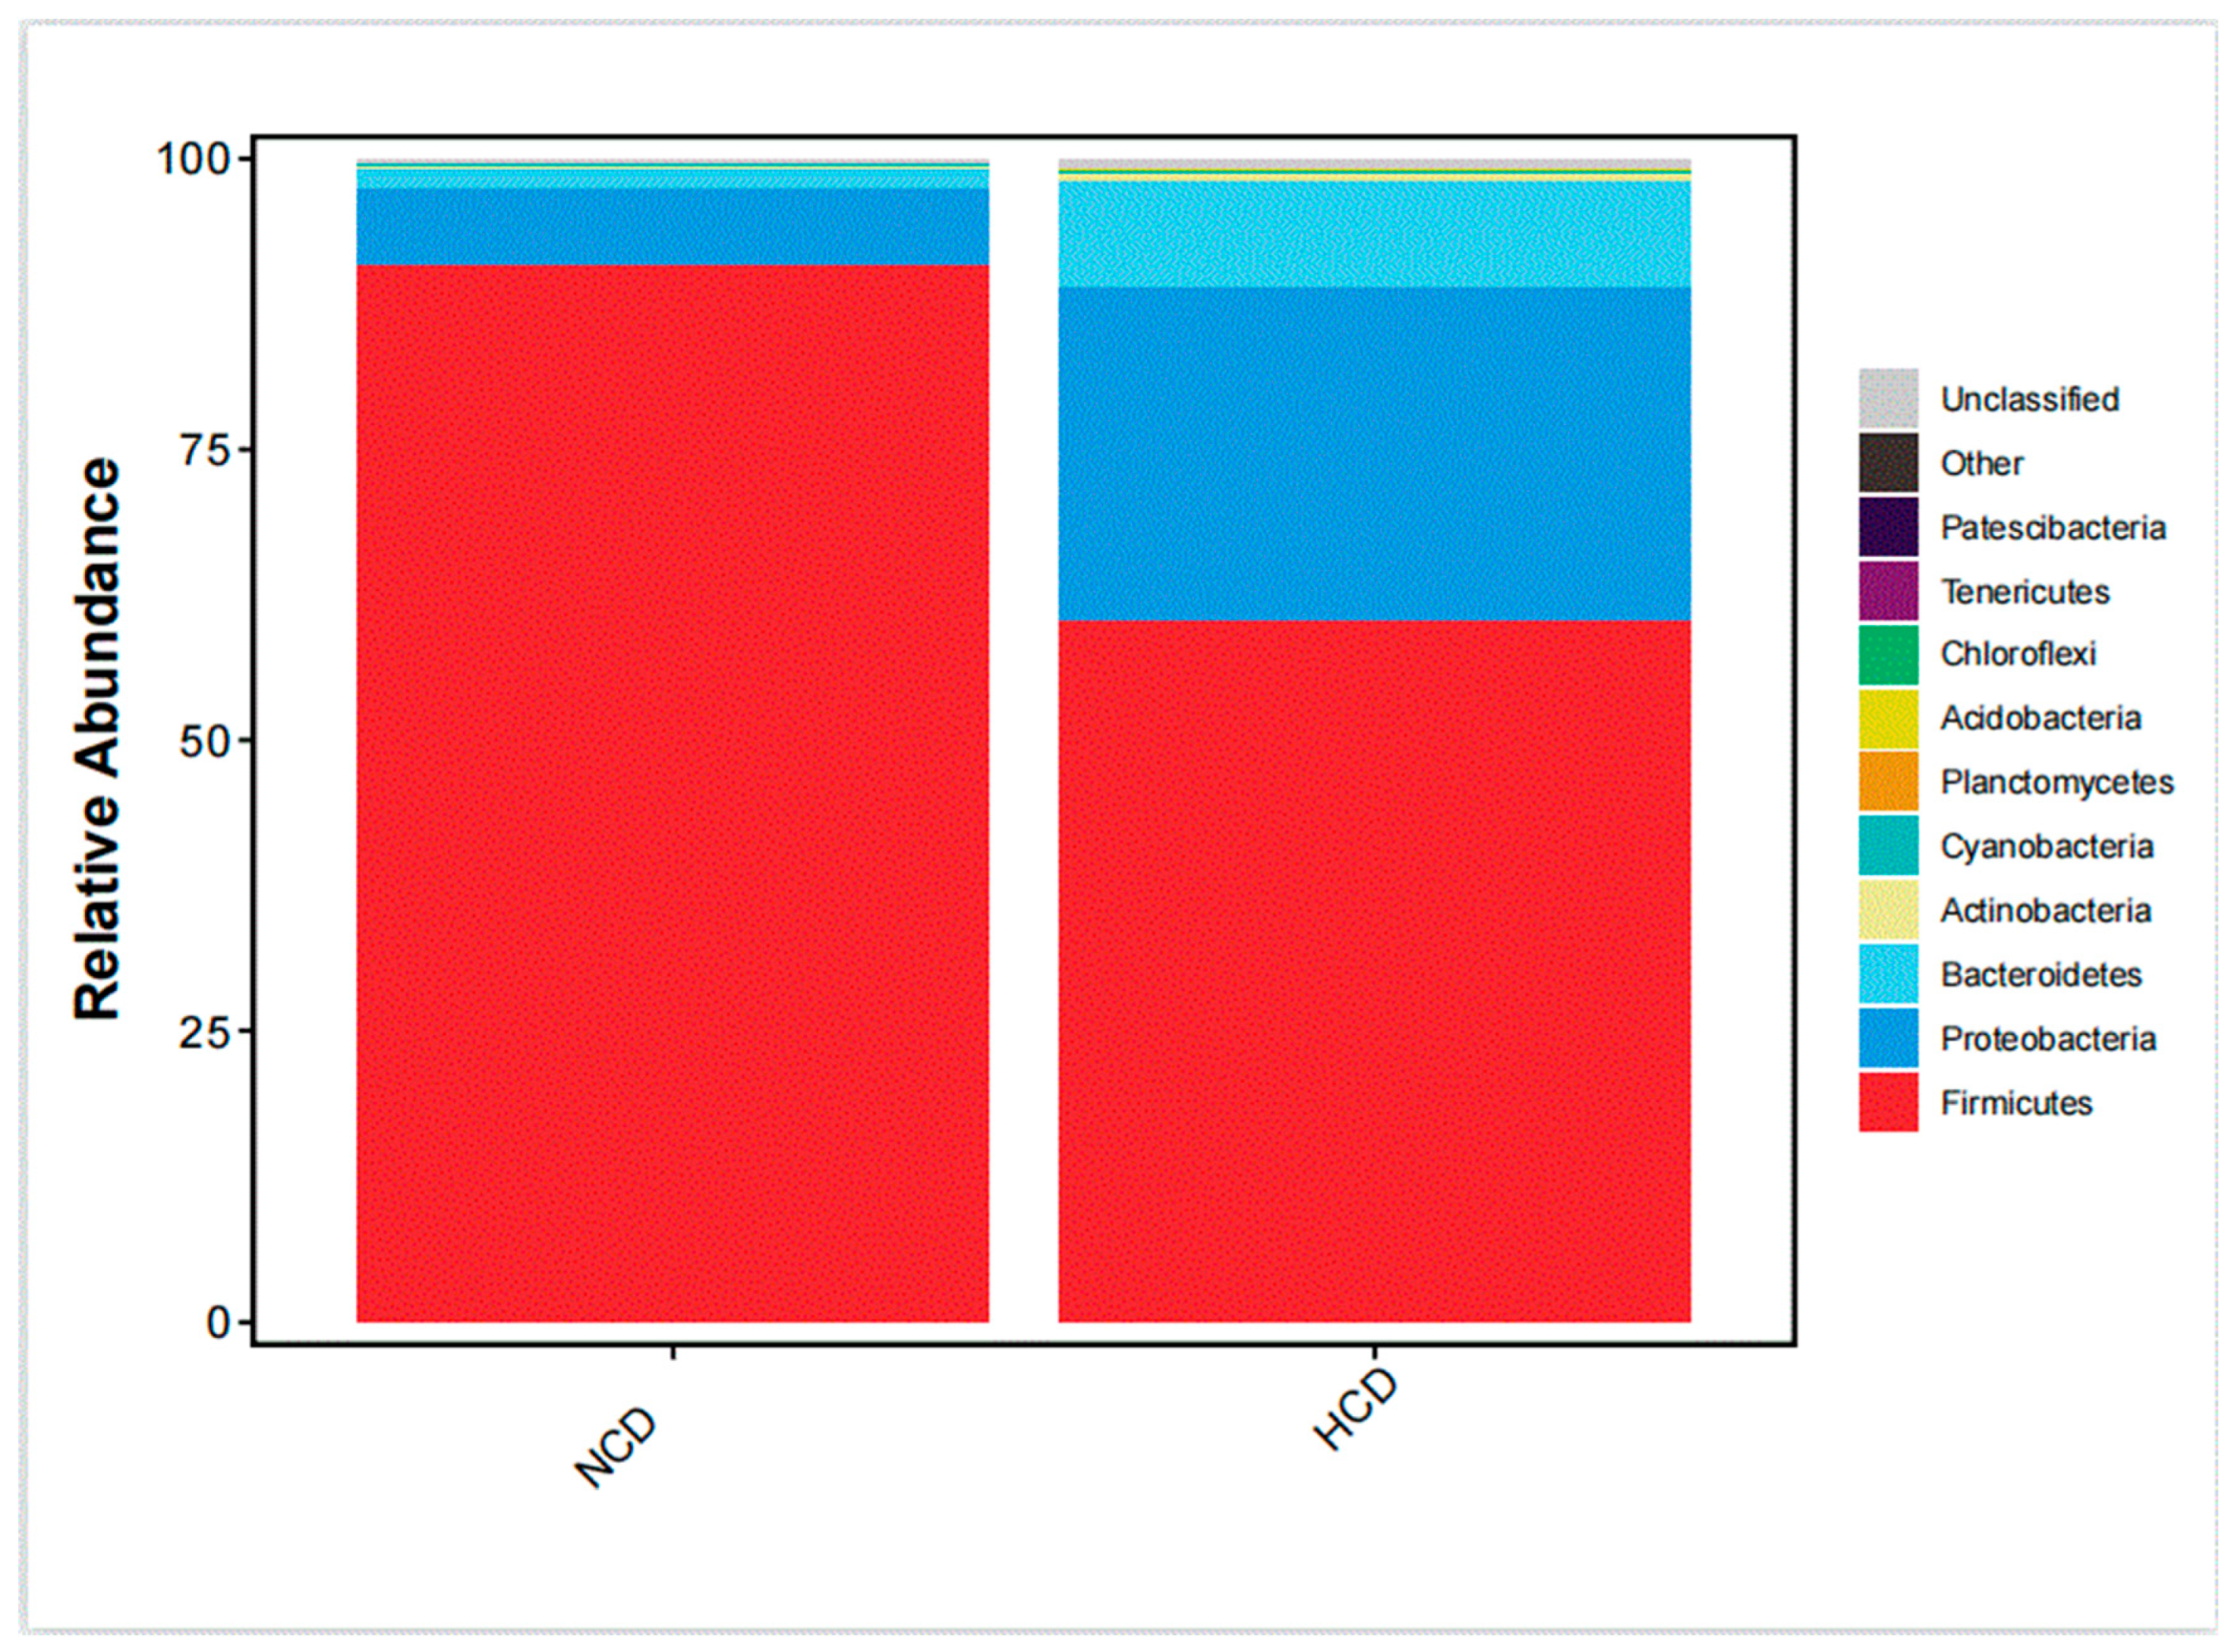
Animals’ digestive tracts contain intestinal microbiota that are stable and can regulate the metabolisms of glycolipids [76]. Numerous factors, including fish species, physiological status, feed, and aquatic habitat, have an impact on the intestinal microbiota of fish [
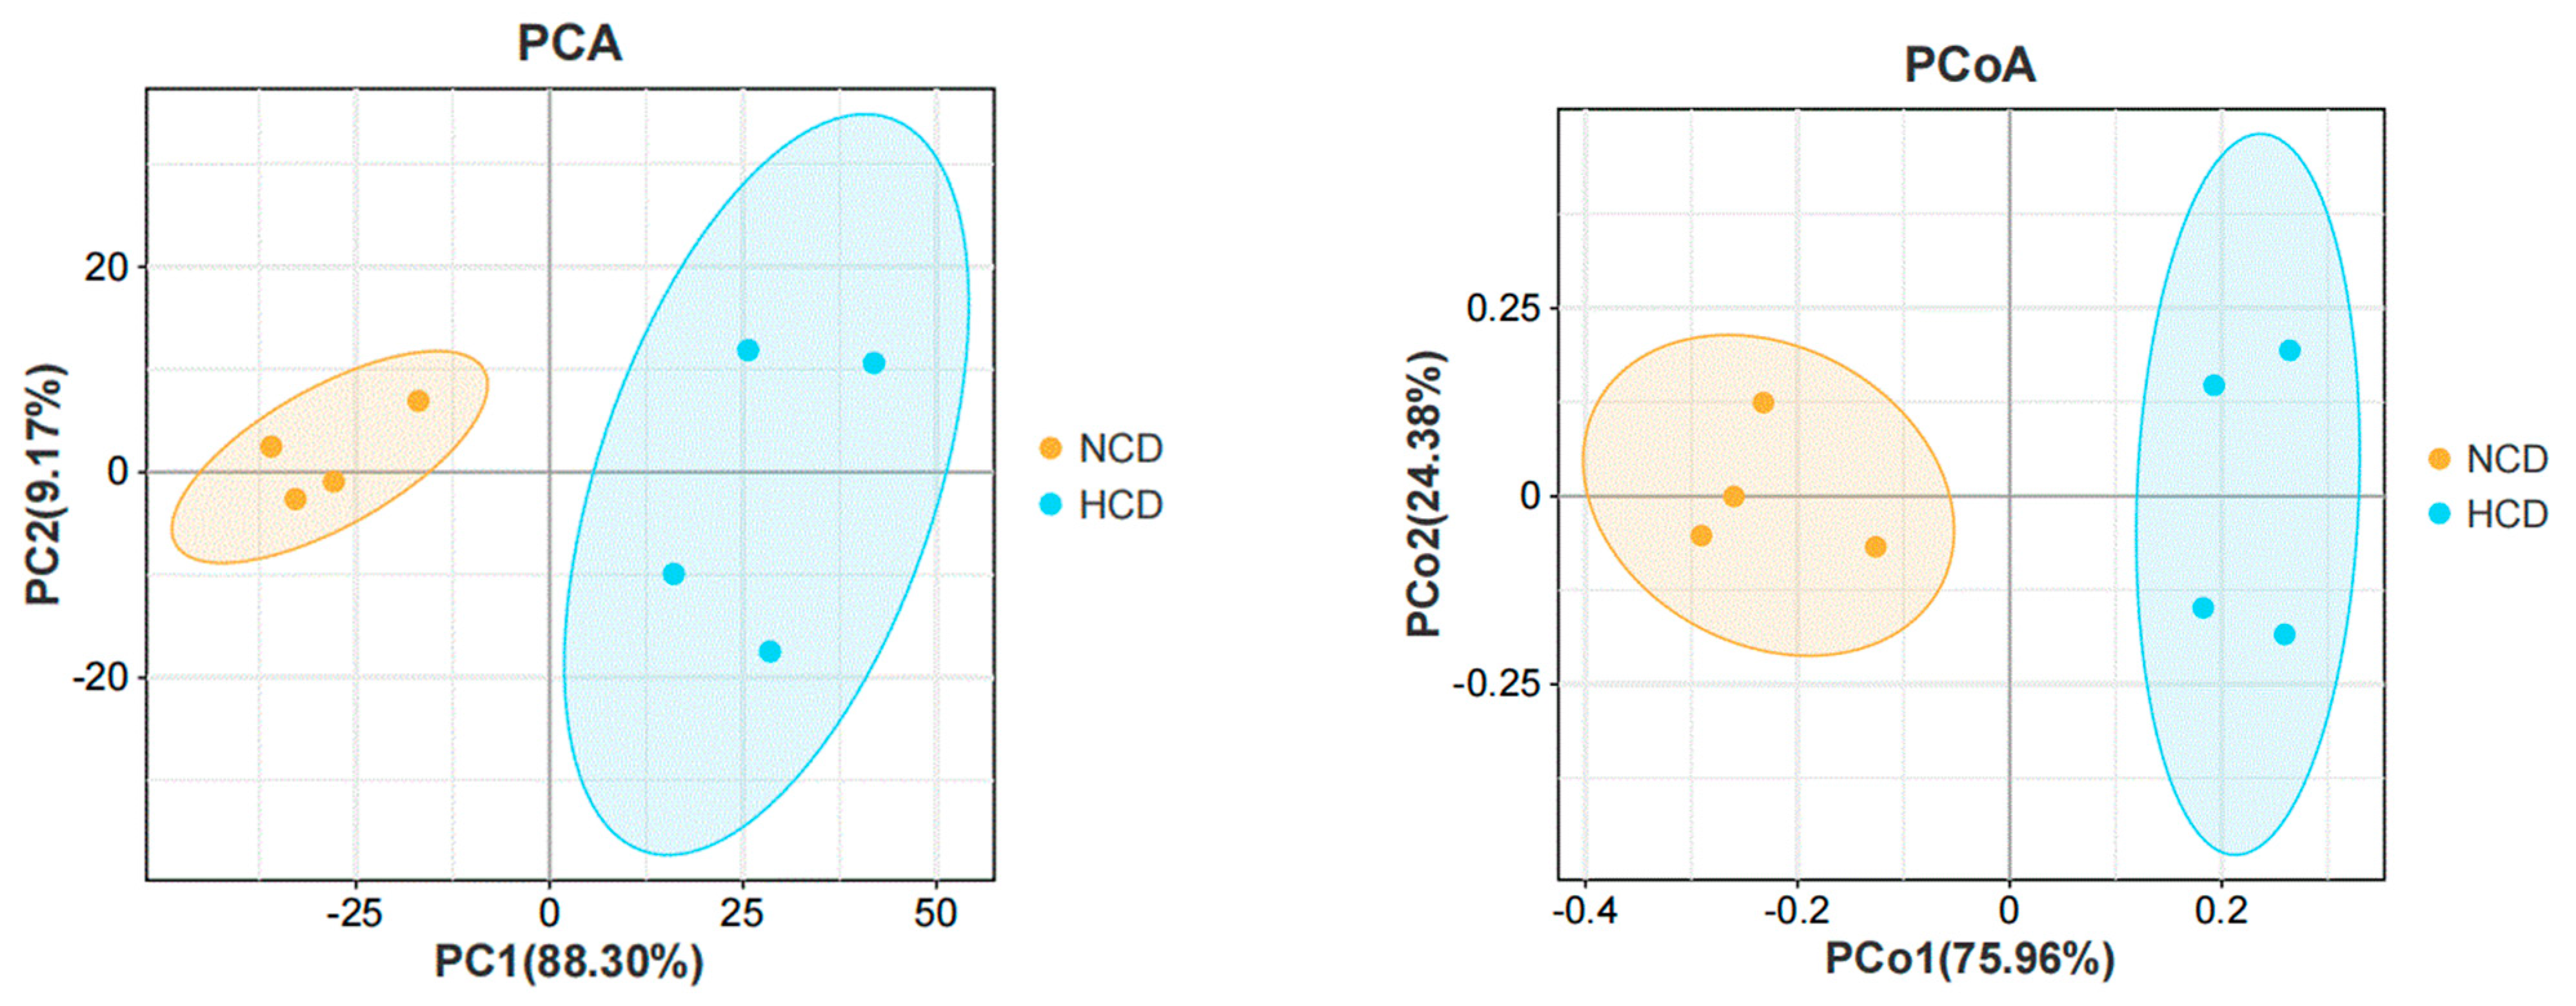
77]. In the present study, it was discovered that L. maculatus’s intestinal microbial composition was considerably changed by high carbohydrate levels. Similarly, changes in the intestinal microbiota of T. ovatus were caused by dietary starch levels [7]. In line with the findings of cobia [78], the number of phyla Bacteroides gradually rose as the level of carbohydrates increased in our study. Proteobacteria are common in water, soil, flora, and fauna and are members of the Gram-negative phylum. They are pathogens of the digestive system [79,80]. In the current study, Proteobacteria grew more in the HCD group. This suggests that L. maculatus’s susceptibility to diseases was heightened by its high-carbohydrate diet. Similarly, dietary carbohydrates dramatically increased the relative abundance of the Proteobacteria phylum in previous studies on the pearl gentian grouper and T. ovatus [7,
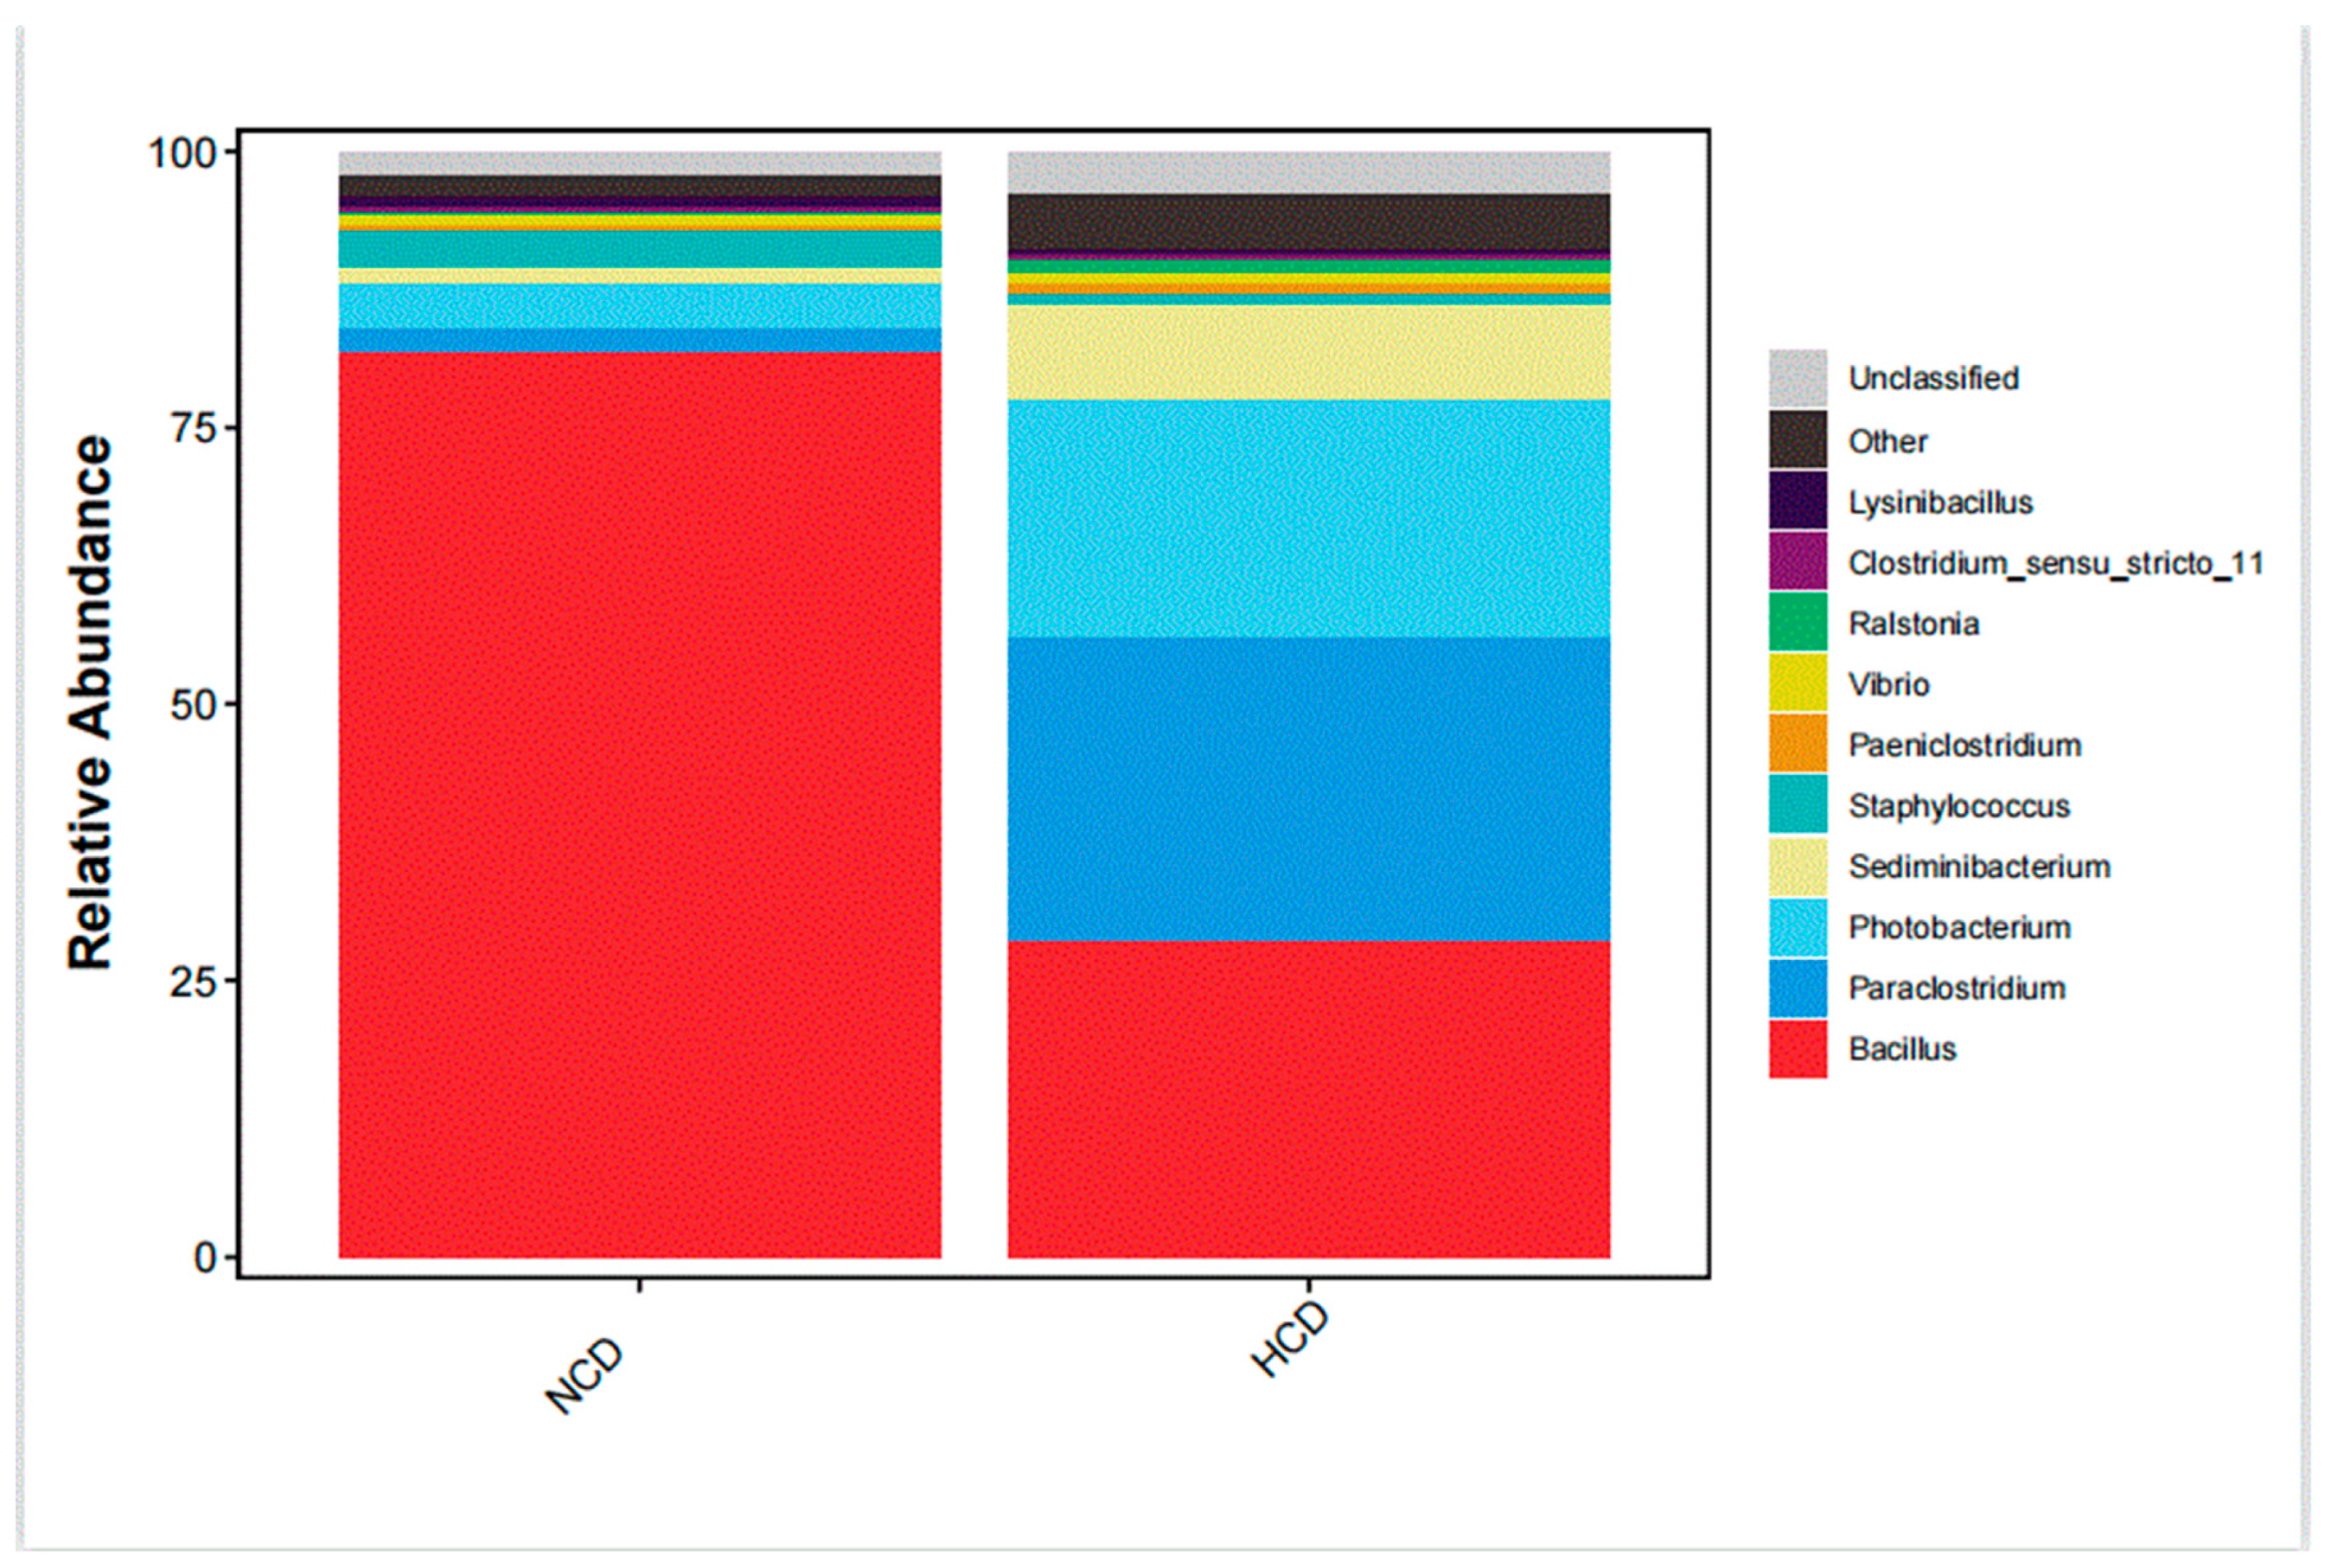
81]. Gram-negative bacteria, Photobacterium damselae, cause septicemic diseases in aquaculture, including sea bass (Dicentrarchus labrax) and sea bream (Sparus aurata) [10]. In the current study, Photobacterium levels rose in the HCD group, indicating that L. maculatus is more prone to developing photomycosis when subjected to high dietary carbohydrates.

5. Conclusions

From the results of this experiment on the L. maculatus, high carbohydrates led to increased condition factor and liver glycogen, lipid deposition, decreased antioxidant capacity of the liver, increased relative abundance of harmful intestinal microbes, and disrupted glucose metabolism.

Author Contributions

Conceptualization, L.Z. and C.Z. (Chuanpeng Zhou); methodology, L.Z., C.Z. (Chuanpeng Zhou) and L.Q.; validation, C.Z. (Chuanpeng Zhou) and B.Z.; investigation, Z.W., B.Z., L.Y., P.W., C.Z. (Chao Zhao) and H.L.; formal analysis, L.Z. and C.Z. (Chuanpeng Zhou); data curation, L.Z.; writing—original draft preparation, L.Z.; writing—review and editing, L.Z. and C.Z. (Chuanpeng Zhou); supervision and project administration, C.Z. (Chuanpeng Zhou) and L.Q.; funding acquisition, C.Z. (Chuanpeng Zhou) and L.Q. All authors have read and agreed to the published version of the manuscript.

Funding

This work was supported by the Central Public-interest Scientific Institution Basal Research Fund, South China Sea Fisheries Research Institute, CAFS (2021XK02); the Central Public-interest Scientific Institution Basal Research Fund, CAFS (2022XT0404; 2020TD55); the Key Areas of Guangdong Province Research and Development projects (NO. 2021B0202020002); the Central Public-interest Scientific Institution Basal Research Fund of CAFS (NO. 2020TD21); and Guangzhou municipal Science and Technology (NO. 2023B03J1304).

Institutional Review Board Statement

The experimental design was approved by the Ethics Committee of the South China Sea Fisheries Institute (Approval Code: 20210201; Approval Date: 9 February 2021).

Informed Consent Statement

Not applicable.

Data Availability Statement

The data are available upon request.

Conflicts of Interest

The authors declare no conflict of interest.

References

  1. Hemre, G.I.; Mommsen, T.P.; Krogdahl, A. Carbohydrates in fish nutrition: Effects on growth, glucose metabolism and hepatic enzymes. Aquac. Nutr. 2015, 8, 175–194. [Google Scholar] [CrossRef]
  2. Kamalam, B.S.; Medale, F.; Panserat, S. Utilisation of dietary carbohydrates in farmed fishes: New insights on influencing factors, biological limitations and future strategies—ScienceDirect. Aquaculture 2017, 467, 3–27. [Google Scholar] [CrossRef]
  3. Adjoumani, J.J.Y.; Abasubong, K.P. A time-course study of the effects of a high-carbohydrate diet on the growth performance, glycolipid metabolism and mitochondrial biogenesis and function of blunt snout bream (Megalobrama amblycephala). Aquaculture 2022, 552, 738011. [Google Scholar] [CrossRef]
  4. Emdin Stefan, O. Effects of hagfish insulin in the Atlantic hagfish, Myxine glutinosa the in vivo metabolism of [14C] glucose and [14C] leucine and studies on starvation and glucose-loading. Gen. Comp. Endocrinol. 1982, 47, 414–425. [Google Scholar] [CrossRef]
  5. Plisetskaya, E.M.; Duan, C. Insulin and insulin-like growth factor I in coho salmon Oncorhynchus kisutch injected with streptozotocin. Am. J. Physiol. 1994, 267 Pt 2, R1408–R1412. [Google Scholar] [CrossRef]
  6. Yang, L.; Qin, C.-B.; Zheng, W.J.; Lu, R.H.; Nie, G.H. Research progress on glucose perception and regulation of glucose metabolism in fish. J. Aquac. 2014, 38, 1639–1649. [Google Scholar]
  7. Zhao, W.; Xie, J.J.; Fang, H.H.; Liu, Y.J.; Niu, J. Effects of corn starch level on growth performance, antioxidant capacity, gut morphology and intestinal microflota of juvenile golden pompano, Trachinotus ovatus. Aquaculture 2020, 524, 735197. [Google Scholar] [CrossRef]
  8. Shen, J.; Liu, H.; Tan, B.; Dong, X.; Yang, Q.; Chi, S.; Zhang, S. Effects of replacement of fishmeal with cottonseed protein concentrate on the growth, intestinal microflota, haematological and antioxidant indices of juvenile golden pompano (Trachinotus ovatus). Aquac. Nutr. 2020, 26, 1119–1130. [Google Scholar] [CrossRef]
  9. Su, J.; Mei, L.; Xi, L.; Gong, Y.; Yang, Y.; Jin, J.; Liu, H.; Zhu, X.; Xie, S.; Han, D. Responses of glycolysis, glycogen accumulation and glucose-induced lipogenesis in grass carp and Chinese long snout catfish fed high-carbohydrate diet. Aquaculture 2021, 533, 736146. [Google Scholar] [CrossRef]
  10. Munro, P.O.; Barbour, A.; Blrkbeck, T.H. Comparison of the gut bacterial flora of start-feeding larval turbot reared under different conditions. J. Appl. Microbiol. 2010, 77, 560–566. [Google Scholar] [CrossRef]
  11. Zhou, Y.L.; He, G.L.; Jin, T.; Chen, Y.J.; Lin, S.M. High dietary starch impairs intestinal health and microbiota of largemouth bass, Micropterus salmoides. Aquaculture 2020, 534, 736261. [Google Scholar] [CrossRef]
  12. Liu, J. Differential population structuring and demographic history of two closely related fish species, Japanese sea bass (Lateolabrax japonicus) and spotted sea bass (Lateolabrax maculatus) in Northwestern Pacific. Mol. Phylogenet. Evol. 2006, 39, 799–811. [Google Scholar] [CrossRef] [PubMed]
  13. Shao, C.; Li, C.; Wang, N.; Qin, Y.; Xu, W.; Liu, Q.; Zhou, Q.; Zhao, Y.; Li, X.; Liu, S.; et al. Chromosome-level genome assembly of the spotted sea bass, Lateolabrax maculatus. GigaScience 2018, 7, giy114. [Google Scholar] [CrossRef] [PubMed]
  14. 2022 China Fisheries Statistical Yearbook of Mariculture Production by Region (by Species). 2022. Available online: https://www.yearbookchina.com/navipage-n3022101301000125.html (accessed on 21 June 2023).
  15. Zhou, J.B.; Zhou, Q.C.; Chi, S.Y.; Yang, Q.H.; Liu, C.W. Optimal dietary protein requirement for juvenile ivory shell, Babylonia areolata. Aquaculture 2007, 270, 186–192. [Google Scholar] [CrossRef]
  16. Zhou, C.P.; Ge, X.P.; Liu, B.; Xie, J.; Miao, L.H. Effect of high dietary carbohydrate on the growth performance and physiological responses of juvenile Wuchang bream, Megalobrama amblycephala. Asian-Australas. J. Anim. Sci. 2013, 26, 1598–1608. [Google Scholar] [CrossRef]
  17. Asadi, F.; Hallajian, A.; Asadian, P.; Shahriari, A.; Pourkabir, M. Serum lipid, free fatty acid, and proteins in juvenile sturgeons: Acipenser persicus and acipenser stellatus. Comp. Clin. Pathol. 2009, 18, 287–289. [Google Scholar] [CrossRef]
  18. Gutierrez, J.; Carrillo, M.; Zanuy, S.; Planas, J. Daily rhythms of insulin and glucose levels in the plasma of sea bass Dicentrarchus labrax after experimental feeding. Gen. Comp. Endocrinol. 1984, 55, 393–397. [Google Scholar] [CrossRef]
  19. Zang, L.; Shimada, Y.; Tanaka, T.; Nishimura, N. Rhamnan sulphate from monostroma nitidum attenuates hepatic steatosis by suppressing lipogenesis in a diet-induced obesity zebrafish model. J. Funct. Foods 2015, 17, 364–370. [Google Scholar] [CrossRef]
  20. Pan, Y.X.; Luo, Z.; Zhuo, M.Q.; Wei, C.C.; Chen, G.H.; Song, Y.F. Oxidative stress and mitochondrial dysfunction mediated cd-induced hepatic lipid accumulation in zebrafish danio rerio. Aquat. Toxicol. 2018, 199, 12–20. [Google Scholar] [CrossRef]
  21. Fernandez, F.; Miquel, A.G. Effects of diets with distinct protein-to-carbohydrate ratios on nutrient digestibility, growth performance, body composition and liver intermediary enzyme activities in gilthead sea bream (Sparus aurata) fingerlings. J. Exp. Mar. Biol. Ecol. 2007, 343, 1–10. [Google Scholar] [CrossRef]
  22. Dixon, D.G.; Hilton, J.W. Influence of available dietary carbohydrate content on tolerance of waterborne copper by rainbow trout, Salmo gairdneri Richardson*. J. Fish Biol. 1981, 19, 509–518. [Google Scholar] [CrossRef]
  23. Xu, T.; Liu, X.; Huang, W.; Li, G.; Zhang, Y.; Xu, D.; Wang, G. Effects of dietary carbohydrate levels on growth, metabolic enzyme activities and oxidative status of hybrid snakehead (Channa maculata ♀ × Channa argus ♂). Aquaculture 2022, 563, 738960. [Google Scholar] [CrossRef]
  24. Du, Z.Y.; Turchini, G.M. Are we actually measuring growth? —An appeal to use a more comprehensive growth index system for advancing aquaculture research. Rev. Aquac. 2022, 14, 525–527. [Google Scholar] [CrossRef]
  25. Amoah, A.; Coyle, S.D.; Webster, C.D.; Durborow, R.M.; Bright, L.A.; Tidwell, J.H. Effects of Graded Levels of Carbohydrate on Growthand Survival of Largemouth Bass, Micropterus Salmoides. J. World Aquac. Soc. 2008, 39, 397–405. [Google Scholar] [CrossRef]
  26. Wilson, R.P.; Poe, W.E. Apparent inability of channel catfish to utilize dietary mono and disaccharides as energy sources. J. Nutr. 1987, 117, 280–285. [Google Scholar] [CrossRef]
  27. Polakof, S.; Panserat, S. Glucose metabolism in fish: A review. J. Comp. Physiol. B Biochem. Syst. Environ. Physiol. 2012, 182, 1015–1045. [Google Scholar] [CrossRef]
  28. Boonanuntanasarn, S.; Kumkhong, S.; Yoohat, K.; Plagnes-Juan, E.; Burel, C.; Marandel, L.; Panserat, S. Molecular responses of Nile tilapia (Oreochromis niloticus) to different levels of dietary carbohydrates. Aquaculture 2018, 482, 117–123. [Google Scholar] [CrossRef]
  29. Rashid, G.; Benchetrit, S.; Fishman, D.; Bernheim, J. Effect of advanced glycation end-products on gene expression and synthesis of TNF-α and endothelial nitric oxide synthase by endothelial cells. Kidney Int. 2004, 66, 1099. [Google Scholar] [CrossRef]
  30. Yu, W.Z. Study on Inflammation and Glycolipid Metabolism Disorders Induced by Advanced Glycation end Products (AGEs). Master’s Thesis, Shanghai Ocean University, Shanghai, China, 2019. [Google Scholar]
  31. Xu, X.; Chen, H.-W.; Yu, J.-P. Significance of glycated serum protein detection in diabetes surveillance. Lab. Med. 2006, 21, 136–139. [Google Scholar]
  32. Shi, H.J.; Xu, C.; Liu, M.Y.; Wang, B.K.; Liu, W.B.; Chen, D.H.; Zhang, L.; Xu, C.Y.; Li, X.F. Resveratrol improves the energy sensing and glycolipid metabolism of blunt snout bream Megalobrama amblycephala fed high-carbohydrate diets by activating the ampk-sirt1-pgc-1αnetwork. Front. Physiol. 2018, 9, 1258. [Google Scholar] [CrossRef]
  33. Zhang, X.; Jin, M.; Luo, J.; Xie, S.; Zhou, Q. Effects of dietary carbohydrate levels on the growth and glucose metabolism of juvenile swimming crab, Portunus trituberculatus. Aquac. Nutr. 2022, 2022, 7110052. [Google Scholar] [CrossRef]
  34. Gjøen, T.; Berg, T. Hepatic uptake and intracellular processing of LDL in rainbow trout. Biochim. Et Biophys. Acta 1993, 1169, 225–230. [Google Scholar] [CrossRef] [PubMed]
  35. Liu, Y. Prognostic analysis of severe hepatitis based on serum aspartate aminotransferase to alanine aminotransferase. J. Xiang Nan Univ. 2004, 03, 45–46. [Google Scholar]
  36. Li, J.; Wang, C.; Wang, L.; Zhao, Z.; Luo, L.; Xu, Q. Effects of different carbohydrate types and carbohydrate levels on intestinal digestive enzyme activities, intestinal and liver histological structure of songpu mirror carp (C. carpio specularis). Chin. J. Anim. Nutr. 2016, 28, 3217–3224. [Google Scholar]
  37. Zhao, K.; Wei, T.; Yang, F. Chymotrypsin-dependent cleavage and activation of calcineurin. Chin. J. Biophys. 2009, 25, 246–247. [Google Scholar]
  38. Qu, Z.-H.; Wu, L.-F.; Zhou, K.; Yang, L.; Zu, X.-J.; Duan, J. Effects of feed carbohydrate level on digestive enzyme and glucose metabolism enzyme activity of Phoxinus Lagowskii Dyb-Owski. J. Northwest AF Univ. (Nat. Sci. Ed.) 2019, 47, 25–32. [Google Scholar]
  39. Gao, M. Effects of dietary carbohydrates on digestive enzymes and related physiological indicators in juvenile southern catfish (Silurus meridionalis Chen). Ph.D. Dissertation, Southwest University, Pittsburgh, PA, USA, 2006. [Google Scholar]
  40. Kawai, S.I.; Ikeda, S. Studies on digestive enzymes of fishes—II: Effect of dietary change on the activities of digestive enzymes in carp intestine. Nippon Suisan Gakkaishi 1972, 38, 265–270. [Google Scholar] [CrossRef]
  41. Xing, S.; Sun, R. Effects of feed sugar level on growth and glucose metabolism of Pseudo-sciaena crocea. Chin. J. Hydrobiol. 2017, 41, 265–276. [Google Scholar]
  42. Han, B.; Song, L.P. Effect of dietary starch level on growth and digestive enzyme activity of freshwater black seabream. J. Shanghai Ocean Univ. 2010, 19, 207–213. [Google Scholar]
  43. Wang, S.Y.; Li, G.L. Advances in the study of constructive lipids and lipid enzymatic synthesis. China Lipids 2002, 27, 4. [Google Scholar]
  44. Wang, M.; Zhou, P.; Huang, W.; Zhou, Q. Effects of glucose supplemental level at different protein levels on growth performance, hepatic glycolysis and gluconeogenic key enzyme activities of large yellow croaker (Larm ichthys crocea Richardson). Chin. J. Anim. Nutr. 2015, 27, 2431–2442. [Google Scholar]
  45. Ighodaro, O.M.; Akinloye, O.A. First line defence antioxidants-superoxide dismutase (sod), catalase (cat) and glutathione peroxidase (gpx): Their fundamental role in the entire antioxidant defence grid. Alex. J. Med. 2017. [CrossRef]
  46. Situmorang, N.; Zulham, Z. Malondialdehyde (Mda) (Zat Oksidan Yang Mempercepat Proses Penuaan. J. Keperawatan Dan Fisioter. 2020, 2, 117–123. [Google Scholar] [CrossRef]
  47. Zhou, C.-P. Effects of Different Levels of Carbohydrate Diets on Growth, Immunity and Related Sugar Metabolizing Enzymes in the Dried Bream, M. bungee; Nanjing Agricultural University: Nanjing, China, 2012. [Google Scholar]
  48. Bai, J.; Liu, L.; Han, Y.; Jia, C.; Liang, C. One-step detection of hexokinase activity using a personal glucose meter. Anal. Methods 2018, 10, 1039. [Google Scholar] [CrossRef]
  49. Zhang, S.L. Effects of Sugar Structure, Sugar Level and Glycolipid Ratio in Feed on the Growth and Sugar Metabolism of Juvenile Pelteobagrus Vachelli. Master’s Thesis, Ocean University of China, Qingdao, China, 2011. [Google Scholar]
  50. Enes, P.; Panserat, S.; Kaushik, S.; Oliva-Teles, A. Effect of normal and waxy maize starch on growth, food utilization and hepatic glucose metabolism in European sea bass (Dicentrarchus labrax) juveniles. Comp. Biochem. Physiol. A Mol. Integr. Physiol. 2006, 143, 89–96. [Google Scholar] [CrossRef]
  51. Panserat, S.; Medale, F.; Blin, C.; Breque, J.; Vachot, C.; Plagnesjuan, E.; Gomes, E.; Krishnamoorthy, R.; Kaushik, S. Hepatic glucokinase is induced by dietary carbohydrates in rainbow trout, gilthead seabream, and common carp. Am. J. Physiol. Regul. Integr. Comp. Physiol. 2000, 278, R1164. [Google Scholar] [CrossRef]
  52. Li, J.N.; Xu, Q.Y.; Wang, C.A.; Wang, L.S.; Zhao, Z.G.; Luo, L. Effects of dietary glucose and starch levels on the growth, haematological indices and hepatic hexokinase and glucokinase mrna expression of juvenile mirror carp (C. Carpio). Aquac. Nutr. 2015, 22, 550–558. [Google Scholar] [CrossRef]
  53. Cournarie, F.; Azzout-Marniche, D.; Foretz, M.; Guichard, C.; Ferre, P.; Foufelle, F. The inhibitory effect of glucose on phosphoenolpyruvate carboxykinase gene expression in cultured hepatocytes is transcriptional and requires glucose metabolism. FEBS Lett. 1999, 460, 527–532. [Google Scholar] [CrossRef]
  54. Séverine, K.; Stéphane, P.; Lim, P.L.; Kaushik, S.; Ferraris, R.P. The role of hepatic, renal and intestinal gluconeogenic enzymes in glucose homeostasis of juvenile rainbow trout. J. Comp. Physiol. B 2008, 178, 429–438. [Google Scholar]
  55. Li, J.-H. Effects of Different Sugar Levels in Feed on Growth, Hepatopancreas Tissue Structure and Metabolism of Carp. Master’s Thesis, Tianjin Agricultural College, Tianjin, China, 2017. [Google Scholar]
  56. Deng, J.M.; Mai, K.S.; Qing-Hui, A.I.; Zhang, W.B. Effects of soybean oligosaccharides on nutritional characters of japanese flounder (Paralichthys olivaceus). Acta Hydrobiol. Sin. 2009, 33, 369–375. [Google Scholar] [CrossRef]
  57. Torrecillas, S.; Montero, D.; Caballero, M.J.; Robaina, L.; Zamorano, M.J.; Sweetman, J.; Izquierdo, M. Effects of dietary concentrated mannan oligosaccharides supplementation on growth, gut mucosal immune system and liver lipid metabolism of European sea bass (Dicentrarchus labrax) juveniles. Fish Shellfish Immunol. 2015, 42, 508–516. [Google Scholar] [CrossRef] [PubMed]
  58. Yu, C.; Zhang, J.; Qin, Q.; Liu, J.; Xu, J.; Xu, W. Berberine improved intestinal barrier function by modulating the intestinal microbiota in blunt snout bream (Megalobrama amblycephala) under dietary high-fat and high-carbohydrate stress. Fish Shellfish Immunol. 2020, 102, 336–349. [Google Scholar] [CrossRef]
  59. Castro, C.; Couto, A.; Diógenes, A.F.; Corraze, G.; Panserat, S.; Serra, C.R.; Oliva-Teles, A. Vegetable oil and carbohydrate-rich diets marginally affected intestine histomorphology, digestive enzymes activities, and gut microbiota of gilthead sea bream juveniles. Fish Physiol. Biochem. 2019, 45, 681–695. [Google Scholar] [CrossRef] [PubMed]
  60. Dias, J.; Alvarez, M.J.; Diez, A.; Arzel, J.; Corraze, G.; Bautista, J.; Kaushik, S. Regulation of hepatic lipogenesis by dietary protein/energy in juvenile European seabass (Dicentrarchus labrax). Aquaculture 1998, 161, 169–186. [Google Scholar] [CrossRef]
  61. Jiang, L.; Wu, H.; Huang, K.; Ma, Y.; Yang, Q.; Yu, D.; Zhong, L. Effects of dietary carbohydrate levels on growth performance and liver metabolism functions of juvenile tilapia (Oreochromis niloticus). J. Fish. China 2013, 37, 245–255. [Google Scholar] [CrossRef]
  62. Miao, L. Transcriptomic Analysis of microRNAs for High Glucose Metabolism and Regulation of miR-34a on Glucolipid Metabolism in Grouper Bream. Ph.D. Thesis, Nanjing Agricultural University, Nanjing, China, 2017. [Google Scholar]
  63. Essam, H.M.; Abdellrazeq, G.S. Pathogenesis of photobacterium damselae subspecies infections in sea bass and sea bream. Microb. Pathog. 2016, 99, 41–50. [Google Scholar] [CrossRef]
  64. Chaudhry, R.; Varacallo, M. Biochemistry, Glycolysis. In Stat Pearls; Stat Pearls Publishing: St. Petersburg, FL, USA, 2022. [Google Scholar]
  65. Zhou, C.; Ge, X.; Niu, J.; Lin, H.; Huang, Z.; Tan, X. Effect of dietary carbohydrate levels on growth performance, body composition, intestinal and hepatic enzyme activities, and growth hormone gene expression of juvenile golden pompano, Trachinotus ovatus. Aquaculture 2015, 437, 390–397. [Google Scholar] [CrossRef]
  66. Panserat, S.; Médale, F.; Brèque, J.; Plagnes-Juan, E.; Kaushik, S. Lack of significant long-term effect of dietary carbohydrates on hepatic glucose-6-phosphatase expression in rainbow trout (Oncorhynchus mykiss). J. Nutr. Biochem. 2000, 11, 22–29. [Google Scholar] [CrossRef]
  67. Panserat, S.; Plagnes-Juan, E.; Kaushik, S. Gluconeogenic enzyme gene expression is decreased by dietary carbohydrates in common carp (C. carpio) and gilthead seabream (Sparus aurata). BBA—Gene Struct. Expr. 2002, 1579, 35–42. [Google Scholar] [CrossRef]
  68. Metón, I.; Mediavilla, D.; Caseras, A.; Cantó, E.; Fernández, F.; Baanante, I.V. Effect of diet composition and ration size on key enzyme activities of glycolysis-gluconeogenesis, the pentose phosphate pathway and amino acid metabolism in liver of gilthead sea bream (Sparus aurata). Br. J. Nutr. 1999, 82, 223–232. [Google Scholar] [CrossRef]
  69. Adeva-Andany, M.M.; Pérez-Felpete, N.; Fernández-Fernández, C.; Donapetry-García, C.; Pazos-García, C. Liver glucose metabolism in humans. Biosci. Rep. 2016, 36, e00416. [Google Scholar] [CrossRef] [PubMed]
  70. Yu, S.; Zhang, S. Glucose metabolism and utilization of sugar in bait in fish. Mar. Sci. 1986, 4, 58–60. [Google Scholar]
  71. Wang, G. Effects of Dietary Carbohydrate Level on Growth, Blood Indexes and Gene Expression of GK, G6Pase and HSC70 in P. upturnal; Nanjing Agricultural University: Nanjing, China, 2009. [Google Scholar]
  72. Moreira, I.S.; Peres, H.; Couto, A.; Enes, P.; Oliva-Teles, A. Temperature and dietary carbohydrate level effects on performance and metabolic utilisation of diets in European sea bass (Dicentrarchus labrax) juveniles. Aquaculture 2008, 274, 153–160. [Google Scholar] [CrossRef]
  73. Jiang, Y. Nutritional Physiological Response of Largemouth Bass (Lepomis macrochirus) to Dietary Starch Level; Southwest University: Pittsburgh, PA, USA, 2020. [Google Scholar]
  74. Fabres, A.; De Andrade, C.P.; Guizzo, M.; Sorgine, M.H.F.; Paiva-Silva, G.D.O.; Masuda, A.; Vaz, I.D.S.; Logullo, C. Effect of gsk-3 activity, enzymatic inhibition and gene silencing by RNAi on tick oviposition and egg hatching. Parasitology 2010, 137, 1537–1546. [Google Scholar] [CrossRef] [PubMed]
  75. Al-Shura, A.N. Etiology of Blood Sugar Disorders. In Metabolic Disorders and Shen in Integrative Cardiovascular Chinese Medicine; Academic Press: Cambridge, MA, USA, 2021; pp. 11–16. [Google Scholar]
  76. Yang, S.; Du, J.; Luo, J.; Zhou, Y.; Long, Y.; Xu, G.; Zhao, L.; Du, Z.; Yan, T. Effects of different diets on the intestinal microbiota and immunity of common carp (Cyprinus Carpio). J. Appl. Microbiol. 2019, 127, 1327–1338. [Google Scholar] [CrossRef] [PubMed]
  77. Liu, C.; Zhao, L.P.; Shen, Y.Q. A systematic review of advances in intestinal microflota of fish. Fish Physiol. Biochem. 2021, 47, 2041–2053. [Google Scholar] [CrossRef]
  78. Lan, K.; Wu, G.; Wang, J.; Chen, X.; Wang, Y.; Zhou, C.; Lin, H.; Ma, Z. Effects of inulin addition to feed on survival, growth and intestinal flora of Trachinotus ovatus juveniles. South China Fish. Sci. 2022, 18, 11. [Google Scholar]
  79. Stackebrandt, E.; Murray, R.G.E.; Trüper, H.G. Proteobacteria classis Nov. a name for the phylogenetic taxon that includes the purple bacteria and their relatives. Int. J. Syst. Bact. 1988, 38, 321–325. [Google Scholar] [CrossRef]
  80. Shin, N.R.; Whom, T.W.; Bae, J.W. Proteobacteria: Microbial signature of dysbiosis in gut microbiota. Trends Biotechnol. 2015, 33, 496–503. [Google Scholar] [CrossRef]
  81. Textor, S.; Wendisch, V.F.; Graaf, A.A.D.; Müller, U.; Linder, M.I.; Linder, D.; Buckel, W. Propionate oxidation in Escherichia coli: Evidence for operation of a methyl citrate cycle in bacteria. Arch. Microbiol. 1997, 168, 428–436. [Google Scholar] [CrossRef]
Figure 1. Micrographs of transverse HE-stained gut sections fed diets (NCD and HCD) in L. maculatus for 8 weeks (×40). Normal carbohydrate diets (NCD, (a)), high carbohydrate diets (HCD, (b)). VH: Villus height.
Fishes 08 00431 g001
Figure 2. Micrographs of L. maculatus liver HE-stained sections and oil-red o-stained sections fed diets (NCD and HCD) for 8 weeks (×20). Red frame: The boundaries of hepatocytes are blurred. Normal carbohydrate diets (NCD, (a,c)), high carbohydrate diets (HCD, (b,d)).
Fishes 08 00431 g002
Figure 3. Effect of fed diets (NCD and HCD) on relative levels of liver glycolysis mRNA in L. maculatus. Glucokinase (GK, (a)), pyruvate kinase (PK, (b)), phosphofructokinase (PFK, (c)). Data are expressed as mean ± SE. Significant differences between the values obtained in the NCD and HCD groups (p < 0.05) are marked with an asterisk by t-test.
Fishes 08 00431 g003
Figure 4. Effect of fed diets (NCD and HCD) on relative levels of liver gluconeogenesis mRNA in L. maculatus. Pyruvate carboxylase (PC, (a)), fructose 1, 6-bisphosptase (FBP, (b)), phosphoenolpyruvate carboxykinase (PEPCK, (c)), glucose-6-phosphatase (G6pase, (d)). Data are expressed as mean ± SE. Significant differences between the values obtained in the NCD and HCD groups (p < 0.05) are marked with an asterisk by t-test.
Fishes 08 00431 g004
Figure 5. Effects of fed diets (NCD and HCD) on the relative level of liver glycogen synthesis, glycogen decomposition, and pentose phosphate pathway mRNA in L. maculatus. Glycogen synthase kinase-3β (Gsk3β, (a)), glycogen phosphorylase (GP, (b)), glucose-6-phosphate dehydrogenase (G6PD, (c)). Data are expressed as mean ± SE. Significant differences between the values obtained in the NCD and HCD groups (p < 0.05) are marked with an asterisk by t-test.
Fishes 08 00431 g005
Figure 6. Phylum-level microbiota composition of the intestinal microbiota.
Fishes 08 00431 g006
Figure 7. Genus-level microbiota composition of intestinal microbiota.
Fishes 08 00431 g007
Figure 8. Principal component analysis and principal coordinates analysis of intestinal microbiota.
Fishes 08 00431 g008
Table 1. Formulation and nutrient compositions of experimental diets. (%).
ItemsDiets
NCDHCD
Fish meal4040
Casein2020
Corn starch2030
Dextrin00
Glucose00
Microcrystalline cellulose10.50.5
Fish oil6.56.5
Vitamin premix a0.50.5
Mineral premix b0.50.5
Choline chloride0.50.5
Soy lecithin11
Betaine0.20.2
Antioxidant0.10.1
Carboxymethyl-cellulose0.20.2
Proximate analysis
Dry material94.394.3
Crude protein42.943.0
Crude lipid11.511.5
Crude ash7.47.5
Nitrogen-free extract 20.430.2
Energy18.219.9
a Vitamin premix (mg/kg diet): VB1 25, VB2 45, VB12 0.1, VK3 10, VC 2000, inositol 800, nicotinic acid 200, folic acid 1.2, biotin 32, VD3 5, VE 120, ethoxyquin 150, pantothenic acid 500, avicel 14.52. b Mineral premix (mg/kg diet): NaF 4, KI 1.6, CoCl2•6H2O (1%) 100, CuSO4•5H2O 20, FeSO4•H2O 160, ZnSO4•H2O 100, MnSO4•H2O 120, MgSO4•7H2O 2400, Ca(H2PO4)2•H2O 6000, NaCl 200.
Table 2. Primers used in the present study.
GeneForward Sequence (5′3′)Reverse Sequence (5′3′)Purpose
GKTGACAAGGGTATCCTGCTCAACTTTCCAACAATCATCCCAACTTCART-qPCR
PFKGGCAAACCCATCTCCTCAACTGTCCCTGAGCGAGTGCTAACCRT-qPCR
PKGCTCGACTACAAGAACATTACCAAAGTCCTGGATGTCCTTATCTGAAACART-qPCR
PCCAAACGTCCCTTTCCAGATGCCTTAGAGCGCCGATCAGAAGCRT-qPCR
FBPTGACGAACCTGCTCAACTCCAACTGCCATACAGCGCATAACCRT-qPCR
PEPCKGGCAGATCGTCTCATTCGGTAGTGCCTTGGTCGTCAAACTTCATRT-qPCR
G6PaseCTCCTTCGCTGTCGGCTTCTCTGCTGCTCTTCTTGGTCTCGRT-qPCR
GSK3βGAGATAAGGATGGCAGCAAGGTACTCTGTAGACAGTCTCGGGAACGRT-qPCR
GPCATTGAGAAACTCGACTGGGACAGCAACTCCATTGACAGCGTGART-qPCR
G6PDACGTGGTGCTGGGTCAGTATGTTCTTGCTCATCATCTTGGCGTART-qPCR
β-actinCAACTGGGATGACATGGAGAAGTTGGCTTTGGGGTTCAGGRT-qPCR
Table 3. Effects of different dietary carbohydrate levels on the growth performance of L. maculatus.
ItemsGroups
NCDHCD
Initial weight (g)9.40 ± 0.069.50 ± 0.00
Final weight (g)76.50 ± 2.5781.33 ± 1.63
Survival rate (SR, %)90.67 ± 3.5384.00 ± 8.00
weight gain rate (WGR) (%)641.63 ± 56.24616.33 ± 51.79
Specific growth rate SGR (% /d)3.56 ± 0.143.51 ± 0.13
Feed conversion ratio (FCR)1.01 ± 0.041.02 ± 0.05
Condition factor (CF, %)1.92 ± 0.072.71 ± 0.12 *
Viscerasomatic index (VSI, %)9.26 ± 0.539.03 ± 0.44
Hepatosomatic index (HSI, %)0.98 ± 0.081.03 ± 0.10
Carcass index (CI, %)63.07 ± 1.2364.41 ± 0.60
Visceral adipose index (VAI, %)4.46 ± 0.705.63 ± 0.86
Liver glycogen(mg/g)9.68 ± 0.0512.25 ± 0.31 *
Data are expressed as mean ± SE. Significant differences between the values obtained in the NCD and HCD groups (p < 0.05) are marked with an asterisk by t-test.
Table 4. Effects of different dietary carbohydrate levels on plasma biochemistry of L. maculatus.
ItemsGroups
NCDHCD
AGES (mg/L)37.49 ± 0.9840.74 ± 0.48 *
INS (uIU/mL)15.51 ± 0.4616.58 ± 0.08
LD (mmol/L)2.50 ± 0.243.23 ± 0.20
PA (mmol/L)0.14 ± 0.000.20 ± 0.02
GSP (umol/L)236.60 ± 7.93267.56 ± 6.87 *
TC (mmol/L)4.08 ± 0.235.88 ± 0.32 *
TG (mmol/L)5.59 ± 0.226.68 ± 0.10 *
HDL (mmol/L)1.88 ± 0.022.72 ± 0.05 *
LDL (mmol/L)0.93 ± 0.011.35 ± 0.00 *
GLU (mmol/L)13.18 ± 0.1413.24 ± 0.06
AST(U/L)43.22 ± 1.2356.05 ± 0.70 *
ALT(U/L)10.55 ± 0.2411.25 ± 0.54
Data are expressed as mean ± SE. Significant differences between the values obtained in the NCD and HCD groups (p < 0.05) are marked with an asterisk by t-test.
Table 5. Effects of different dietary carbohydrate levels on digestive enzyme activities in the intestines of L. maculatus.
ItemsGroups
NCDHCD
Lipase (U/mg. Protein)12.85 ± 0.1725.46 ± 0.75 *
Chymotrypsin (U/mg. Protein)37.47 ± 0.6640.72 ± 0.68 *
α-Amylase (U/g.protein)15.26 ± 0.4220.87 ± 0.82 *
Data are expressed as mean ± SE. Significant differences between the values obtained in the NCD and HCD groups (p < 0.05) are marked with an asterisk by t-test.
Table 6. Effects of high dietary carbohydrate level on liver antioxidant indexes of L. maculatus.
ItemsGroups
NCDHCD
SOD (U/mg. Protein)4.37 ± 0.014.13 ± 0.07 *
T-AOC (U/mg.protein)0.24 ± 0.010.18 ± 0.01 *
CAT (U/mg. protein)2.56 ± 0.042.24 ± 0.03 *
MDA (nmol/mg. protein)0.27 ± 0.010.35 ± 0.00 *
Data are expressed as mean ± SE. Significant differences between the values obtained in the NCD and HCD groups (p < 0.05) are marked with an asterisk by t-test.
Table 7. Effects of different dietary carbohydrate levels on glucose metabolism enzyme activities in the liver of L. maculatus.
ItemsGroups
NCDHCD
HK0.37 ± 0.010.62 ± 0.00 *
PEPCK8.09 ± 0.218.35 ± 0.18
Data are expressed as mean ± SE. Significant differences between the values obtained in the NCD and HCD groups (p < 0.05) are marked with an asterisk by t-test.
Table 8. Effects of different dietary carbohydrate levels on villus height in the intestinal of L. maculatus.
ItemsGroups
NCDHCD
Villus height27.85 ± 1.7621.02 ± 1.68 *
Data are expressed as mean ± SE. Significant differences between the values obtained in the NCD and HCD groups (p < 0.05) are marked with an asterisk by t-test.
Table 9. Effects of fed diets (NCD and HCD) on the intestinal microbiota of L. maculatus.
ItemsNCDHCD
OTUs845973
ACE index254.23 ± 45.18272.29 ± 79.40
Chao1 index240.62 ± 43.97259.29 ± 77.16
Simpson index0.42 ± 0.050.76 ± 0.03 *
Shannon index1.68 ± 0.152.76 ± 0.33 *
Coverage rate0.99950.9995
Data are expressed as mean ± SE. Significant differences between the values obtained in the NCD and HCD groups (p < 0.05) are marked with an asterisk by t-test.
Disclaimer/Publisher’s Note: The statements, opinions and data contained in all publications are solely those of the individual author(s) and contributor(s) and not of MDPI and/or the editor(s). MDPI and/or the editor(s) disclaim responsibility for any injury to people or property resulting from any ideas, methods, instructions or products referred to in the content.

