Communication

First Mitogenome of Endangered Enteromius thysi (Actinopterygii: Cypriniformes: Cyprinidae) from Africa: Characterization and Phylogeny

1
Department of Marine Biology, Pukyong National University, Busan 48513, Republic of Korea
2
Department of Fisheries, Mariano Marcos State University, Currimao 2903, Ilocos Norte, Philippines
3
Research Center for Marine Integrated Bionics Technology, Pukyong National University, Busan 48513, Republic of Korea
4
Department of Marine, Faculty of Fisheries and Marine Science, Universitas Airlangga, Jl. Mulyorejo, Kampus C, Surabaya 60115, East Java, Indonesia
5
Ministry of Livestock, Fisheries and Animal Industries (MINEPIA), Yaoundé 00237, Cameroon
*
Author to whom correspondence should be addressed.
These authors contributed equally to this work.
Fishes 2023, 8(1), 25; https://doi.org/10.3390/fishes8010025
Submission received: 14 December 2022 / Revised: 26 December 2022 / Accepted: 28 December 2022 / Published: 30 December 2022
(This article belongs to the Section Taxonomy, Evolution, and Biogeography)

Abstract

:
The complete mitochondrial genome of endangered Enteromius thysi was determined from Cameroon in Western Africa. The genome was 16,688 bp in length, comprising 37 genes (13 PCGs, 2 rRNAs, 22 tRNAs, and an AT-rich control region). The heavy strand accommodates 28 genes (12 PCGs, 2 rRNAs, and 14 tRNAs), whereas the light strand holds 9 genes (NAD6 and 8 tRNAs). The E. thysi mitogenome is AT-biased (60.5%), as exhibited in other Enteromius species. Most of the PCGs start with the ATG initiation codon, except COI, with GTG, and seven PCGs end with the TAA termination codon, except some with an incomplete termination codon. Most of the tRNAs showed classical cloverleaf secondary structures, except tRNA-serine (trnS1). Bayesian phylogeny distinctly separated E. thysi from other congeners. The control regions of Enteromius species exhibited highly variable nucleotides, and parsimony-informative sites were found in the conserved sequence block-III (CSB-III) compared with other domains and a unique 9 bp tandem repeat (ATGCATGGT) in the variable-number tandem repeats (VNTRs) region of E. thysi. The present phylogeny with limited mitogenomes showed an uneven diversity and evolutionary patterns of Enteromius species distributed in the northwestern and southeastern riverine systems in Africa, which warrants further investigation. Based on the results of the present study, we recommend additional surveys, in-depth taxonomy, and the generation of more mitogenomes that could resolve the diversification pattern of Enteromius species in Africa.

1. Introduction

The family Cyprinidae (order Cypriniformes) is a species-rich group with 1781 valid species under 157 genera distributed in North America, Africa, and Eurasia [1]. African Cyprinids were broadly segregated into three groups: small diploid species, small-to-medium tetraploid species, and large hexaploid species [2]. Later, the generic status of small African diploid minnows (genus Barbus) was elevated to Enteromius [3,4,5]. To date, the genus Enteromius has been reported to include 224 valid species widely distributed in the African continent [6]. These Enteromius species are distinguished from other small minnows by their unique morphology [7]. However, the morphology and color pattern often overlapped within the Enteromius members poses difficulties for species-level identification [4,8]. Consequently, the distribution patterns of many Enteromius are thought to overlap over a surprisingly wide geographic range across multiple river systems, avoiding dispersal limitations by terrestrial barriers [9]. Such a scenario evidences the lack of knowledge of the phenotypic and lineage diversification of African freshwater fishes in time and space. As a result, these taxonomic barriers are hampering biodiversity campaigns and conservation efforts.
Among extant African small barb, Enteromius thysi was discovered in the Kake River, Mungo River basin, Cameroon. The species has restricted distribution in Western Africa (Cameroon, Equatorial Guinea, and Bioco Island). Nevertheless, E. thysi faces several threats, such as habitat destruction, sedimentation, and pollution, as well as anthropogenic pressure [10]. Thus, the IUCN specialist group categorized E. thysi under ‘endangered’ status as per its extent of occurrence (EOO) and area of occupancy (AOO). To date, few studies have been conducted on E. thysi based on their morphology and molecular data. The nuclear (RH, RAG1, IRBP, and EGR2B) and mitochondrial (NAD4, NAD5, CYTB, COI, and 16S rRNA) genes of E. thysi were generated to elucidate their phylogeny, resolving the classification of Cyprinids [3,11]. With advances in molecular studies of biodiversity and systematics, the evolutionary assessment of fishes through complete mitochondrial genomes has blossomed at a rapid pace worldwide [12,13]. Mitogenomic assessments often provide useful clues to understanding the architecture of mitochondrial genes that play important roles in adaptive divergence and speciation [14,15,16]. In addition, global communities are enriching future analysis pipelines by building mitochondrial genome databases to identify fish diversity from environmental DNA [17,18]. Prior to this study, the mitogenomes of a total of 13 Enteromius species had been generated around the world [19,20]. To improve in-depth phylogenetic knowledge of Cyprinids, the aim of the present study was to generate the complete mitogenome of E. thysi for the first time and characterize its genomic features. This genetic information can strengthen the mitogenomic library of Cyprinid fishes and would benefit future molecular examination and encourage scientific conservation of endangered E. thysi in Africa.

2. Materials and Methods

2.1. Sampling and Species Identification

A single individual of Enteromius species was opportunistically collected from the Nyong River (3.7649 N 12.2468 E) in Cameroon (Figure 1). Experimental protocols were carried out in accordance with relevant ARRIVE 2.0. (https://arriveguidelines.org) guidelines and regulations. The ethics review board, IACUC (Institutional Animal Care and Use Committee), of the host institute confirmed that the use of muscle tissue from dead animals, which were not killed by the researcher, did not involve any animal ethical issue. The specimen was tentatively identified as E. thysi according to its morphological characteristics [7]. An adequate amount of tissue was collected and preserved in 70% ethanol in a 2 mL centrifuge tube at 4 °C. To confirm the species identity, we amplified the partial COI sequences using published primers (FISH-BCL and FISH-BCH) [21]. The generated sequences showed 99.21% similarity with the published database sequence (KP712036) of E. thysi [3]. Hence, we confirmed the species’ identity and proceed with further molecular investigation. The range distribution shape file of E. thysi was downloaded from the IUCN (https://www.iucnredlist.org/), and a map was prepared using ArcGIS 10.6 software (ESRI1, CA, USA) and edited manually.

2.2. DNA Extraction, Sequencing, and Assembly

Genomic DNA was extracted using an AccuPrep® genomic DNA extraction kit (Bioneer, Republic of Korea) according to the standard manufacturer protocol. The quality and quantity of genomic DNA were determined using a NanoDrop spectrophotometer (Thermo Fisher Scientific D1000, Waltham, MA, USA). To amplify the long fragments of the mitogenome, primer walking with a total of six sets of primer pairs was used in the present study (Table S1). A total of three contigs (NAD6 to D-loop, D-loop to 12S rRNA, and 12S rRNA to 16S rRNA) were determined by typical amplification; however, to achieve the other three long contigs (COI to COIII, COIII to NAD6, and 16S rRNA to COI) 2-step nested PCR was used. Each amplification reaction contained 1X PCR buffer, 10 pmol of each primer, 2.5 mM dNTPs, 1 U of Taq polymerase, and 1 µL of template DNA. The PCR amplification was performed by a TaKaRa PCR Thermal Cycler Dice® Gradient (Takara Korea Biomedical Inc. Seoul, Republic of Korea). The amplified products were purified using an AccuPrep® PCR/gel purification kit (Bioneer, Daejeon, Republic of Korea). The amplicons were further amplified with a BigDye® Terminator v3.1 cycle sequencing kit (Applied Biosystems) in DNA Engine Tetrad 2 Peltier Thermal Cycler (BIO-RAD) and sequenced bidirectionally in an automated sanger sequencer (96 capillaries; ABI PRISM 3730XL Analyzer) at Macrogen (https://dna.macrogen.com/) (Daejeon, Republic of Korea. The noisy parts were trimmed from each amplicon sequence using SeqScanner version 1.0 (Applied Biosystems Inc., CA, USA). The complete mitogenome was assembled by assuring the overlapping regions through MEGA v11 [22] and assured through nucleotide BLAST search (https://blast.ncbi.nlm.nih.gov). The contig, gene boundaries, and directions were confirmed by the MITOS v806 online webserver (http://mitos.bioinf.uni-leipzig.de) and MitoAnnotator (http://mitofish.aori.u-tokyo.ac.jp/annotation/input/) [18,23]. The protein-coding genes (PCGs) were confirmed after being translated into the putative amino acids as per the vertebrate mitochondrial genetic code through the Open Reading Frame Finder web tool (https://www.ncbi.nlm.nih.gov/orffinder/). The generated mitogenome was submitted to the GenBank database using the Bankit submission tool.

2.3. Mitogenome Characterization and Phylogenetic Analyses

A circular illustration of the generated mitogenome of E. thysi was plotted through the MitoAnnotator webserver (http://mitofish.aori.u-tokyo.ac.jp/annotation/input/). The overlapping regions and intergenic spacers between the neighbor genes were verified manually through Microsoft Excel. The mitogenome size and nucleotide composition were calculated using MEGA v11. The base composition skew of the mitogenome was calculated as previously described: AT skew = [A − T]/[A + T]; GC skew = [G − C]/[G + C] [24]. The boundaries of ribosomal RNA genes (rRNAs) and transfer RNA genes (tRNAs) were also confirmed by the MITOS online server, the tRNAscan-SE Search Server 2.0, and ARWEN 1.2 [25,26]. A total of eight Enteromius species (E. thysi, E. guirali, E. callipterus, E. pobeguini, E. eburneensis, E. fasciolatus, E. hulstaerti, and E. trimaculatus) were screened to determine the structural domains of control regions (CRs) by CLUSTAL X version 1.83 alignments [27]. The tandem repeats in the CRs were predicted by the online Tandem Repeats Finder web tool (https://tandem.bu.edu/trf/trf.html) [28]. To check the phylogenetic relationships, 13 Enteromius mitogenomes were downloaded from GenBank to form a dataset, and two sequences of Barbus species were incorporated as an outgroup (Table S2). The PCGs of all 16 mitogenomes were separately aligned and concatenated by the iTaxoTools 0.1 tool [29]. The best-fit model was calculated by partitioning each PCG using PartitionFinder 2 using CIPRES Science Gateway V. 3.3 [30,31]. A Bayesian (BA) tree was constructed using Mr. Bayes 3.1.2, and the MCMC was run for 1,000,000 generations with sampling at every 100th generation and 25% of samples rejected as burn-in [32]. The BA tree was further annotated by iTOL v4 (https://itol.embl.de/login.cgi) [33].

3. Results and Discussion

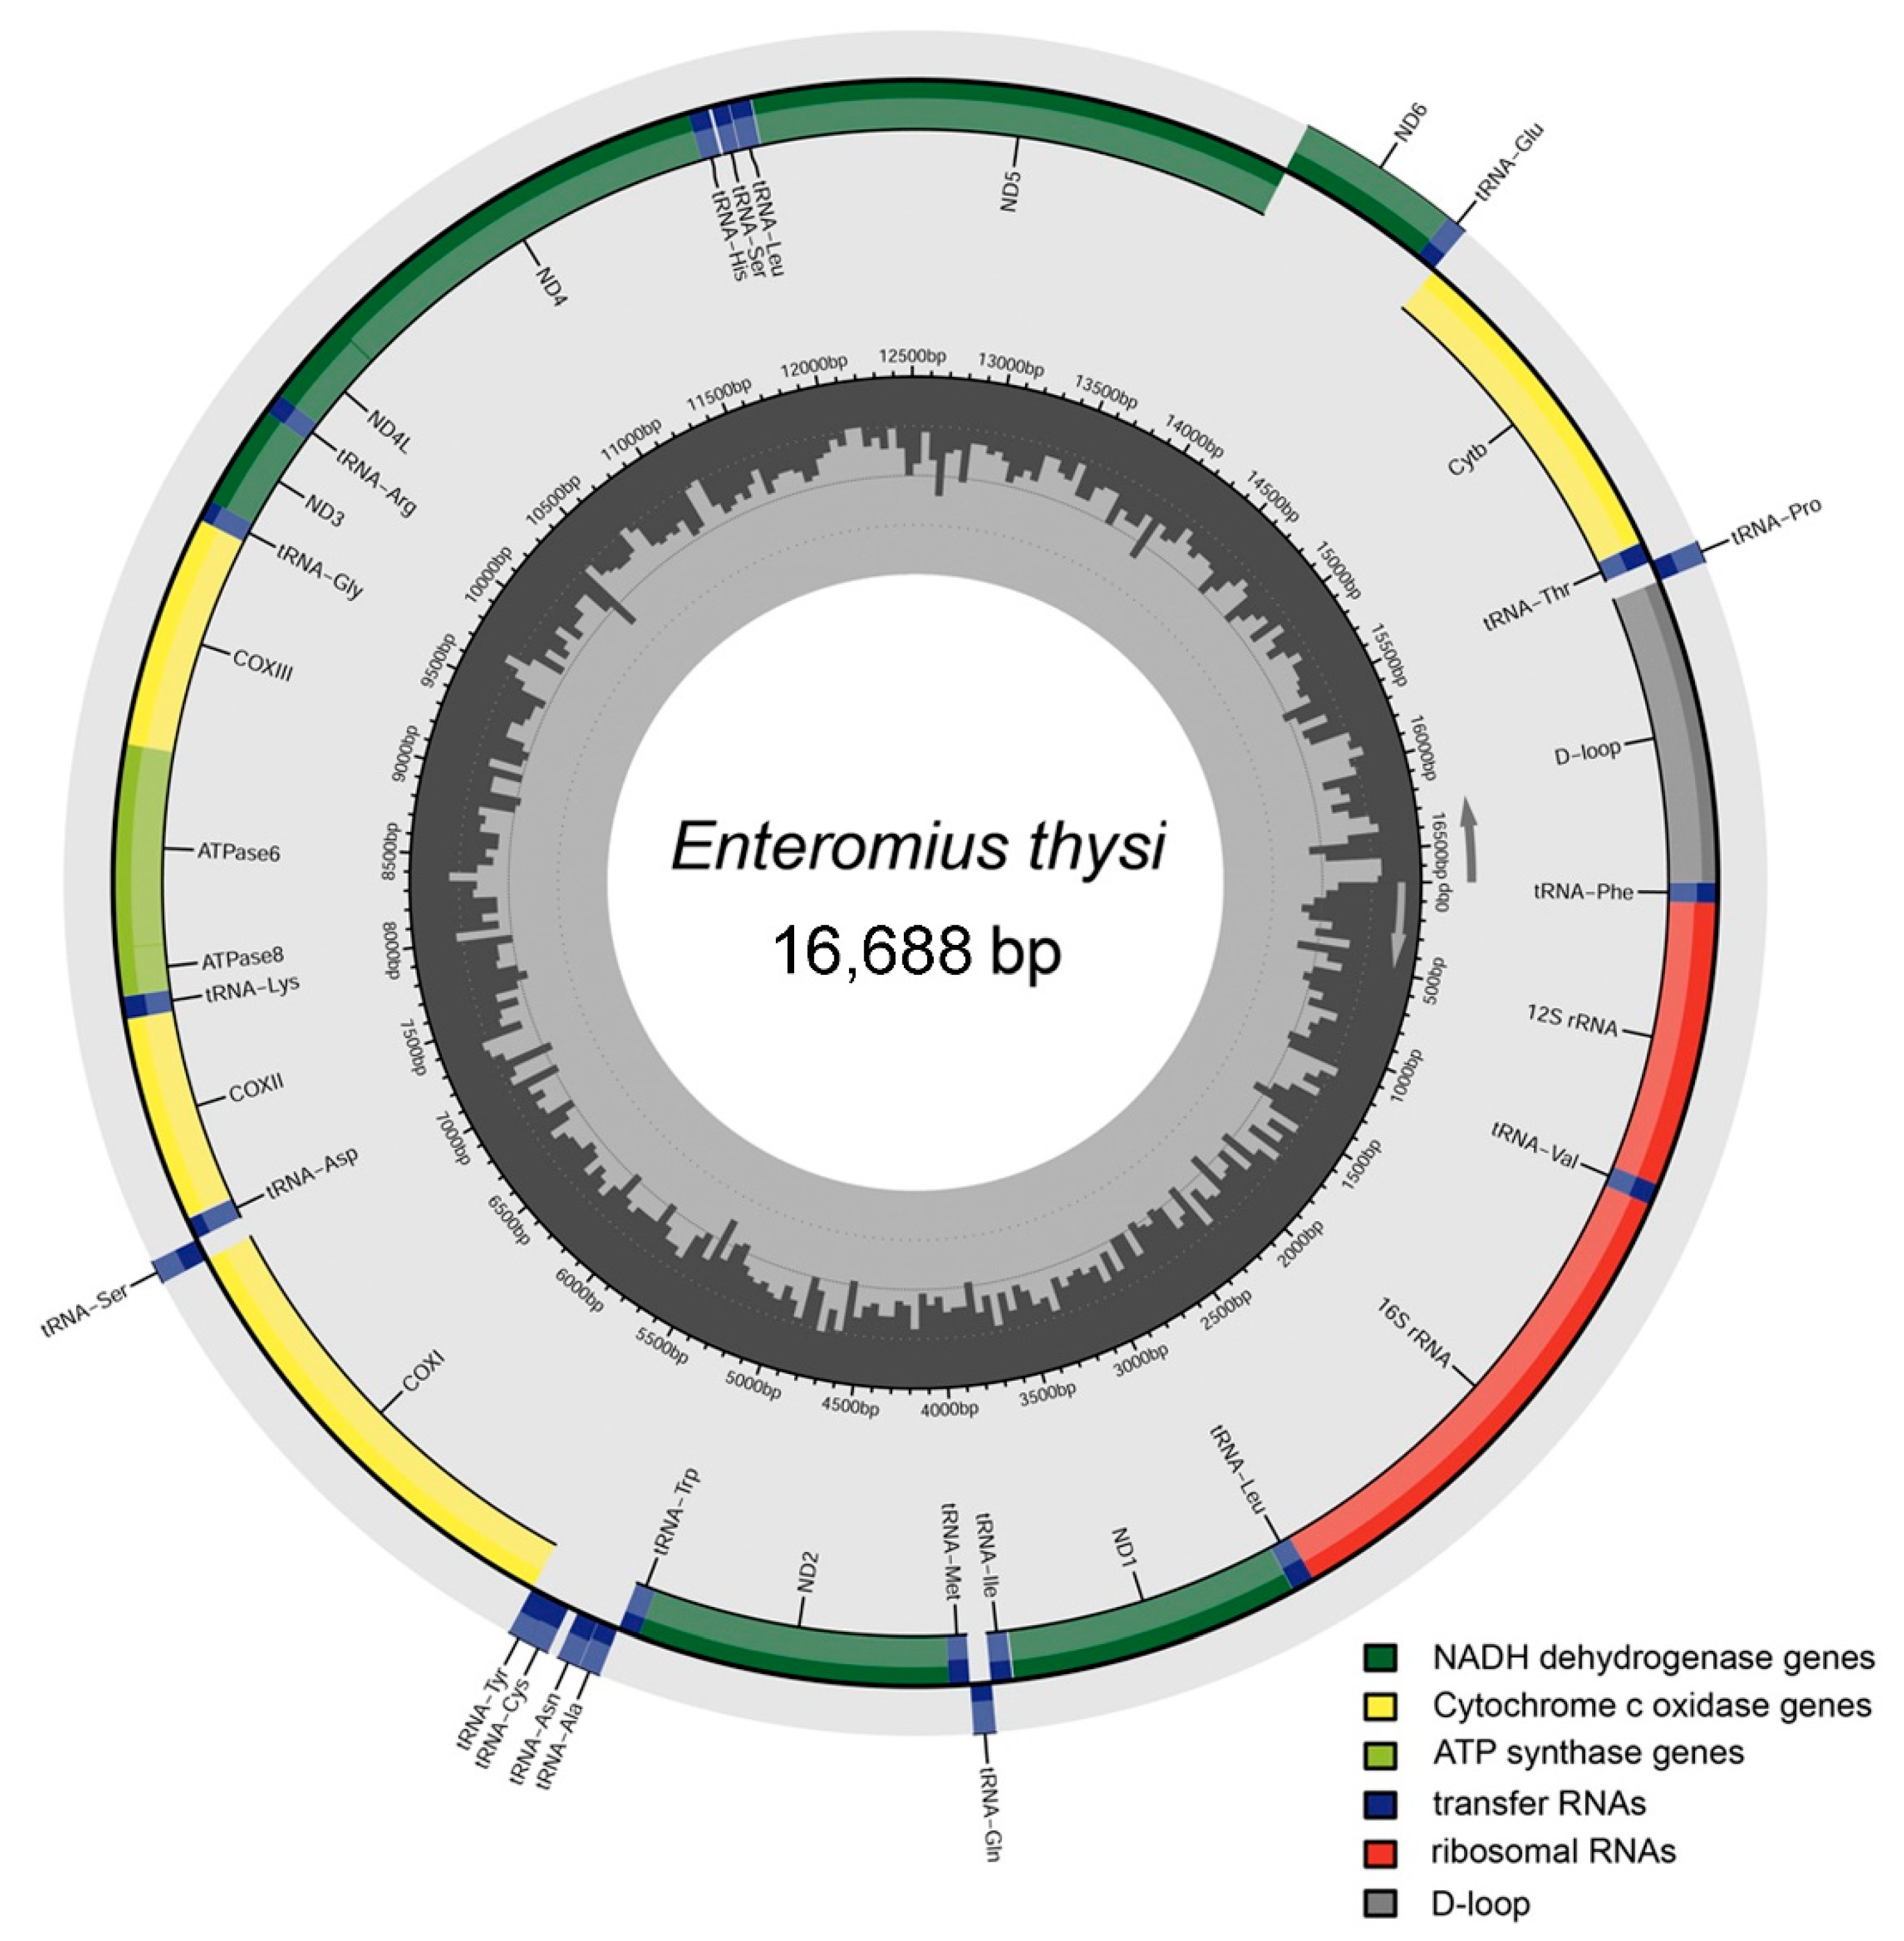
3.1. Mitogenome Structure and Organization

The mitogenome (16,688 bp) of endangered E. thysi was determined in the present study (GenBank accession no. OP819561) (Figure 2). Compared to the other Enteromius species, the mitogenome of E. thysi is longer than E. eburneensis (16,678 bp) and E. fasciolatus (16,566 bp); however, it is shorter than E. hulstaerti (16,775 bp), E. guirali (16,793 bp), and E. callipterus (16,859 bp). The longest mitogenome (16,933 bp) was observed in E. pobeguini, whereas the shortest genome (16,417 bp) was observed in E. trimaculatus (Table S2). The circular mitogenome of E. thysi constituted 13 protein-coding genes (PCGs), 22 transfer RNA genes (tRNAs), two ribosomal RNA genes (rRNAs), and a non-coding AT-rich control region (CR). A total of 28 genes (12 PCGs, 2 rRNAs, and 14 tRNAs) were located on the heavy strand, whereas NAD6 and 8 tRNAs were located on the light strand (Table 1). The mitogenome of E. thysi is AT-biased (60.5%), with 32.8% A, 15.4% G, 24.1% C, and 27.7% T, as observed in the mitogenomes of other Enteromius species (Table S3). This AT-biased nucleotide composition was similar to that of the mitogenomes of other vertebrates [34,35]. A total of 22 bp overlapping regions and 42 bp intergenic spacer regions were detected in the E. thysi mitogenome. The AT skew and GC skew were 0.084 and −0.220, respectively, in the mitogenome of E. thysi. Comparative analysis showed that the AT skew ranged from 0.049 (E. trimaculatus) to 0.120 (E. camptacanthus), and the GC skew ranged from −0.187 (E. hulstaerti) to −0.262 (E. camptacanthus) (Table S3). The genetic variations observed in mitochondrial genes might be connected the mechanism of evolution and favor the energy metabolism of Enteromius species, as evidenced in other vertebrates [36].

3.2. Protein-Coding Genes

A total of 13 canonical PCGs accounted for 68.33% of the mitogenome, measuring 11,403 bp in E. thysi. The shortest among the PCGs was ATP8, with a length of 165 bp, whereas the longest PCG was NAD5, with 1824 bp. The majority of the PCGs began with an ATG (Methionine) initiation codon, whereas COI begin with a GTG (valine) codon (Table 1). In terms of the termination codon, the typical TAA codon was observed among seven PCGs (NAD1, COI, ATP8, NAD4L, NAD5, NAD6, and CYTB), whereas the incomplete stop codons (TA-) and (T--) were exhibited among NAD2, ATP6, and COIII and among COII, NAD3, and NAD4, respectively, as maintained by other species. These incomplete termination codons may be completed to TAA by the addition of a poly A tail through RNA processing [37]. The PCGs (COI, NAD3, NAD4L, NAD6, and CYTB) were found to have negative GC skews, whereas NAD6 was found to have a positive GC skew in the E. thysi mitogenome (Table S3). Such genetic variations in PCGs correlate with the missense mutations and their independent selection, as revealed in other fishes [38,39,40].

3.3. Ribosomal RNA and Transfer RNA Genes

In E. thysi, the length of the ribosomal RNA genes was 2651 bp (15.88% of the total mitogenome) comprising a small ribosomal RNA (12S rRNA) and a large ribosomal RNA (16S rRNA), with lengths of 957 bp and 1694 bp, respectively. The rRNAs of E. thysi are the third largest compared to the other Enteromius species (Table S3). Such structure and variation, particularly the conserved multibranched loop of ribosomal subunits, allows us to gain substantial knowledge of catalytic reactions in protein synthesis [41]. Furthermore, the E. thysi mitogenome consists of 22 tRNA genes, which are characterized by a variation of a length of 67–76 bp and a total estimated length of 1558 bp (9.34% of the total mitogenome). Most of the tRNAs were predicted to fold in the typical cloverleaf secondary structure, except trnS1, which lacks d arms, as reported in other fish species [13]. These structural features are crucial for building the secondary structures of RNA structures and function in different biological systems [42]. The conventional base pairings (A=T and G≡C) were detected in 14 tRNAs; however, wobble base pairing was observed in 14 other tRNA genes (trnF, trnV, trnL2, trnQ, trnW, trnA, trnC, trnY, trnS2, trnD, trnK, trnG, trnE, and trnP) (Figure S1).

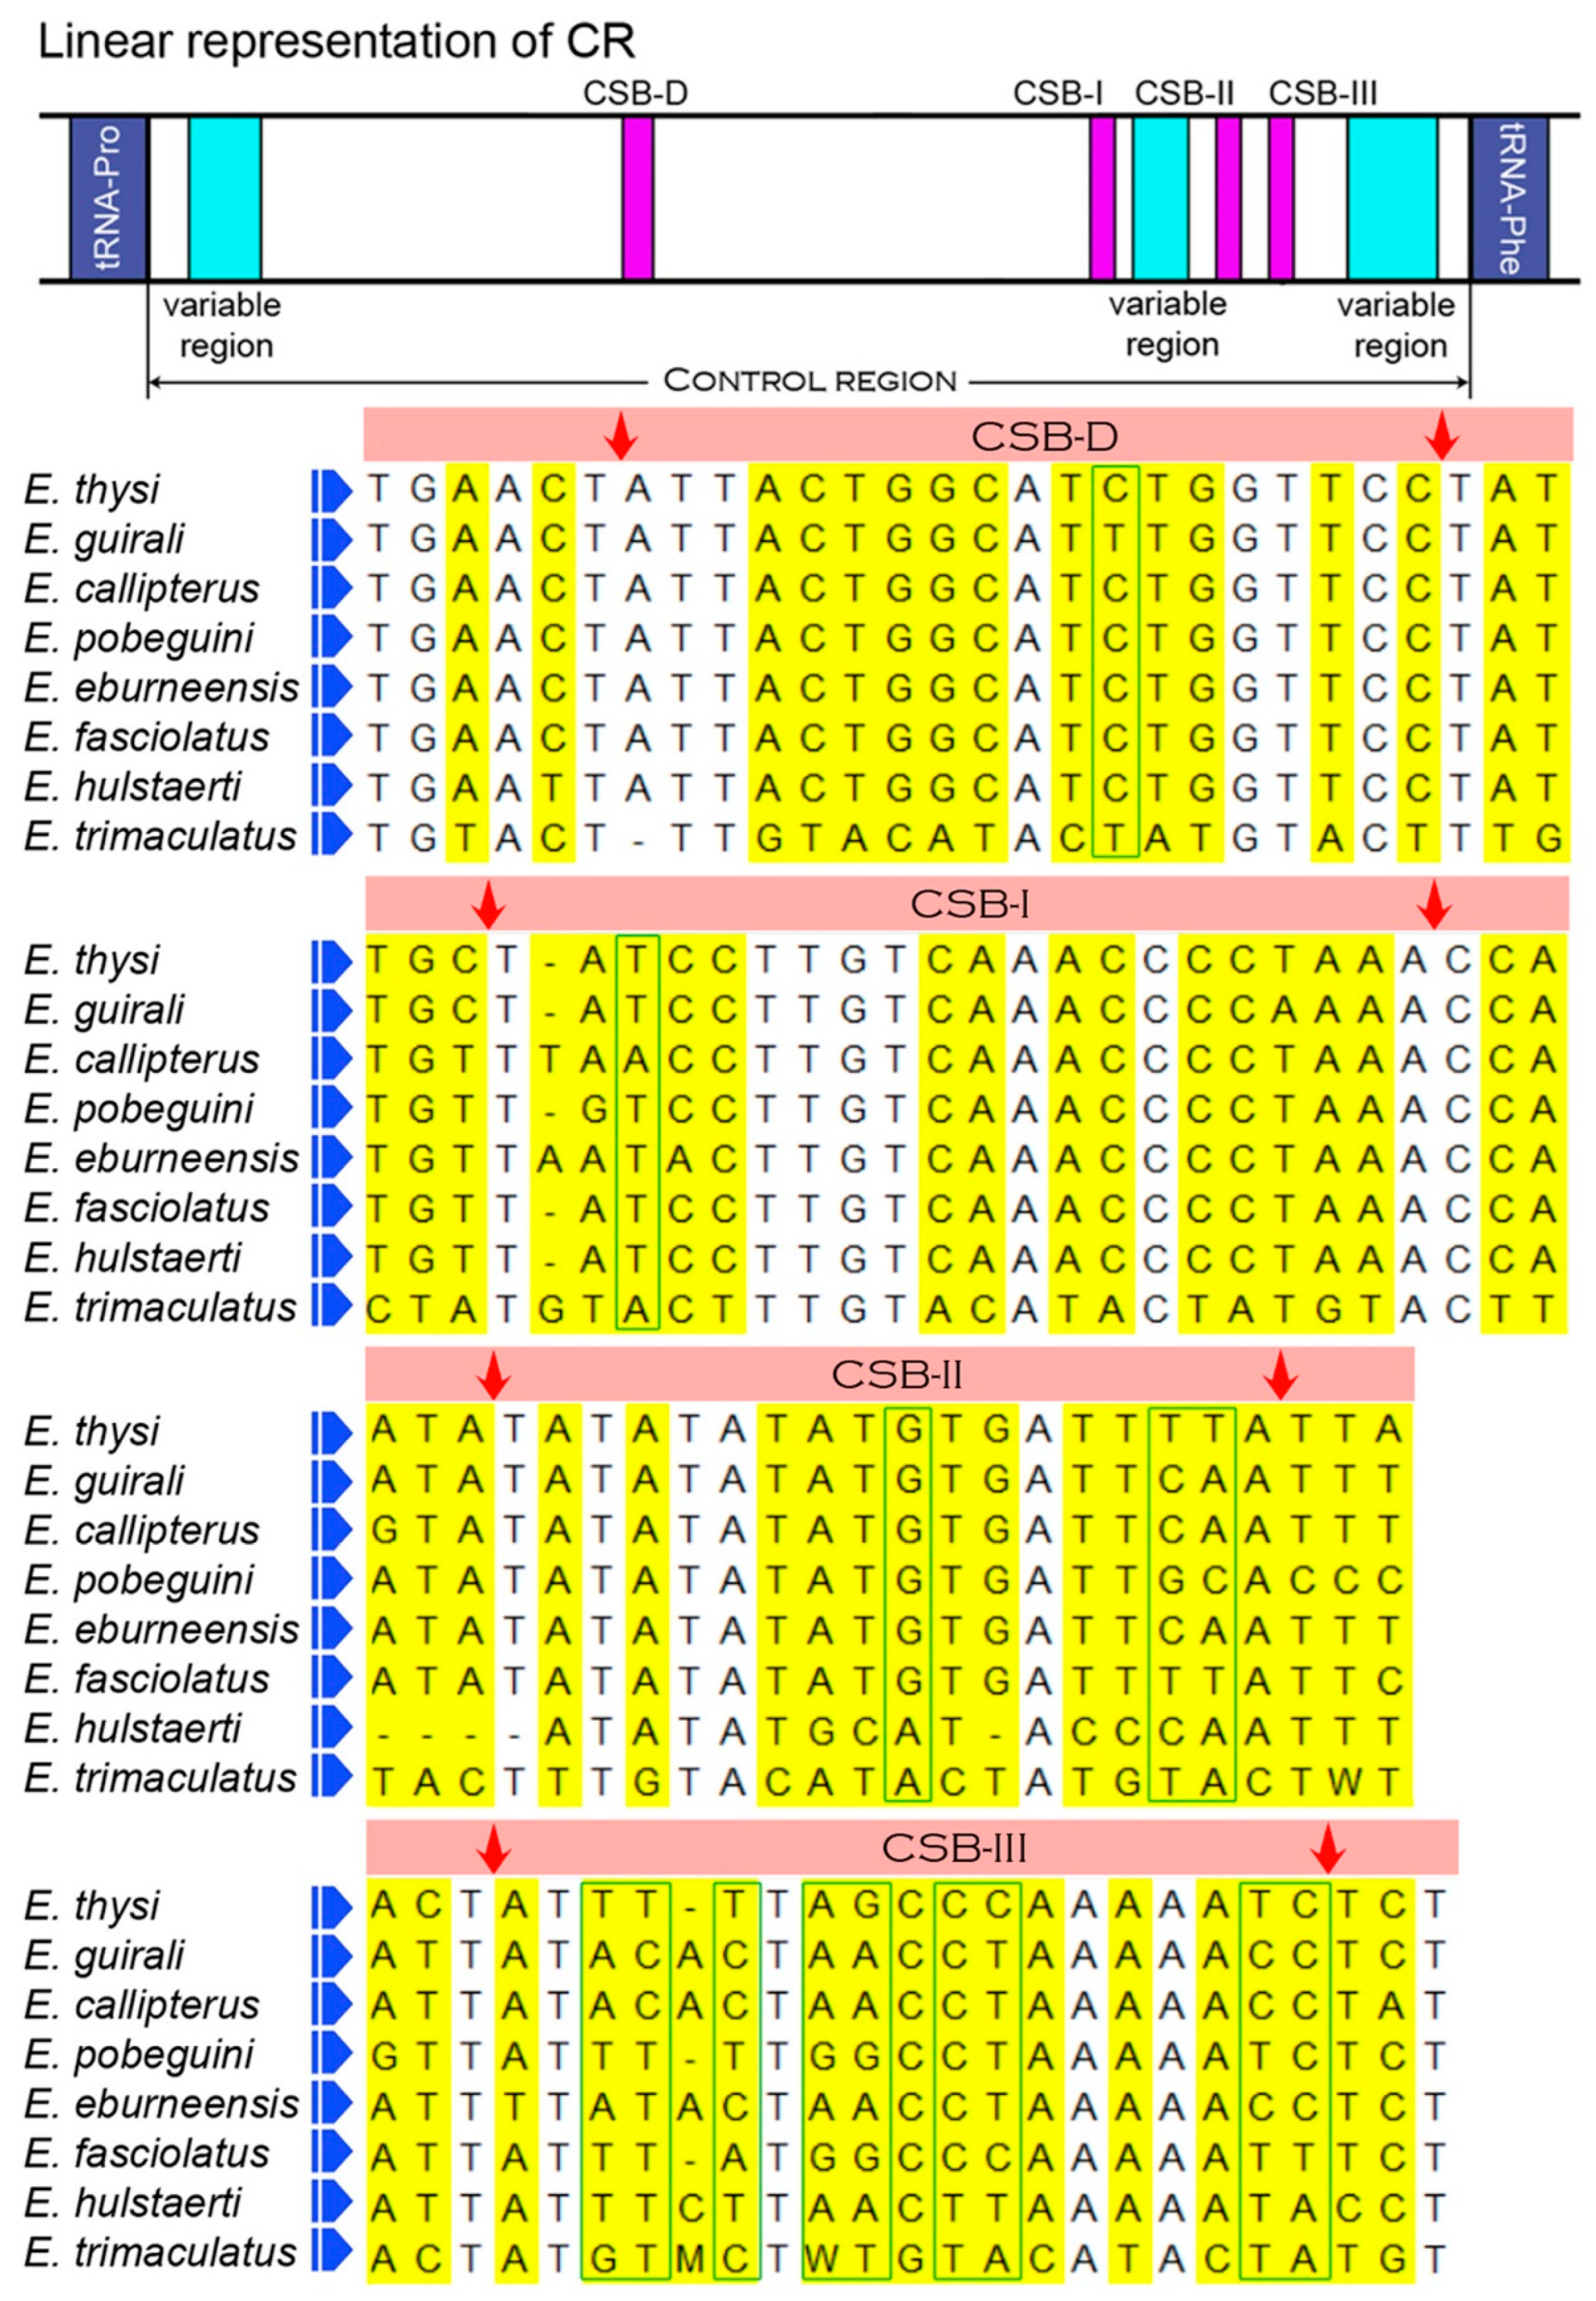
3.4. Features of Control Region

The total length of E. thysi CR was 1023 bp, comprising 67.8% AT and 32.2% GC contents. The full-length sequence of the control region was obtained from the eight Enteromius species, ranging from 757 bp in E. trimaculatus to 1268 bp in E. pobeguini (Table S3). A total >13 copies of 9 bp (ATGCATGGT) tandem repeats were found in the VNTRs (Variable Number Tandem Repeats) region of E. thysi CR. Comparative analysis revealed variations in VNTRs regions in three species: E. fasciolatus, with >13 copies of 2 bp (TA); E. hulstaerti, with >15 copies of 17 bp (ACCCTTAATGGTATAGT); and E. trimaculatus, with >37 copies of 18 bp (TATGTACTTTGTACATAC) repeat regions. No repeats were found in the CR of E. guirali, E. callipterus, E. pobeguini, or E. eburneensis. Conserved sequence blocks (CSBs) were found to be similar in all the studied Enteromius species, as reported in other vertebrates [13,43]. The lengths of CSB-D and CSB-III were similar (19 bp); however, CSB-I was 22 bp, and CSB-II was 18 bp. The variable regions within the different CSB domains of the studied Enteromius species ranged from 12 to 15 sites (Figure 3). Comparative analysis revealed highly variable nucleotides (15), and parsimony-informative sites were detected in CSB-III. The variable structures of these CRs can be used to detect intraspecific variation and future phylogeographic studies, as suggested for teleost fishes [44]. The presence of conserved domains in Enteromius species may play an important role in the replication and transcription of the genome, as in other vertebrate species.

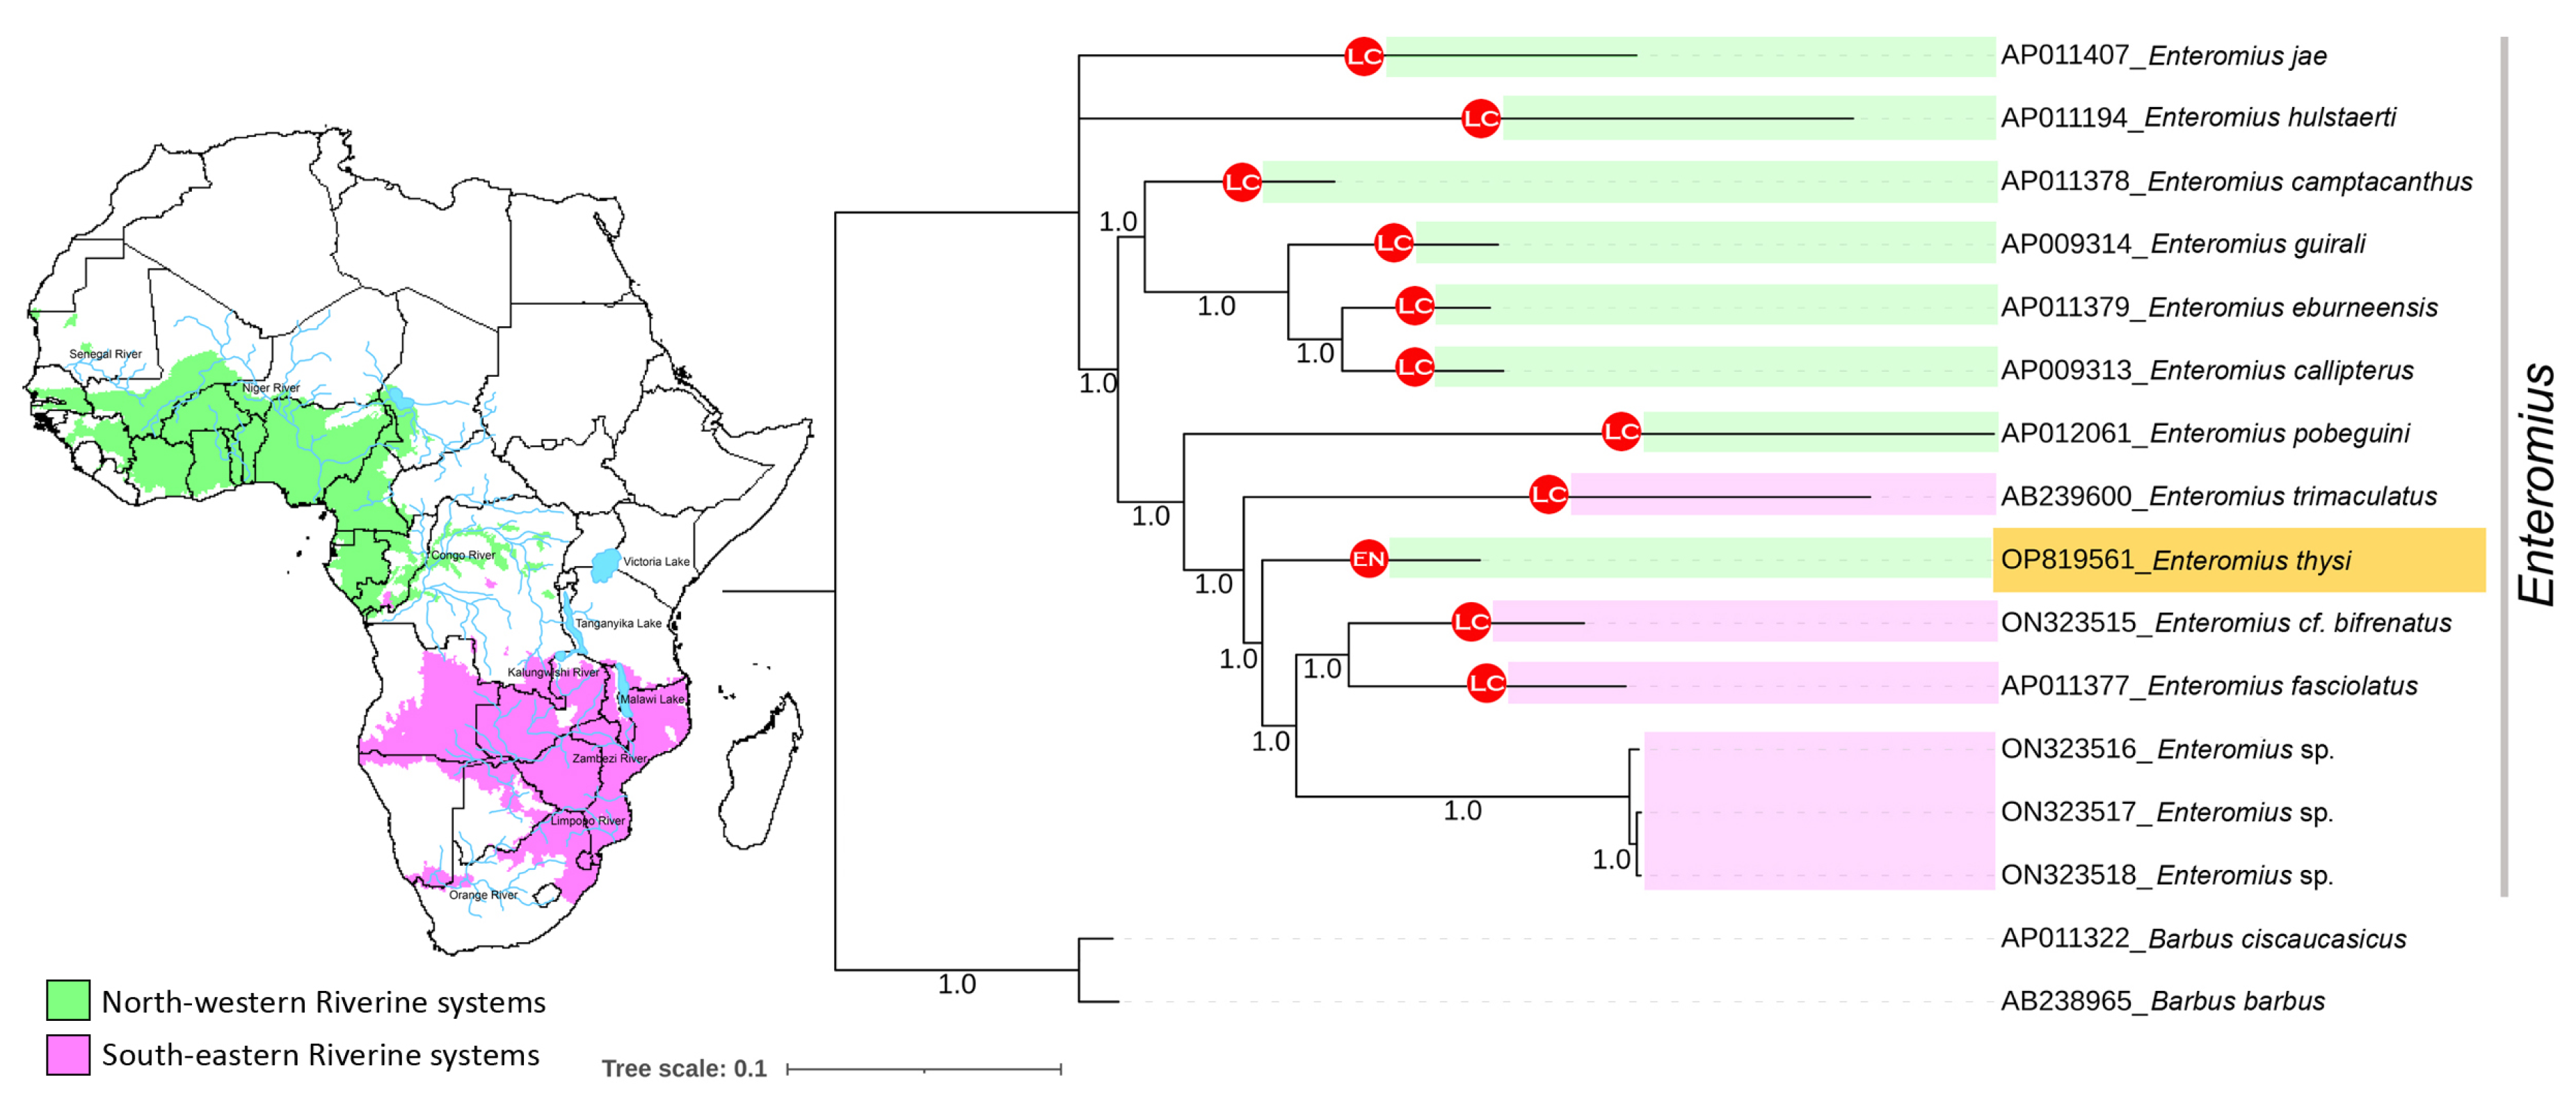
3.5. Phylogenetic Relationship of Enteromius

The mitogenome dataset with 13 concatenated PCGs showed distinct clustering of all Enteromius species in the Bayesian (BA) topology. Among the studied species, E. thysi was clearly separated from all other congeners (Figure 4). The BA topology was further investigated based on the known distribution pattern of Enteromius species. The ranges of Enteromius species were obtained from the IUCN (https://www.iucnredlist.org/) and mapped using the DIVA-GIS program (https://www.diva-gis.org/). Based on the known distribution pattern, the studied Enteromius species were categorized into two groups: (i) northwestern species distributed in three major rivers in Africa (Senegal River, Niger River, and Congo River) and (ii) southeastern species distributed in the Orange River, Limpopo River, Zambezi River, and Kalungwishi River. The Enteromius mitogenome generated from the Kalungwishi River is not named up to the species level and therefore not discussed in detail. Considering the BA phylogeny, E. jae and E. hulstaerti are distributed in northwestern riverine systems, separated from other congeners, and placed on the basal node of Enteromius. Furthermore, the four species (E. camptacanthus, E. guirali, E. eburneensis, and E. callipterus) distributed in the northwestern riverine systems closely clustered in the BA phylogeny with high posterior probability support. Three southeastern riverine species (E. trimaculatus, E. cf. bifrenatus, and E. fasciolatus) also revealed close assemblage in the BA phylogeny (Figure 4). However, E. pobeguini and the targeted taxa E. thysi distributed in the northwestern riverine systems were found to be surprisingly close to the southeastern riverine species in the present topology. Previous studies evidenced the non-monophyletic evolutionary pattern of Enteromius species (previously known as ‘Barbus’), with an unparallel diversification in African riverine systems. The present phylogenetic interpretation based on limited complete mitogenomic data was partially congruent with the earlier studies [3,7,11]. However, we suggest that more mitogenome sequences of other Enteromius are required to understand the clear evolutionary pattern of these charismatic fishes in Africa. This genetic information can help to elucidate the future population genetics of E. thysi in Africa.
The freshwater ecoregions of Africa are home to rich biodiversity, with many endemic fishes, representing a unique entity for evolutionary studies [45,46,47]. However, this freshwater biodiversity is rapidly declining due to several anthropogenic threats and global climate change, including in Africa [48,49,50]. Owing to the threatened status of E. thysi, we further suggest that additional surveys are essential to attain a better understanding of the biogeography of this endemic fish and to mitigate the threats within and beyond its distribution range. We advocate the integration of non-invasive sampling and a mitochondriomics approach to assess the status and conservation management of this endangered fish species.

4. Conclusions

In the present study, we generated the first complete mitogenome of E. thysi and enriched the global nucleotide library. We elucidated the structural features of E. thysi and conducted a comparative analysis with other Enteromius species. Such empirical molecular data are significant for inferring the functions of the mitochondrial genome and its associated genes. Mitogenome-based phylogenomic analysis affirmed the classification of Enteromius species, in contrast to the earlier hypothesis. The results of the present study suggest that the generation of more mitogenomes of Enteromius species would be beneficial for systematics research, especially to confirm classifications. Similar genetic information could facilitate other studies on the population genetics and phylogeny of Cyprinid fishes and on the evolution of tandem repeats within control regions.

Supplementary Materials

The following supporting information can be downloaded at: https://www.mdpi.com/article/10.3390/fishes8010025/s1, Table S1. List of designed primer pairs used for the long PCR to assemble the E. thysi mitogenome. Table S2: Mitogenomes of Enteromius species used in phylogenetic analysis. Table S3. Nucleotide composition of the mitochondrial genome in different Enteromius species. Figure S1. Putative secondary structures for 22 tRNA genes in the mitochondrial genome of E. thysi. The last structure shows the nucleotide positions and details of the stem loop of tRNAs.

Author Contributions

Conceptualization: S.K. and H.-W.K.; Data curation: J.D.B., P.S.D.A. and F.Z.G.; Formal analysis: S.K. and J.D.B.; Funding acquisition: H.-W.K.; Methodology: J.D.B., P.S.D.A., A.R.K., S.-R.L. and F.Z.G.; Project administration and Resources: H.-W.K.; Software: S.K., A.R.K. and S.-R.L.; Supervision: H.-W.K. and S.K.; Validation and Visualization: S.K., A.R.K., S.-R.L. and S.A.; Writing—original draft: S.K., J.D.B., A.R.K. and S.-R.L.; Writing—review and editing: S.K., A.R.K., S.-R.L. and H.-W.K. All authors have read and agreed to the published version of the manuscript.

Funding

This research was supported by the Basic Science Research Program through the National Research Foundation of Korea (NRF) funded by the Ministry of Education (2021R1A6A1A03039211) and partially supported by the Basic Science Research Program through the National Research Foundation of Korea (NRF) funded by the Ministry of Education (2020R1I1A3072978).

Institutional Review Board Statement

The ethics review board, IACUC (Institutional Animal Care and Use Committee), of the host institute confirmed that the use of muscle tissue from dead animals, which were not killed by the researcher, did not involve any animal ethical issue.

Informed Consent Statement

Not applicable.

Data Availability Statement

The genome sequence data that support the findings of this study are openly available in the GenBank of NCBI at https://www.ncbi.nlm.nih.gov under accession no. OP819561. The associated BioProject and BioSample numbers are PRJNA901429 and SAMN31713195, respectively.

Acknowledgments

S.K. acknowledges a Global Postdoc Program fellowship grant received from the Pukyong National University, South Korea.

Conflicts of Interest

The authors declare no conflict of interest.

References

  1. Fricke, R.; Eschmeyer, W.N.; Van der Laan, R. (Eds.) Eschmeyer’s Catalog of Fishes: Genera, Species. 2022. Electronic Version. Available online: http://researcharchive.calacademy.org/research/ichthyology/catalog/fishcatmain.asp (accessed on 16 November 2022).
  2. Martin, M.B.; Chakona, A. Designation of a neotype for Enteromius pallidus (Smith, 1841), an endemic cyprinid minnow from the Cape Fold Ecoregion, South Africa. Zookeys 2019, 848, 103–118. [Google Scholar] [CrossRef] [PubMed]
  3. Yang, L.; Sado, T.; Vincent Hirt, M.; Pasco-Viel, E.; Arunachalam, M.; Li, J.; Wang, X.; Freyhof, J.; Saitoh, K.; Simons, A.M.; et al. Phylogeny and polyploidy: Resolving the classification of cyprinine fishes (Teleostei: Cypriniformes). Mol. Phylogenet. Evol. 2015, 85, 97–116. [Google Scholar] [CrossRef] [PubMed]
  4. Van Ginneken, M.; Decru, E.; Verheyen, E.; Snoeks, J. Morphometry and DNA barcoding reveal cryptic diversity in the genus Enteromius (Cypriniformes: Cyprinidae) from the Congo basin, Africa. Eur. J. Taxon. 2017, 310, 1–32. [Google Scholar]
  5. Schmidt, R.C.; Bart, H.L., Jr.; Nyingi, W.D. Multi-locus phylogeny reveals instances of mitochondrial introgression and unrecognized diversity in Kenyan barbs (Cyprininae: Smiliogastrini). Mol. Phylogenet. Evol. 2017, 111, 35–43. [Google Scholar] [CrossRef] [Green Version]
  6. Schmidt, R.C.; Bart, H.L.J.; Nyingi, W.D. Integrative taxonomy of the red-finned barb, Enteromius apleurogramma (Cyprininae: Smiliogastrini) from Kenya, supports recognition of E. amboseli as a valid species. Zootaxa 2018, 4482, 566–578. [Google Scholar] [CrossRef]
  7. Hayes, M.M.; Armbruster, J.W. The taxonomy and relationships of the African small barbs (Cypriniformes: Cyprinidae). Copeia 2017, 105, 348–362. [Google Scholar] [CrossRef]
  8. Katemo Manda, B.; Snoeks, J.; Decru, E.; Bills, R.; Vreven, E. Enteromius thespesios (Teleostei: Cyprinidae): A new minnow species with a remarkable sexual dimorphism from the south-eastern part of the Upper Congo River. J. Fish Biol. 2020, 96, 1160–1175. [Google Scholar] [CrossRef]
  9. Kambikambi, M.J.; Kadye, W.T.; Chakona, A. Allopatric differentiation in the Enteromius anoplus complex in South Africa, with the revalidation of Enteromius cernuus and Enteromius oraniensis, and description of a new species, Enteromius mandelai (Teleostei: Cyprinidae). J. Fish Biol. 2021, 99, 931–954. [Google Scholar] [CrossRef]
  10. IUCN. The IUCN Red List of Threatened Species. Version 2018-2; IUCN: Gland, Switzerland, 2018; Available online: www.iucnredlist.org (accessed on 16 November 2022).
  11. Ren, Q.; Mayden, R.L. Molecular phylogeny and biogeography of African diploid barbs, ‘Barbus’, and allies in Africa and Asia (Teleostei: Cypriniformes). Zool. Scr. 2016, 45, 642–649. [Google Scholar] [CrossRef]
  12. Miya, M.; Kawaguchi, A.; Nishida, M. Mitogenomic exploration of higher teleostean phylogenies: A case study for moderate-scale evolutionary genomics with 38 newly determined complete mitochondrial DNA sequences. Mol. Biol. Evol. 2001, 18, 1993–2009. [Google Scholar] [CrossRef] [Green Version]
  13. Satoh, T.P.; Miya, M.; Mabuchi, K.; Nishida, M. Structure and variation of the mitochondrial genome of fishes. BMC Genom. 2016, 17, 719. [Google Scholar] [CrossRef] [PubMed]
  14. Kappas, I.; Vittas, S.; Pantzartzi, C.N.; Drosopoulou, E.; Scouras, Z.G. A Time-Calibrated Mitogenome Phylogeny of Catfish (Teleostei: Siluriformes). PLoS ONE 2016, 11, e0166988. [Google Scholar] [CrossRef] [PubMed] [Green Version]
  15. Zhang, K.; Zhu, K.; Liu, Y.; Zhang, H.; Gong, L.; Jiang, L.; Liu, L.; Lü, Z.; Liu, B. Novel gene rearrangement in the mitochondrial genome of Muraenesox cinereus and the phylogenetic relationship of Anguilliformes. Sci. Rep. 2021, 11, 2411. [Google Scholar] [CrossRef] [PubMed]
  16. Zhao, D.; Guo, Y.; Gao, Y. Natural selection drives the evolution of mitogenomes in Acrossocheilus. PLoS ONE 2022, 17, e0276056. [Google Scholar] [CrossRef] [PubMed]
  17. Iwasaki, W.; Fukunaga, T.; Isagozawa, R.; Yamada, K.; Maeda, Y.; Satoh, T.P.; Sado, T.; Mabuchi, K.; Takeshima, H.; Miya, M.; et al. MitoFish and MitoAnnotator: A mitochondrial genome database of fish with an accurate and automatic annotation pipeline. Mol. Biol. Evol. 2013, 30, 2531–2540. [Google Scholar] [CrossRef] [PubMed] [Green Version]
  18. Sato, Y.; Miya, M.; Fukunaga, T.; Sado, T.; Iwasaki, W. MitoFish and MiFish Pipeline: A Mitochondrial Genome Database of Fish with an Analysis Pipeline for Environmental DNA Metabarcoding. Mol. Biol. Evol. 2018, 35, 1553–1555. [Google Scholar] [CrossRef] [Green Version]
  19. Saitoh, K.; Sado, T.; Mayden, R.L.; Hanzawa, N.; Nakamura, K.; Nishida, M.; Miya, M. Mitogenomic evolution and interrelationships of the Cypriniformes (Actinopterygii: Ostariophysi): The first evidence toward resolution of higher-level relationships of the world’s largest freshwater fish clade based on 59 whole mitogenome sequences. J. Mol. Evol. 2006, 63, 826–841. [Google Scholar] [CrossRef]
  20. Schedel, F.D.B.; Musilova, Z.; Indermaur, A.; Bitja-Nyom, A.R.; Salzburger, W.; Schliewen, U.K. Towards the phylogenetic placement of the enigmatic African genus Prolabeops Schultz, 1941. J. Fish Biol. 2022, 101, 1333–1342. [Google Scholar] [CrossRef]
  21. Baldwin, C.C.; Mounts, J.H.; Smith, D.G.; Weight, L.A. Genetic identification and color descriptions of early life-history stages of Belizean Phaeoptyx and Astrapogon (Teleostei: Apogonidae) with comments on identification of adult Phaeoptyx. Zootaxa 2009, 2008, 1–22. [Google Scholar] [CrossRef]
  22. Tamura, K.; Stecher, G.; Kumar, S. MEGA11: Molecular Evolutionary Genetics Analysis Version 11. Mol. Biol. Evol. 2021, 38, 3022–3027. [Google Scholar] [CrossRef]
  23. Bernt, M.; Donath, A.; Jühling, F.; Externbrink, F.; Florentz, C.; Fritzsch, G.; Pütz, J.; Middendorf, M.; Stadler, P.F. MITOS: Improved de novo Metazoan Mitochondrial Genome Annotation. Mol. Phylogenet. Evol. 2013, 69, 313–319. [Google Scholar] [CrossRef] [PubMed]
  24. Perna, N.T.; Kocher, T.D. Patterns of nucleotide composition at fourfold degenerate sites of animal mitochondrial genomes. J. Mol. Evol. 1995, 41, 353–359. [Google Scholar] [CrossRef]
  25. Laslett, D.; Canbäck, B. ARWEN, a program to detect tRNA genes in metazoan mitochondrial nucleotide sequences. Bioinformatics 2008, 24, 172–175. [Google Scholar] [CrossRef] [Green Version]
  26. Lowe, T.M.; Chan, P.P. tRNAscan-SE On-line: Integrating search and context for analysis of transfer RNA genes. Nucleic Acids Res. 2016, 44, W54–W57. [Google Scholar] [CrossRef]
  27. Thompson, J.D.; Gibson, T.J.; Plewniak, F.; Jeanmougin, F.; Higgins, D.G. The CLUSTAL_X windows interface: Flexible strategies for multiple sequence alignment aided by quality analysis tools. Nucleic Acids Res. 1997, 25, 4876–4882. [Google Scholar] [CrossRef] [PubMed] [Green Version]
  28. Benson, G. Tandem repeats finder: A program to analyze DNA sequences. Nucleic Acids Res. 1999, 27, 573–580. [Google Scholar] [CrossRef] [PubMed] [Green Version]
  29. Vences, M.; Miralles, A.; Brouillet, S.; Ducasse, J.; Fedosov, A.; Kharchev, V.; Kostadinov, I.; Kumari, S.; Patmanidis, S.; Scherz, M.D.; et al. iTaxoTools 0.1: Kickstarting a specimen-based software toolkit for taxonomists. Megataxa 2021, 6, 77–92. [Google Scholar] [CrossRef]
  30. Lanfear, R.; Frandsen, P.B.; Wright, A.M.; Senfeld, T.; Calcott, B. PartitionFinder 2: New Methods for Selecting Partitioned Models of Evolution for Molecular and Morphological Phylogenetic Analyses. Mol. Biol. Evol. 2016, 34, 772–773. [Google Scholar] [CrossRef] [Green Version]
  31. Miller, M.A.; Schwartz, T.; Pickett, B.E.; He, S.; Klem, E.B.; Scheuermann, R.H.; Passarotti, M.; Kaufman, S.; O’Leary, M.A. A RESTful API for Access to Phylogenetic Tools via the CIPRES Science Gateway. Evol. Bioinform. 2015, 11, 43–48. [Google Scholar] [CrossRef]
  32. Ronquist, F.; Huelsenbeck, J.P. MrBayes 3: Bayesian phylogenetic inference under mixed models. Bioinformatics 2003, 19, 1572–1574. [Google Scholar] [CrossRef] [Green Version]
  33. Letunic, I.; Bork, P. Interactive Tree of Life (iTOL): An online tool for phylogenetic tree display and annotation. Bioinformatics 2007, 23, 127–128. [Google Scholar] [CrossRef] [PubMed]
  34. Kundu, S.; Kumar, V.; Tyagi, K.; Chandra, K. The complete mitochondrial genome of the endangered Assam Roofed Turtle, Pangshura sylhetensis (Testudines: Geoemydidae): Genomic features and phylogeny. PLoS ONE 2020, 15, e0225233. [Google Scholar] [CrossRef] [PubMed] [Green Version]
  35. Kundu, S.; Alam, I.; Maheswaran, G.; Tyagi, K.; Kumar, V. Complete Mitochondrial Genome of Great Frigatebird (Fregata minor): Phylogenetic Position and Gene Rearrangement. Biochem. Genet. 2022, 60, 1177–1188. [Google Scholar] [CrossRef] [PubMed]
  36. da Fonseca, R.R.; Johnson, W.E.; O’Brien, S.J.; Ramos, M.J.; Antunes, A. The adaptive evolution of the mammalian mitochondrial genome. BMC Genom. 2008, 9, 119. [Google Scholar] [CrossRef] [Green Version]
  37. Ojala, D.; Montoya, J.; Attardi, G. tRNA punctuation model of RNA processing in human mitochondria. Nature 1981, 290, 470–474. [Google Scholar] [CrossRef] [PubMed]
  38. Foote, A.D.; Morin, P.A.; Durban, J.W.; Pitman, R.L.; Wade, P.; Willerslev, E.; Gilbert, M.T.; da Fonseca, R.R. Positive selection on the killer whale mitogenome. Biol. Lett. 2011, 7, 116–118. [Google Scholar] [CrossRef] [Green Version]
  39. Garvin, M.R.; Bielawski, J.P.; Gharrett, A.J. Positive Darwinian selection in the piston that powers proton pumps in complex I of the mitochondria of Pacific salmon. PLoS ONE 2011, 6, e24127. [Google Scholar] [CrossRef] [Green Version]
  40. Hill, J.; Enbody, E.D.; Pettersson, M.E.; Sprehn, C.G.; Bekkevold, D.; Folkvord, A.; Laikre, L.; Kleinau, G.; Scheerer, P.; Andersson, L. Recurrent convergent evolution at amino acid residue 261 in fish rhodopsin. Proc. Natl. Acad. Sci. USA 2019, 116, 18473–18478. [Google Scholar] [CrossRef] [Green Version]
  41. Sato, N.S.; Hirabayashi, N.; Agmon, I.; Yonath, A.; Suzuki, T. Comprehensive genetic selection revealed essential bases in the peptidyl-transferase center. Proc. Natl. Acad. Sci. USA 2006, 103, 15386–15391. [Google Scholar] [CrossRef] [Green Version]
  42. Varani, G.; McClain, W.H. The G-U wobble base pair: A fundamental building block of RNA structure crucial to RNA function in diverse biological systems. EMBO Rep. 2000, 1, 18–23. [Google Scholar] [CrossRef]
  43. Wang, L.; Zhou, X.; Nie, L. Organization and variation of mitochondrial DNA control region inpleurodiran turtles. Zoologia 2011, 28, 495–504. [Google Scholar] [CrossRef]
  44. Lee, W.J.; Conroy, J.; Howell, W.H.; Kocher, T.D. Structure and evolution of teleost mitochondrial control regions. J. Mol. Evol. 1995, 41, 54–66. [Google Scholar] [CrossRef] [PubMed]
  45. Weijers, J.W.H.; Schefuß, E.; Stouten, S.; Damasté, J.S.S. Coupled thermal and hydrological evolution of tropical Africa over the last glaciation. Science 2007, 315, 1701–1704. [Google Scholar] [CrossRef] [PubMed] [Green Version]
  46. Abell, R.; Thieme, M.L.; Revenga, C.; Bryer, M.; Kottelat, M.; Bogutskaya, N.; Coad, B.; Mandrak, N.; Balderas, S.C.; Bussing, W.; et al. Freshwater ecoregions of the world: A new map of biogeographic units for freshwater biodiversity conservation. BioScience 2008, 58, 403–414. [Google Scholar] [CrossRef] [Green Version]
  47. Elmer, K.R.; Reggio, C.; Wirth, T.; Verheyen, E.; Salzburger, W.; Meyer, A. Pleistocene desiccation in East Africa bottlenecked but did not extirpate the adaptive radiation of Lake Victoria haplochromine cichlid fishes. Proc. Natl. Acad. Sci. USA 2009, 106, 13404–13409. [Google Scholar] [CrossRef] [Green Version]
  48. O’Reilly, C.; Alin, S.; Plisnier, P.; Cohen, A.; McKee, B. Climate change decreases aquatic ecosystem productivity of Lake Tanganyika, Africa. Nature 2003, 424, 766–768. [Google Scholar] [CrossRef]
  49. Butchart, S.H.M.; Walpole, M.; Collen, B.; van Strien, A.; Scharlemann, J.P.W.; Almond, R.E.A.; Baillie, J.E.M.; Bomhard, B.; Brown, C.; Bruno, J.; et al. Global biodiversity: Indicators of recent declines. Science 2010, 328, 1164–1168. [Google Scholar] [CrossRef]
  50. Nyboer, E.A.; Liang, C.; Chapman, L.J. Assessing the vulnerability of Africa’s freshwater fishes to climate change: A continent-wide trait-based analysis. Biol. Conserv. 2019, 236, 505–520. [Google Scholar] [CrossRef]
Figure 1. Map showing the IUCN range distribution and collection locality of Enteromius thysi from Cameroon.
Fishes 08 00025 g001
Figure 2. The mitochondrial genome of E. thysi drawn by the MitoAnnotator online server (http://mitofish.aori.u-tokyo.ac.jp/annotation/input/).
Fishes 08 00025 g002
Figure 3. Structural variation of different domains of Enteromius control regions. The start and stop position of the different conserved domains are marked by red arrows. The variable regions are marked in yellow, and parsimony-informative sites are marked by green boxes.
Fishes 08 00025 g003
Figure 4. Bayesian phylogeny based on the concatenated nucleotide sequences of 13 PCGs shows the phylogenetic relationship of E. thysi with other Enteromius species. The posterior probabilities are superimposed with each node. The distribution pattern of Enteromius species in different riverine systems is marked by green and pink shades on the map, as well as in each node. LC = least concern; EN = endangered.
Fishes 08 00025 g004
Table 1. List of annotated mitochondrial genes of Enteromius thysi.
GeneStartEndStrandSize (bp)IntergenicAnticodonStart CodonStop Codon
tRNA-Phe (F)169+69.GAA..
12S rRNA701026+957....
tRNA-Val (V)10271098+72.TAC..
16S rRNA10992792+1694....
tRNA-Leu (L2)27932868+761TAA..
NAD128703844+9755.ATGTAA
tRNA-Ile (I)38503921+72−2GAT..
tRNA-Gln (Q)39203990711TTG..
tRNA-Met (M)39924061+70.CAT..
NAD240625107+1046..ATGTA-
tRNA-Trp (W)51085178+712TCA..
tRNA-Ala (A)51815249691TGC..
tRNA-Asn (N)525153237333GTT..
tRNA-Cys (C)5357542367−1GCA..
tRNA-Tyr (Y)54235493711GTA..
COI54957045+1551..GTGTAA
tRNA-Ser (S2)70467120751TGA..
tRNA-Asp (D)71227193+726GTC..
COII72007887+688..ATGT--
tRNA-Lys (K)78887963+761TTT..
ATP879658129+165−7.ATGTAA
ATP681238805+683..ATGTA-
COIII88069590+785..ATGTA-
tRNA-Gly (G)95919662+72.TCC..
NAD3966310,011+349..ATGT--
tRNA-Arg (R)10,01210,081+70.TCG..
NAD4L10,08210,378+297−7.ATGTAA
NAD410,37211,752+1381..ATGT--
tRNA-His (H)11,75311,821+6910GTG..
tRNA-Ser (S1)11,83211,889+582GCT..
tRNA-Leu (L1)11,89211,964+733TAG..
NAD511,96813,791+1824−4.ATGTAA
NAD613,78814,309522..ATGTAA
tRNA-Glu (E)14,31014,378695TTC..
Cyt b14,38415,520+11373.ATGTAA
tRNA-Thr (T)15,52415,595+72−1TGT..
tRNA-Pro (P)15,59515,66571.TGG..
Control region15,66616,688+1023....
Disclaimer/Publisher’s Note: The statements, opinions and data contained in all publications are solely those of the individual author(s) and contributor(s) and not of MDPI and/or the editor(s). MDPI and/or the editor(s) disclaim responsibility for any injury to people or property resulting from any ideas, methods, instructions or products referred to in the content.

