
Quality Evaluation of Kohaku Koi (Cyprinus rubrofuscus) Using Image Analysis


1
Graduate School of Science and Technology, Niigata University, Niigata 950-2181, Japan
2
Institute of Science and Technology, Niigata University, Niigata 950-2181, Japan
*
Authors to whom correspondence should be addressed.
Fishes 2022, 7(4), 158; https://doi.org/10.3390/fishes7040158
Submission received: 10 June 2022
/
Revised: 26 June 2022
/
Accepted: 28 June 2022
/
Published: 29 June 2022
Abstract
:Quality evaluation of koi (Cyprinus rubrofuscus) is essential to the koi industry. However, the community has a lack of knowledge about the quality evaluation of koi and about features of koi which are valuable. During the “All Japan Nishikigoi Show” competition, a quality evaluation of koi was conducted by authoritative experts. In the present study, photos of participants of this competition were used for analysis to discover features affecting the quality of the Kohaku variety of koi. The HSVA color model was used to define and extract from image red and pale red coverage rates in Kohaku body coloration. Body aspect ratio, body proportions, red coverage rate, and pale red coverage rate were extracted using tools written in Python programming language. Analyses of the extracted data revealed the significant impact body aspect ratio (p < 0.001) and pale red coverage rate (p < 0.001) on Kohaku quality. A low body aspect ratio has a positive impact on Kohaku quality, while a high pale red coverage rate has a very strong negative impact on Kohaku quality. This study and its results can be an important foundation for further research about koi quality.
1. Introduction
Nishikigoi hereinafter referred to as koi (Cyprinus rubrofuscus) is a world-famous ornamental variety of domesticated carp [1,2]. Koi originated in Japan in Niigata Prefecture as an ornamental fish after many generations of selective breeding [3]. The main feature of koi is its striking coloration patterns [4]. Scale colors and color distribution patterns can vary greatly between koi varieties, and the patterns are almost unique and almost impossible to repeat between two individuals. The average lifespan of koi is 50 years [5]. Due to the nature of breeding, the number of varieties of koi is difficult to determine because the sources suggest different numbers [6,7].
Currently, the ZNA (Zen Nippon Airinkai; worldwide koi organization) defines 16 basic varieties of koi [8]. Koi began their journey to world fame after the first exhibition in Tokyo in 1914, where farmers from Yamakoshi village, Niigata Prefecture, introduced their best koi in the garden of the Imperial Palace [9]. The popularity of the Koi eventually spread throughout the world. Now, there are koi clubs and associations in Japan and many other countries [10]. Koi exhibitions are held, such as the “All Japan Nishikgoi Show”, organized by All Japan Nishikigoi Promotion Association, where koi experts evaluate the carps, choosing the best ones in each variety [11,12]. Winners of these shows become very valuable in price, and connoisseurs are willing to pay hundreds of thousands of dollars for such individuals [13]. Despite the popularity and distribution of koi around the world, the koi evaluation criteria remain little formalized. Known criteria include body conformation (symmetrical and plumper bodies are preferred), purity of color, brightness, durability, and pleasing distribution. Highly valued characteristics can increase the value of a koi. Swimming style is also important [6]. Judges use a 100-point system, where body shape and color account for 50% and 20%, respectively, whereas color pattern, gracefulness, and dignity account for 10% each [14,15]. However, the exact method of koi scoring is unknown to the community. This lack of knowledge indicates that research on the koi evaluation process can help koi breeders with selecting and crossbreeding to produce high-quality koi. Formalization of methods for koi evaluation can provide interesting and useful information for koi enthusiasts and can lead to koi popularization and industry growth.
Between 1818 and 1843, the first white-colored carp with red markings (Kohaku) was crossbred in Japan [16,17]. Currently, Kohaku is one of the most popular varieties of koi in the world [18]. Kohaku carps have a white body with red markings all over the body. They represent one of the bestselling koi on the market.
Image analysis is used to solve different problems, such as counting the number of fish in a pool, defining fish age, or classifying fish [19,20,21]. By using image analysis to process photos containing useful data, complex problems can be solved. Kohaku coloration is an important factor influencing fish quality, and image analysis is an appropriate method to obtain results that could explain the effect of features on Kohaku quality.
The present research aimed to analyze certain features of kohaku koi on the basis of photos collected during the annual “All Japan Nishikgoi Show” competition, which may be useful in evaluating the quality of Kohaku koi. Statistically significant features of Kohaku were identified, and their possible effects on Kohaku quality were determined.
2. Materials and Methods
2.1. Materials
In the present study, photos of koi variety Kohaku collected over several years of the “All Japan Nishikgoi Show” were used as data for analysis. The photos were taken by professional photographers using a professional camera mostly from the same angle, with the same lighting and same background. The koi shown in the photos were predominantly in a straight body position. Along with each photo, information about the placing of each Kohaku in the competition was used as additional data. There are four possible places in the competition (first to fourth). Because there were not many photos, they were divided into two groups: winners and losers. The Kohaku that occupied first place in the competition were included in the winners group. The Kohaku that occupied places other than first were included in the losers group. As a result, the winners group included 73 photos, while the losers group included 308 photos. All photos were in Portable Network Graphics (PNG) format. The PNG format represents pixels using the RGBA color model, where the additional alpha channel represents transparency [22]. The photos were grouped into two classes: good-quality Kohaku and bad-quality Kohaku. Thus, useful information about the quality of Kohaku produced by experts was used to extract and analyze the features affecting the quality of Kohaku. No other authoritative data sources were found that could be useful in analyzing the quality of Kohaku.
2.2. Material Preparation
2.2.1. Photo Selection
Certain photos of kohaku in the losers group were found to be not suitable for analysis. Two reasons were used for declaring the photo inappropriate: non-straight posture of the body and poor image quality. The reasons for poor image quality were water glare, insufficient lighting, strong background reflection, and incorrect camera angle at the time of the picture. Some photo flaws could be corrected, whereas some could not, potentially negatively affecting the results of the study by creating some level of inaccuracy. Therefore, photos were carefully screened, and unsuitable photos were removed from the dataset to avoid the negative effects of photos for which flaws could not be corrected. After filtration the losers group contained 145 images and the winners group remained unchanged.
2.2.2. Photos Cropping
It is difficult to take a perfect photo of koi for the examination of body posture. In the present study, the perfect posture was defined where the koi’s body and caudal fin in the picture were in a straight position, and the pectoral fins were spread and symmetrical. Capturing koi in the perfect body posture is not difficult, but this is not the case for the fins. Koi’s fins are constantly in motion; thus, photographing them in the perfect posture is quite difficult. Among the photos, many photographed Kohaku had their pectoral fins in an asymmetrical posture.
In addition to the problem of asymmetry in the posture of the pectoral fins, the caudal fins are generally also in motion. Many photos had unwanted features such as bent or partially rotated caudal fins, which could not be accurately measured or used for the general color analysis. Fins in such a posture may increase the total body area of the koi and adversely affect the analysis results.
The number of images containing these problems was overwhelming. Due to the difficulty in the analysis of fins, their presence in the photograph could lead to uneven measurements, which would most likely lead to errors during analysis. Therefore, all images were cropped to remove all unnecessary parts of the photos, including pectoral and caudal fins. The caudal fin cutting line was located at the narrowest part of the tail where the fin grows. Lateral pectoral fin cutting lines were drawn to not affect the rest of the koi’s body.
2.2.3. Background Removal
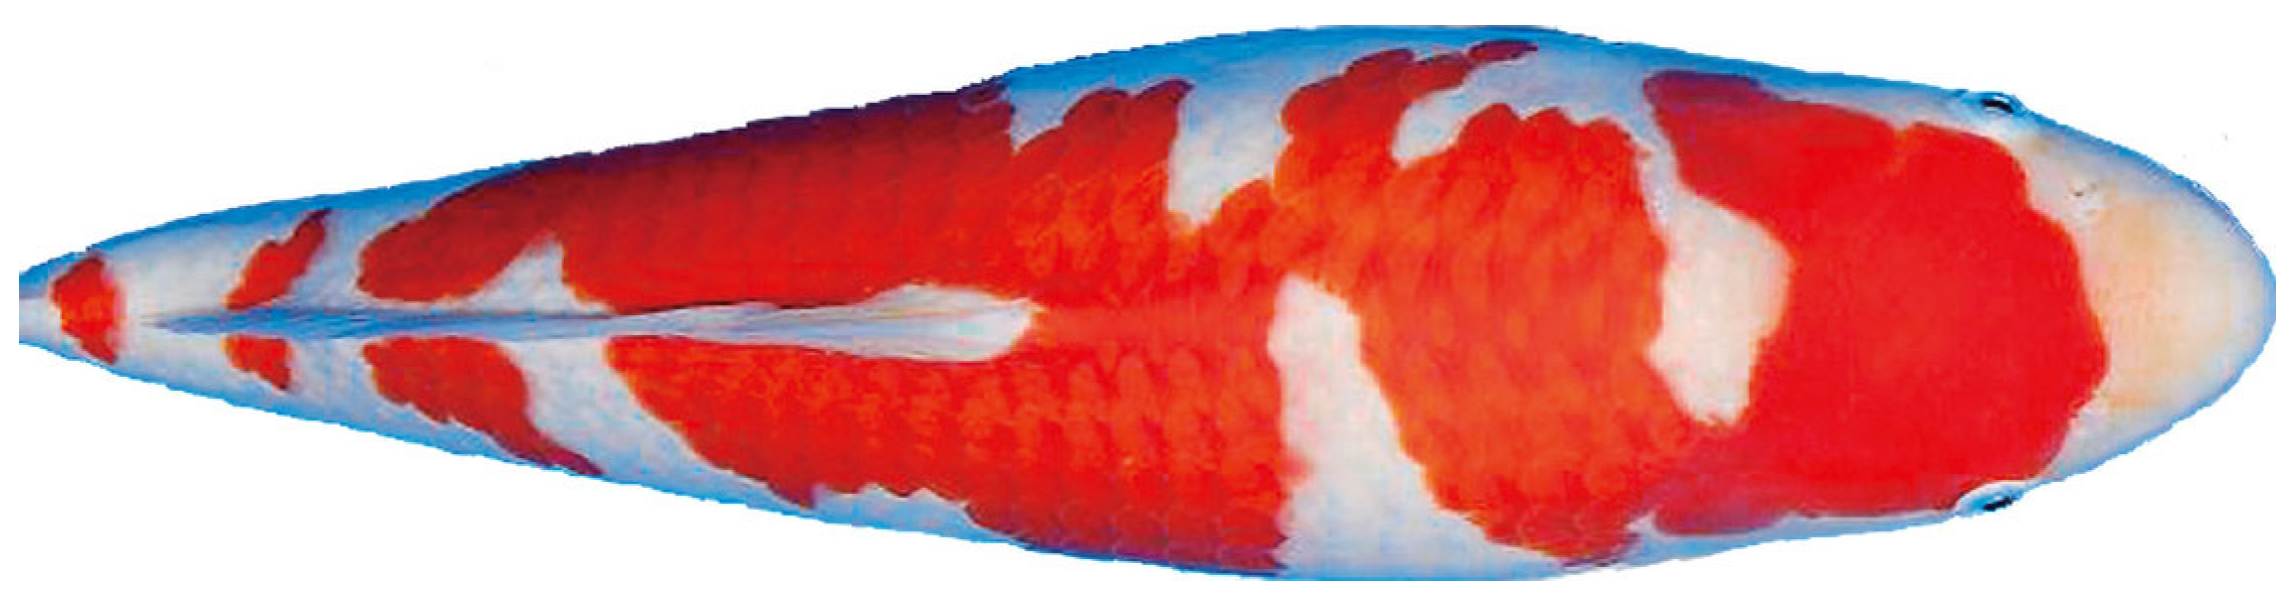
The next step in photo preparation was to remove the background of the photos and the remainder of the fins. The background of the photo and possible remaining parts of the pectoral fins, as well as the fins themselves, were removed for image analysis, so as to not affect the analysis accuracy. An example of cropping and background removal is shown in Figure 1.
All available photos selected for analysis were processed in this way. Adobe Photoshop was used in material preparation [23].
2.3. HSVA Color Model
In the present study, the HSVA (hue, saturation, value, alpha) color model was used. The following equations define the conversion from the RGBA (red, green, blue, alpha) color model to the HSVA color model [21,24,25,26]:
where the RGBA color model components are in the range [0, 1], and the HSVA color model components are defined in a partially normalized manner, where the H component is in the range [0, 360] and the S, V, A components are in the range [0, 1]. To avoid undefined values of the H component when Δ is equal to 0, it is necessary to assign some value to H. In the present study, the H component was assigned as 120 when Δ was equal to 0 because this value represents a pure green color which was typically not present in images, thus providing better analysis accuracy [26].
2.4. Feature Analysis
2.4.1. Body Aspect Ratio
The actual sizes of the koi in the images were unknown. Consequently, it was decided to use a relative value for analysis, which did not depend on the actual size of the koi’s body, but could nevertheless reflect the feature of the body structure, e.g., slimness. The aspect ratio of a body can be a relative value. Thanks to the preparation of the photos, especially cropping, the borders of the images bound the Kohaku bodies exactly as we needed. In the present study, all photos were rotated vertically, so that the tail of the koi pointed up and the head pointed down. Accordingly, the body aspect ratio (AR) was defined by the following equation:
where the image height and image width are measured in pixels. Using tools written Python programming language [27,28], the AR values were extracted from the images for an analysis of the impact of aspect ratio on Kohaku quality.
2.4.2. Body Proportions
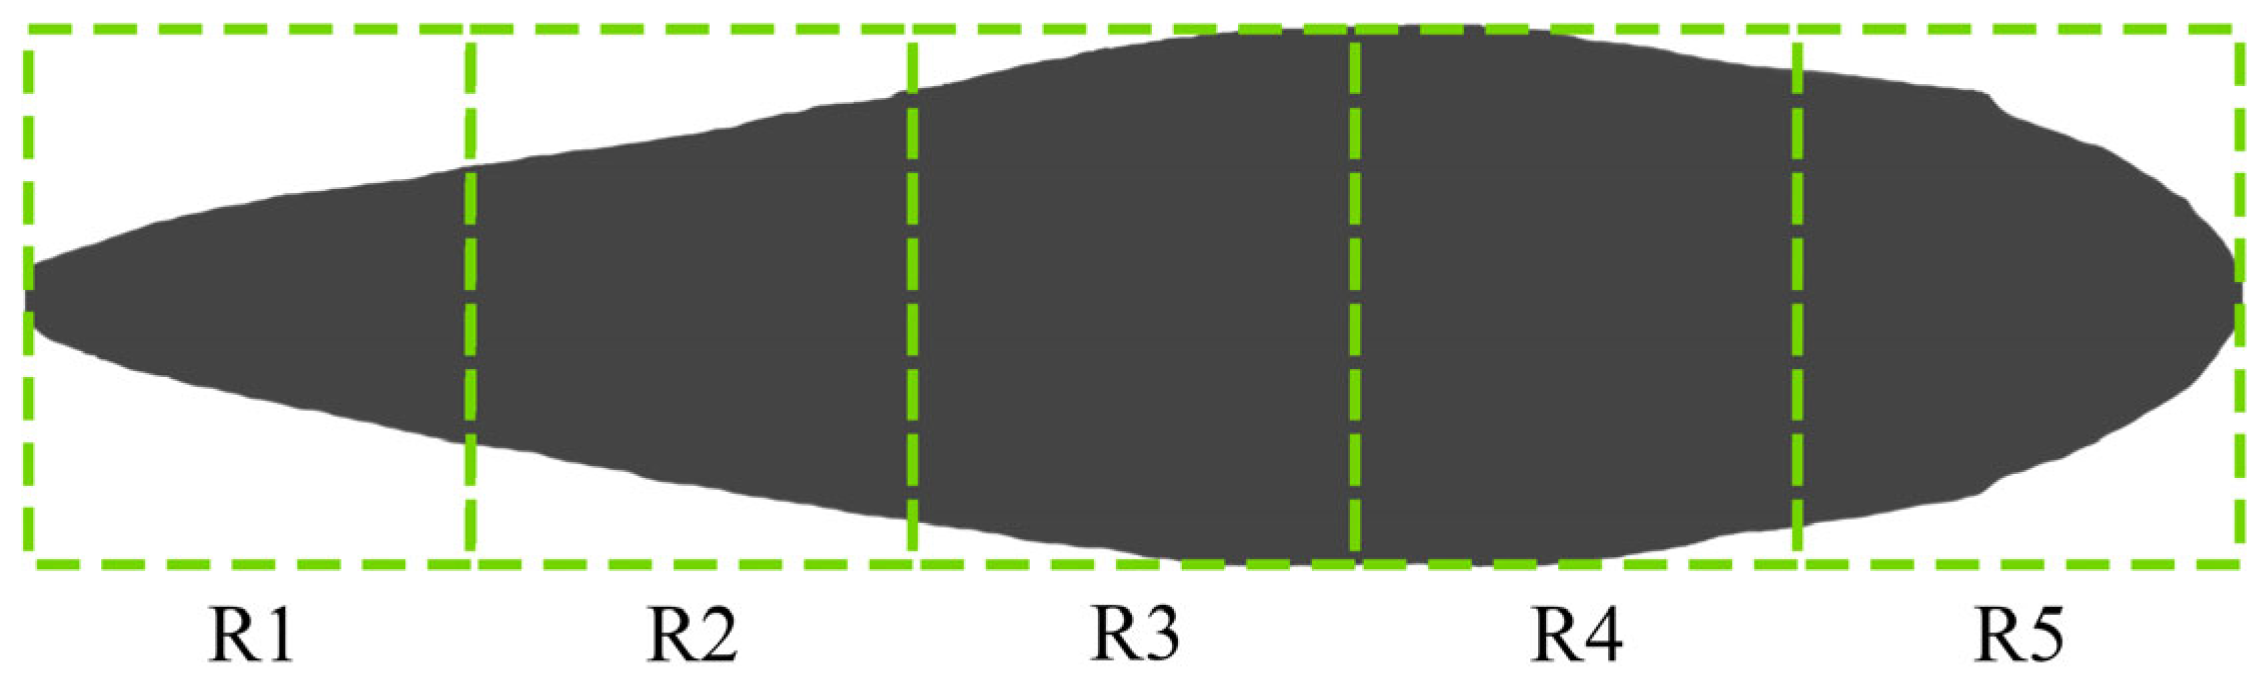
Body proportions of koi can vary widely; koi individuals can exhibit thickness in different parts of the body: closer to the head, closer to the center of the body, and sometimes even closer to the area of the center–tail transition [29]. It was necessary to analyze this feature of the koi’s body and how it affects the quality of the koi. Due to the lack of information about the actual sizes of the body, it was decided to analyze the relative values which can describe body proportions. For this purpose, five relative values for each koi image were used. Each image was divided into five equal rectangles (R1, R2, R3, R4, R5; R1…5) adjacent to each other along the body of the koi (Figure 2).
The bounds of the rectangles were used to calculate the areas of the body contained within the bounds. In our case, area was measured in number of pixels. Accordingly, the five body areas formed by the rectangles (R1…5) correspond to five values BA1…5 according to the following equation:
where p is a pixel in RGBA color space, and PA is the alpha component of a pixel. The obtained BA1…5 values are equal to the number of pixels contained in the R1…5 rectangles. Because images had different resolutions, and the actual sizes of the body were unknown, BA1…5 values could not be used directly for the analysis. For this reason, relative values (RBA1…5) were used, defined by the following equations:
where RBAj (%) is the relative body area bound by the Rj rectangle in the range [0, 100], and j = 1…5. In this way, relative values able to represent the body proportions of the koi were obtained. The RBA1…5 values were used for individual analysis.
2.4.3. Red Coverage Rate
Analysis of the kohaku coloration using the RGBA color model is difficult due to the difficulty in interpreting RGBA component values. Because it is easy to represent all colors of the rainbow using the H component and adjust saturation and brightness using the S and V components, respectively, the HSVA color model was used. Kohaku koi have two colors in their coloration: red and white. The red coverage rate in the coloration differs between individuals. The red coverage rates were analyzed because they may affect the quality of the Kohaku. Three groups of pixels were defined according to the following equations:
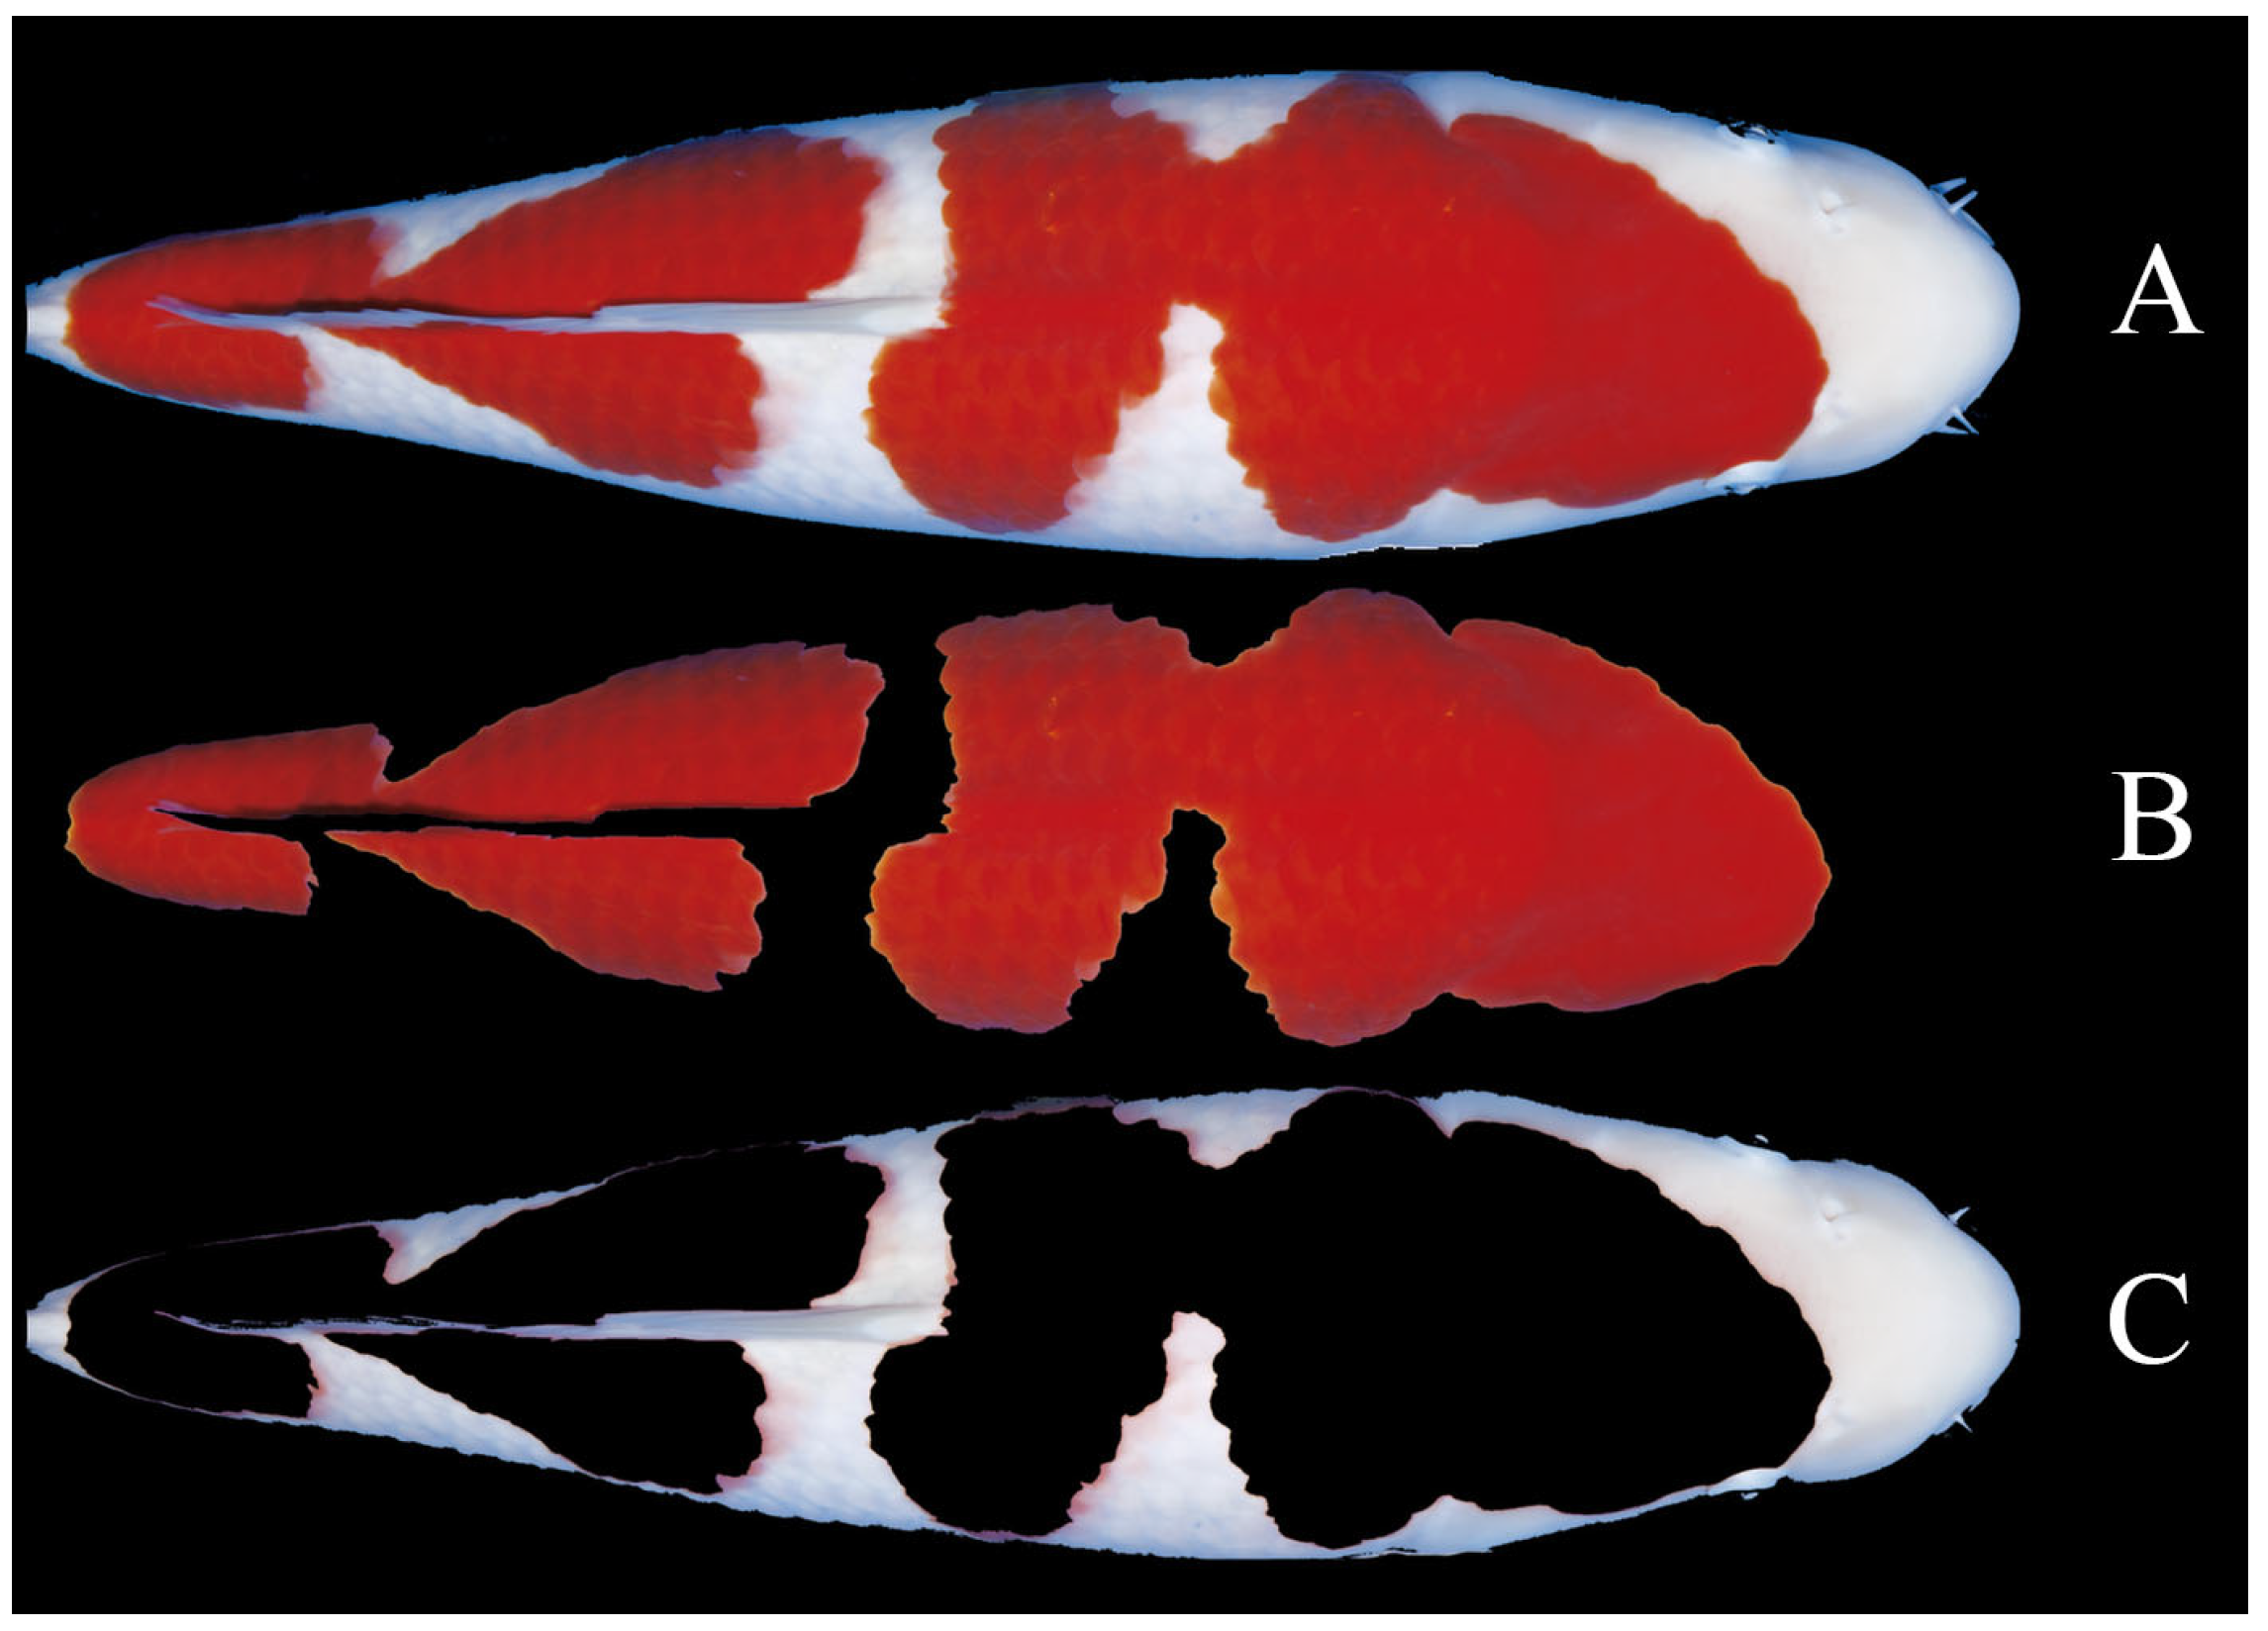
where p represents pixels in the HSVA color space, RP represents red pixels of body coloration, WP represents white pixels of body coloration, and BP represents all pixels of the body. Examples of color groups rendered separately shown in Figure 3.
Using the visualization shown as an example in Figure 3, the correctness of equations defining RP, WP, and BP groups was validated. To calculate the red coverage rate (RCR) the following equation was used:
where RCR (%) is in the range [0, 100]. The RCR values were calculated for all images using tools written in the Python programming language, we analyzed their effect on the Kohaku quality.
2.4.4. Pale Red Coverage Rate
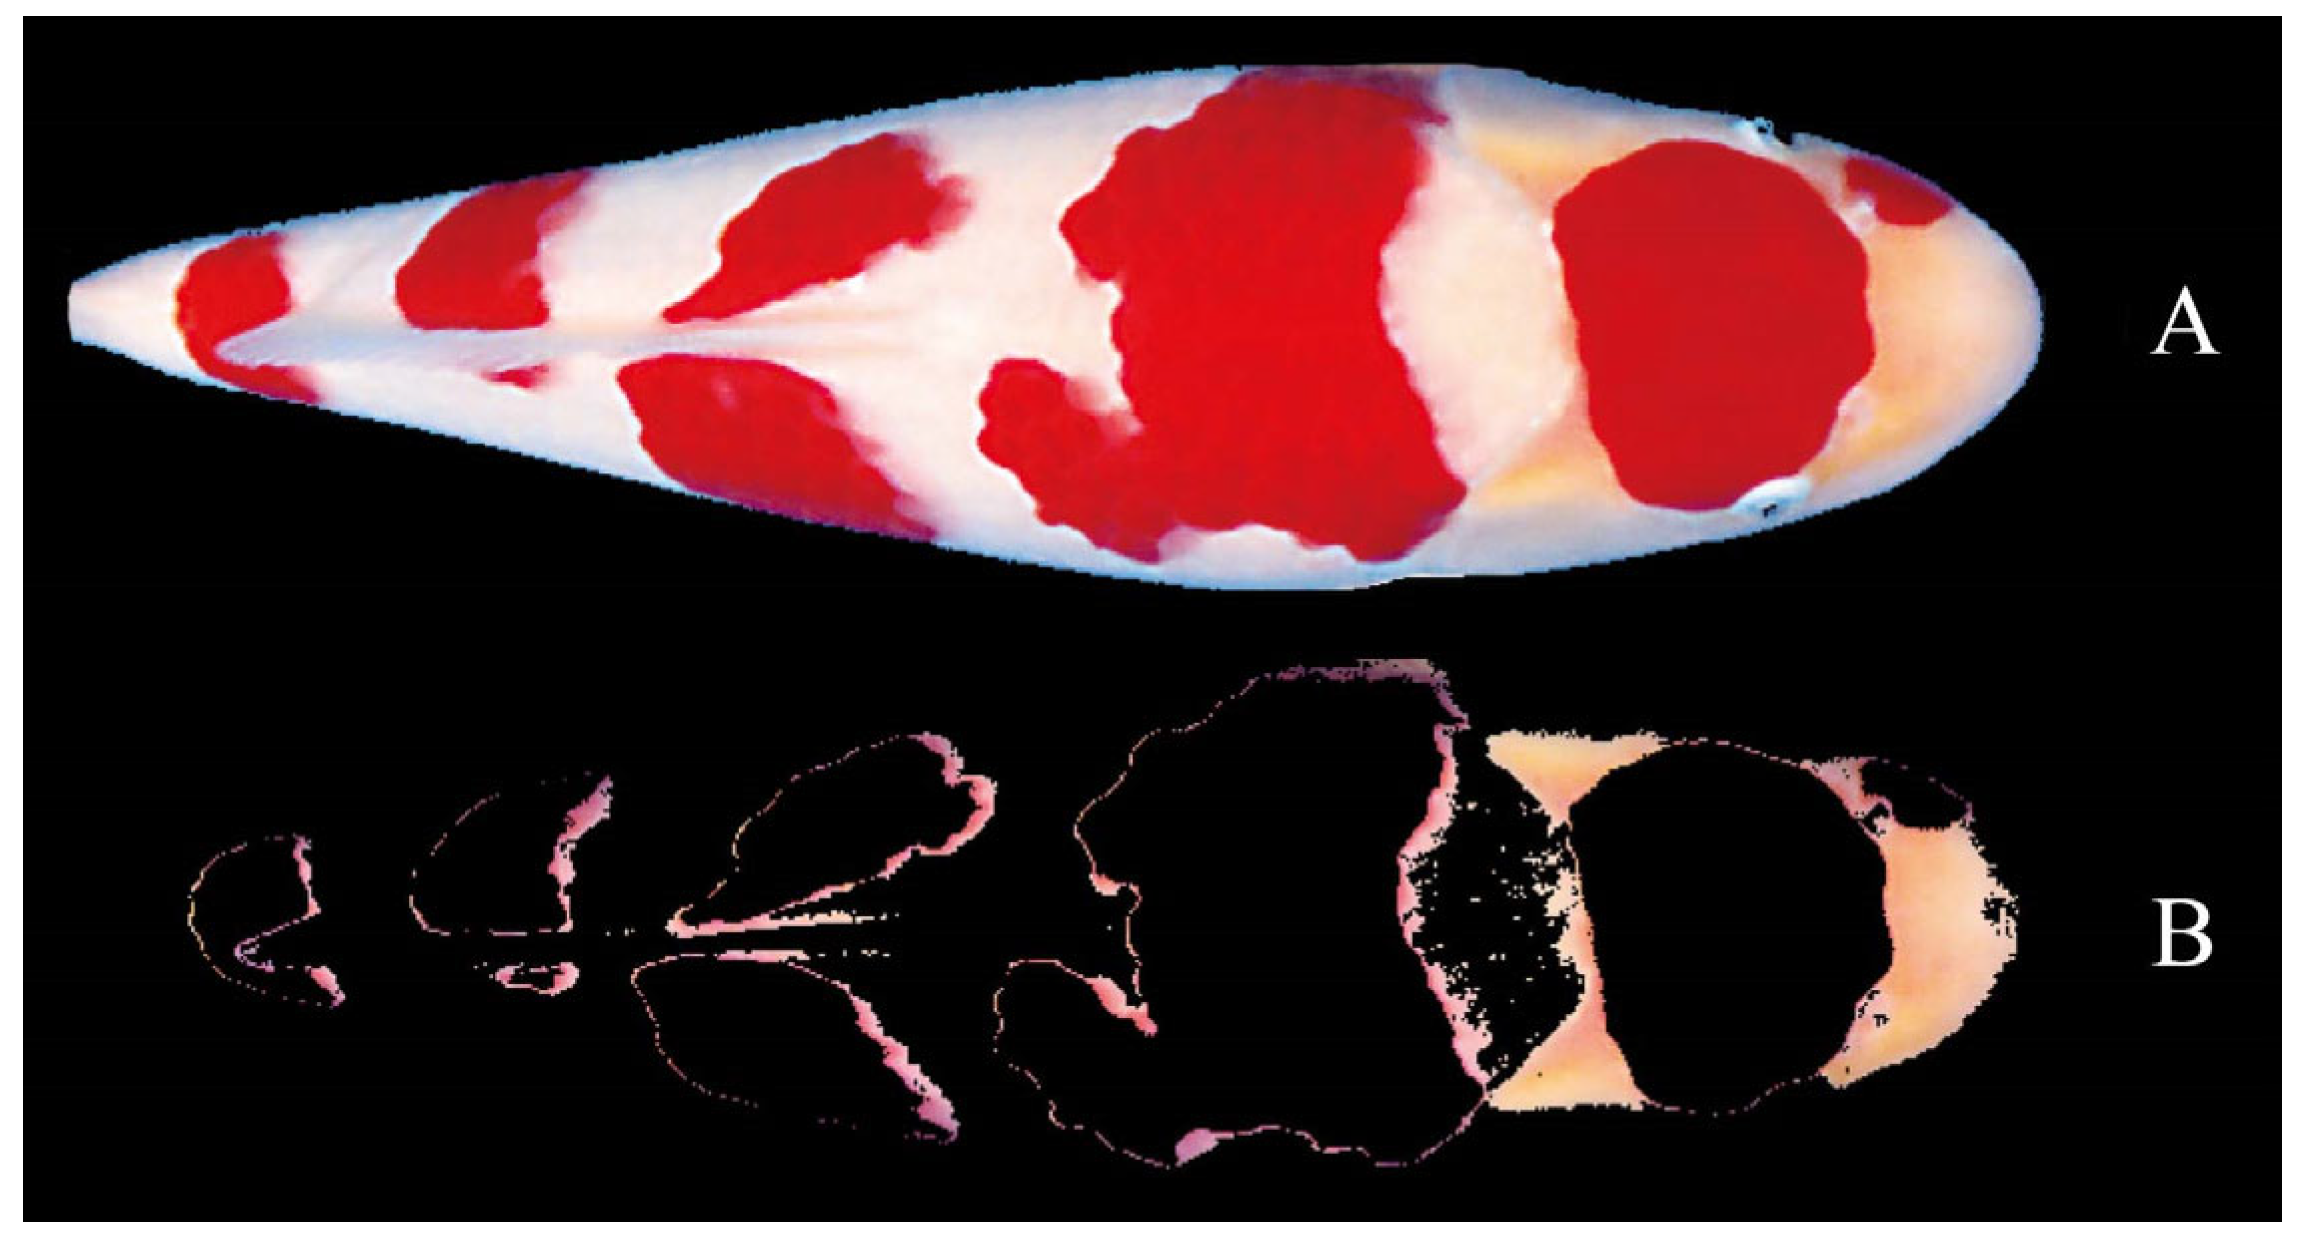
During visual inspection of the images, it was found that, very often, Kohaku from the losers group had pale red areas along the edges of the red spots or within some areas of white areas. It was assumed that the presence of a large amount of pale red color in the Kohaku coloration negatively affected the Kohaku quality. To analyze this assumption, the pale red coverage rate was calculated according to the following equations:
where p represents pixels in HSVA color space, PRP represents pale red pixels, and BP represents all pixels of the body. An example of groups rendered separately is shown in Figure 4.
Using the visualization shown in Figure 4, the correctness of equations defining PRP and BP groups was validated. To calculate the pale red coverage rate (PRCR), the following equation was used:
where PRCR (%) is in the range [0, 100]. The PRCR values were calculated for all images using tools written in the Python programming language, we analyzed their effect on the Kohaku quality.
2.5. Statistical Analysis
AR, RBA1…5, RCR, and PRCR values, calculated for all images, were individually subjected to one-way analysis of variance (ANOVA) using the R statistical software [30,31] to discover how the features they represent affected the Kohaku quality. Due to the lack of other available data, in the context of the present study, Kohaku belonging to the winners group were considered as high-quality Kohaku, and vice versa. The difference in means was considered statistically significant at p < 0.05.
Multiple linear regression was carried out to investigate the relationship between features affecting quality rate. The quality rate was an artificial value used for multiple linear regression to describe the Kohaku quality score. Individuals of the winners group had a quality rate value equal to 1, whereas individuals of the losers group had a value equal to 0. In this way, values close to 1 indicated good-quality Kohaku, whereas values close to 0 indicated poor-quality Kohaku. Multiple regression analysis was conducted using R statistical software.
3. Results
3.1. Body Aspect Ratio
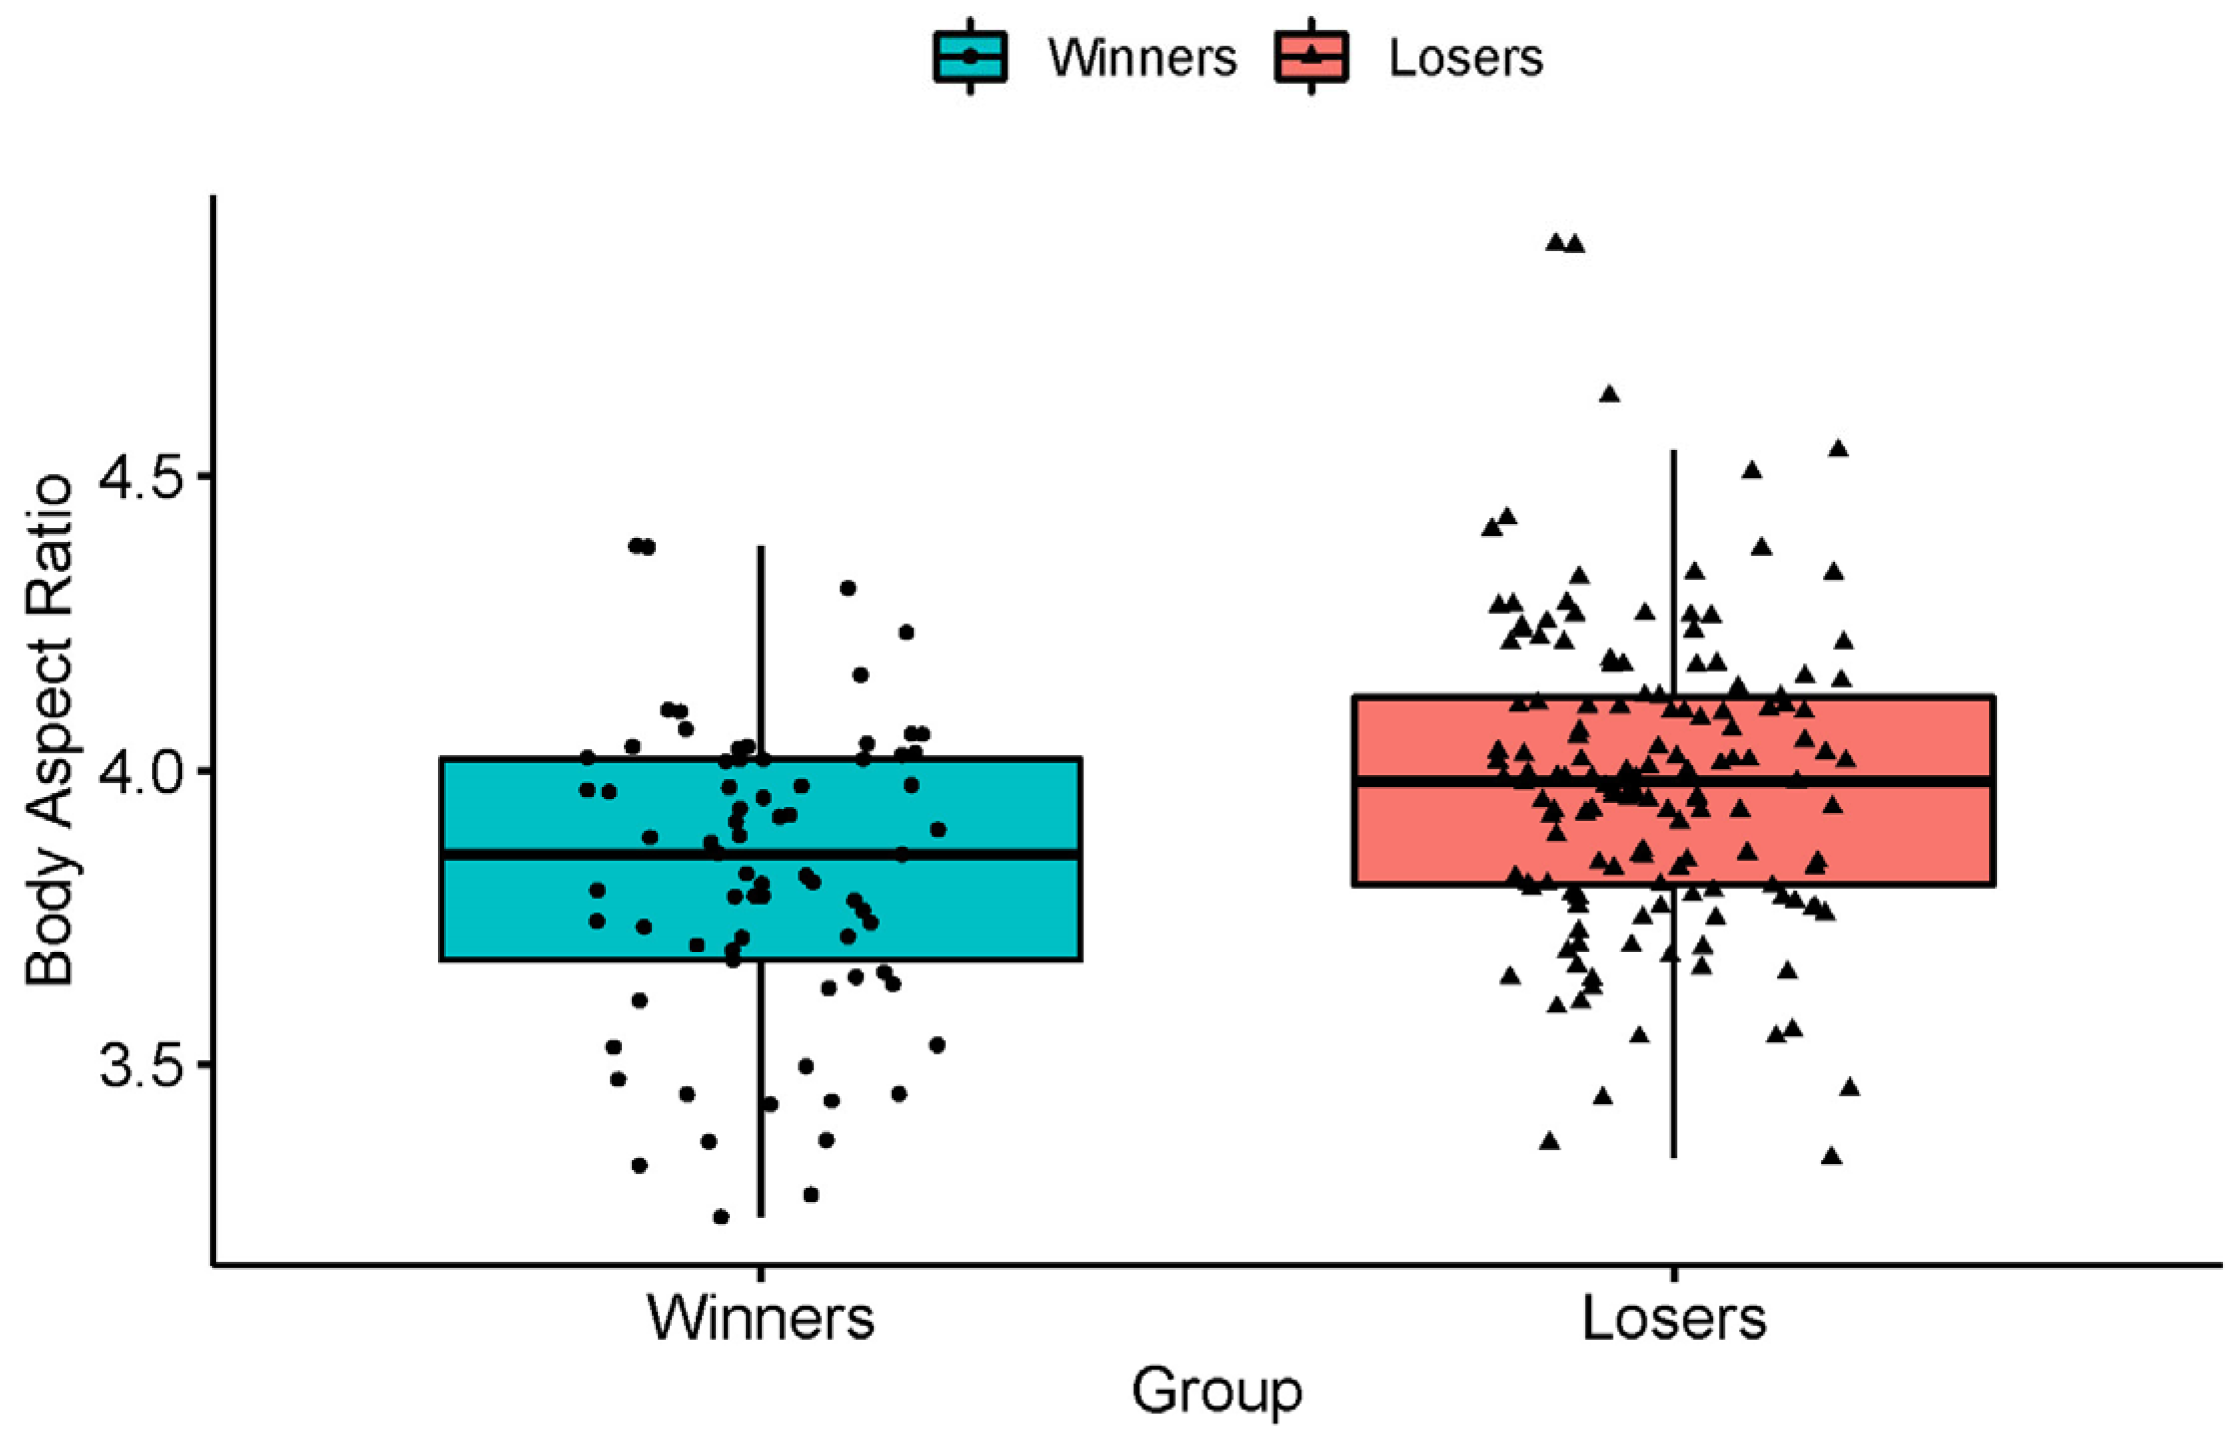
The average values of the body aspect ratio (AR) of winners and losers were 3.825 and 3.982, respectively. One-way analysis of variance (ANOVA) showed that the difference in the average ratio values was statistically significant (p < 0.001). The distribution of individuals within their groups is shown in Figure 5.
A higher aspect ratio value corresponded to Kohaku with a slenderer body shape, and vice versa. Therefore, the results showed that Kohaku with a massive body were considered to be of higher quality.
3.2. Body Proportions
The average values of RBA1…5 of the winners group and the losers group are shown in Table 1, where Δ is the absolute difference between the RBAi of the winners group and RBAi of the losers group.
The highest Δ value was equal to 0.1%, which means that the highest difference within averages did not exceed 0.1%. There was no significant difference between the winners group and the losers group; the p-values of RBA1…5 were following p = 0.61 > 0.05, p = 0.85 > 0.05, p = 0.89 > 0.05, p = 0.11 > 0.05, and p = 0.52 > 0.05 when i = 1–5, respectively. Therefore, no effect of body proportions on Kohaku quality was discovered.
3.3. Red Coverage Rate
The average values of the red coverage rate (RCR) of winners and losers were 60.4% and 58.4%, respectively. There was no statistically significant difference between groups (p = 0.062 > 0.05). Therefore, no effect of red coverage rate on Kohaku quality was discovered.
3.4. Pale Red Coverage Rate
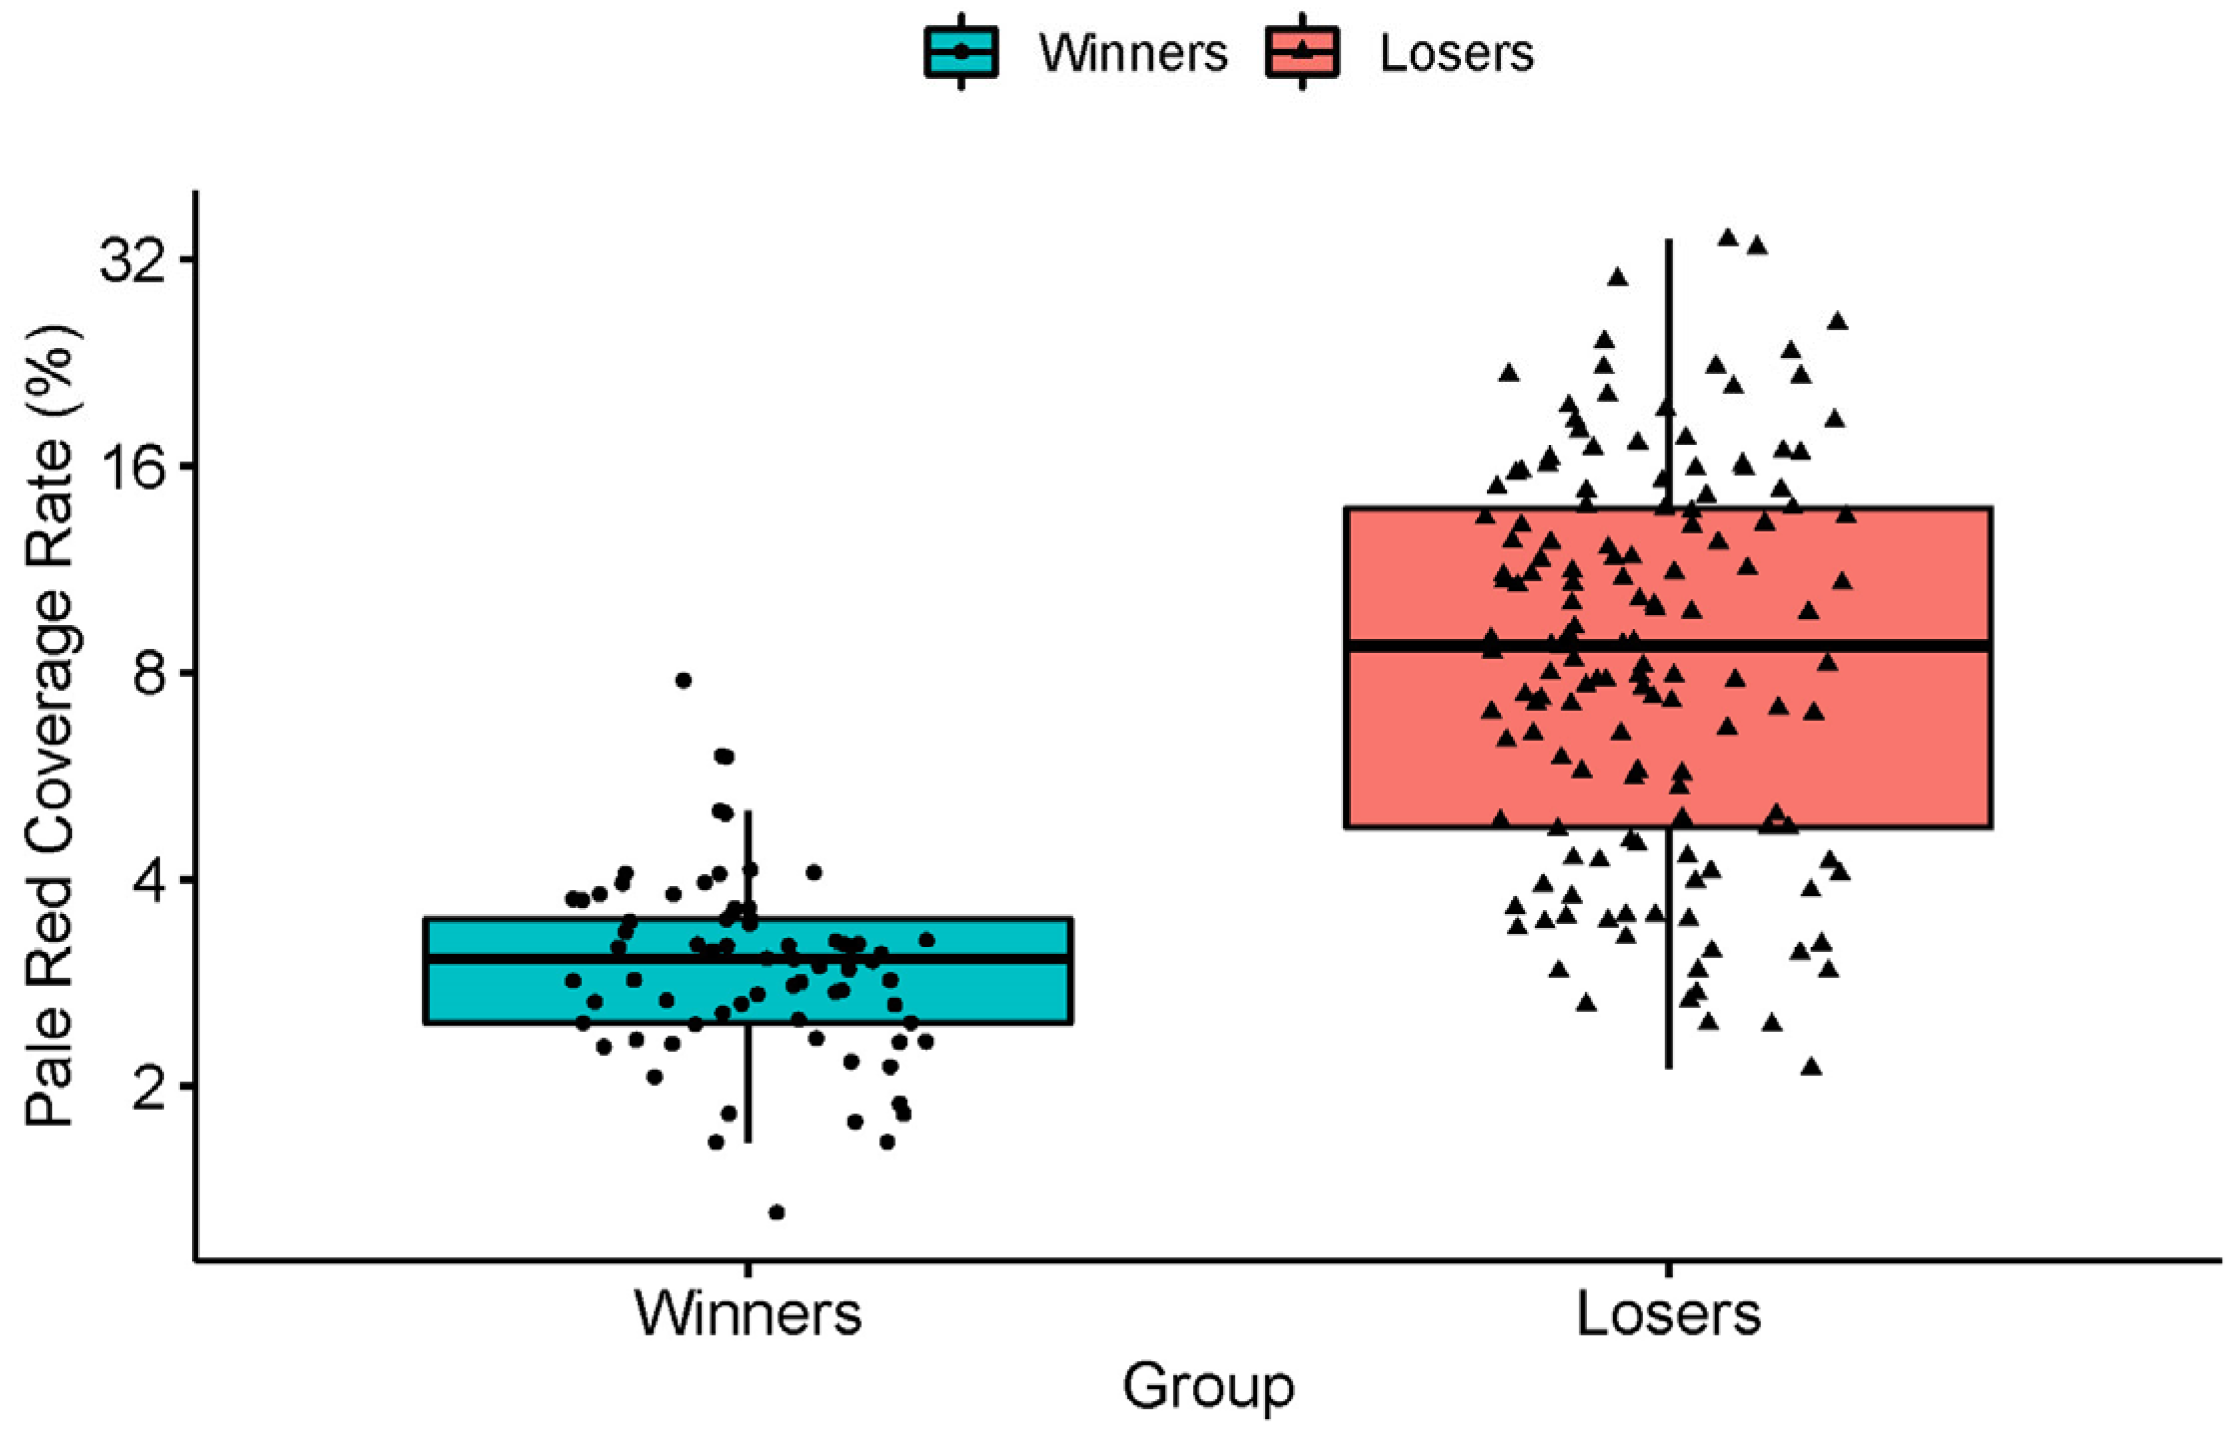
The average values of the pale red coverage rate (PRCR) of winners and losers were 3.14% and 10.23% respectively. One-way analysis of variance (ANOVA) showed that the difference in the average ratio values was statistically significant (p < 0.001). The distribution of individuals within their groups is shown in Figure 6.
Therefore, a high pale red coverage rate (PRCR) value corresponded to Kohaku of lower quality.
3.5. Multiple Linear Regression
Multiple linear regression was carried out to investigate the relationships among body aspect ratio, pale red coverage rate, and quality rate. There was a significant relationship between body aspect ratio and quality rate (p < 0.05), as well as between pale red coverage rate and quality rate (p < 0.001). In terms of the body aspect ratio, there was a −0.236 (±0.105) decrease in the quality rate for each extra unit of aspect ratio. For the pale red coverage rate, the quality rate decreased by −0.037 (±0.004) for each extra percentage of coverage. According to these results, the pale red coverage rate was a more important feature than the body aspect ratio.
4. Discussion
The results of this study showed that some structural and color characteristics of koi positively or negatively affect the koi quality. For example, the body aspect ratio and the pale red coverage rate were found to have a direct effect on the quality of the Kohaku. Although there are many sources describing koi, there is no detailed information about the process of koi evaluation and how features such as body shape and color affect the quality of the koi. Thus, the results presented here provide a basis for future work on the evaluation of koi quality. In this section, several hypotheses regarding the results of this study are presented, and various directions for future research into koi body shape and coloration, as well as their impact on quality, are discussed.
4.1. Noisy Data
In the present study, photos that had the disadvantages described in the material preparation section were not used. Suitable photos were selected and processed to eliminate all issues, including imperfect koi body posture, water reflections, image noise, effect of color emission from surrounding objects on koi lighting, or human factors such as differences in camera angle and lighting. Photos that had minor problems, such as bent or twisted fins, were processed to address the imperfections. Photos that had more significant flaws that could affect the course of the study were excluded and not used in the analysis. Nevertheless, hidden shortcomings could have remained, which were difficult to detect by a person but capable of lowering the accuracy of the analysis. In the long term, the use of higher-quality photos as a material can improve the quality of the analysis. High color accuracy, soft lighting, information about the actual size of the koi, and information about the position and orientation of the camera at the time of shooting can all serve to improve the quality of the analysis.
4.2. Kohaku Features
In the present study, only some of the features of the Kohaku body shape and coloration were analyzed. Several of the analyzed features were found to have an impact on koi quality. There are probably other features that can be discovered and analyzed using photos. Over time, by discovering new features that can be analyzed and improving the available data on the features found, it will be possible to use more than two features together, and their impact can be used to fully evaluate the Kohaku quality and formalize the evaluation rules.
4.3. Image Restrictions
Photos are not able to fully convey information about the actual shape of the koi body, but only convey a view restricted by camera perspective. Using such images, it is problematic to analyze shape of koi body in three-dimensional space. Thus, there are limitations in analysis of the koi’s body shape, i.e., only a limited number of features in the two-dimensional space represented by images can be analyzed. New types of materials for analysis of koi may provide additional data about body shape, allowing for a more complex analysis and the possible discovery of new features with an impact on koi quality. An example of an improved approach to material collection would be the use of photogrammetry techniques to gain insight into the body structure of a koi in three-dimensional space by creating 3D models. These 3D models may represent the 3D shape of a koi body in detail compared with images [32,33,34]. This technique would allow for a detailed analysis of the body shape and perhaps the discovery of new valuable features affecting the quality of the koi. Further work is needed to explore these possibilities.
4.4. Prospects
As described briefly in the introduction, there is a lack of knowledge about koi quality evaluation in the community. It is not possible for a nonexpert to evaluate koi quality. Since koi are ornamental fish, quality is an important characteristic. The present and future studies will be useful for the community of koi enthusiasts around the world and for koi breeders. Thus, this research and additional work exploring the features of the body shape and coloration of koi can have a significant positive effect on the koi industry as a whole and can contribute to its development.
5. Conclusions
In the present study, the body shape features and coloration features of Kohaku koi were analyzed. We discovered and analyzed certain features to determine their importance for the quality of Kohaku. Kohaku with a rather massive body were found to be higher-quality individuals. The feature with the strongest influence on Kohaku quality was found to be the pale red coverage rate, with a high rate decreasing the quality of the koi, and vice versa. On the basis of this study, it is possible to perform similar analyses of the body shape and coloration for other koi varieties. Thus, this study sets an important foundation for further research on the features of the shape and coloration of koi. Additional work is needed to improve the methodology for collecting materials for analysis, to discover new features of the body shape and coloration of Kohaku, to improve analysis quality, and to study other varieties of koi and their features.
Author Contributions
Conceptualization, M.A.D. and H.H.; methodology, M.A.D. and T.Y.; software, M.A.D.; validation, M.A.D., T.Y. and H.H.; formal analysis, M.A.D.; investigation, M.A.D.; resources, H.H.; data curation, H.H.; writing—original draft preparation, M.A.D.; writing—review and editing, H.H. and T.Y.; visualization, M.A.D.; supervision, H.H.; project administration, H.H. All authors read and agreed to the published version of the manuscript.
Funding
This research received no external funding.
Institutional Review Board Statement
Not applicable.
Informed Consent Statement
Not applicable.
Data Availability Statement
The data presented in this study are available on request from the corresponding author. The data are not publicly available due to a confidential agreement.
Acknowledgments
We thank Shunzo Baba and Akihiro Segawa for providing materials for the present research, as well as Jun Fan for teaching us about koi evaluation principles.
Conflicts of Interest
The authors declare no conflict of interest.
References
- Daniel, W.M.; Morningstar, C.R.; Procopio, J. Cyprinus Rubrofuscus Lacepède, 1803: UAS Geological Survey; Nonindigenous Aquatic Species Database: Gainesville, FL, USA, 2000. [Google Scholar]
- Kottelat, M.; Freyhof, J. Handbook of European Freshwater Fishes; Publications Kottelat: Cornol, Switzerland, 2007; pp. 147–148. [Google Scholar]
- Balon, E.K. Origin and Domestication of the Wild Carp, Cyprinus Carpio: From Roman Gourmets to the Swimming Flowers. Aquaculture 1995, 129, 3–48. [Google Scholar] [CrossRef]
- Balon, E.K. The Common Carp, Cyprinus Carpio: Its Wild Origin, Domestication in Aquaculture, and Selection as Colored Nishikigoi. Univ. Guelph. Inst. Ichthyol. Dep. Zool. 1995, 3, 1–55. [Google Scholar]
- Lee, R. Essential Guide for Koi Fish Owner: How to Build and Maintain a Beautiful Koi Pond; Lulu Press: Morrisville, NC, USA, 2013; ISBN 9781304286277. [Google Scholar]
- Pietsch, C.; Hirsch, P. Biology and Ecology of Carp; CRC Press: Boca Raton, FL, USA, 2015; ISBN 9781482206647. [Google Scholar]
- Tetra Press Staff. The Tetra Encyclopedia of Koi; Tetra Press: Blacksburg, VA, USA, 1996; ISBN 1564651452. [Google Scholar]
- Zen Nippon Airinkai. The Varieties of Nishikigoi. Available online: http://zna.jp/eng/nishikigoi/variety/index.html (accessed on 4 May 2022).
- Fletcher, N. The Ultimate Koi; The Ultimate Series; Ringpress Books: Dorking, UK, 1999; ISBN 9781860541469. [Google Scholar]
- Koi Fish Organizations—Koi Mud Pond. Available online: http://www.koimudpond.com/koi-organizations.html (accessed on 4 May 2022).
- All Japan Nishikigoi Promotion Association. Available online: https://jnpa.info/koie1700.htm (accessed on 4 May 2022).
- De Kock, S.; Gomelsky, B. Japanese Ornamental Koi Carp: Origin, Variation and Genetics. In Biology and Ecology of Carp; CRC Press: Boca Raton, FL, USA, 2015; pp. 27–53. [Google Scholar]
- Pond Informer How Much Are Koi Fish Worth? Available online: https://pondinformer.com/how-much-are-koi-fish/ (accessed on 5 May 2022).
- De Kock, S.; Watt, R. Koi: A Handbook on Keeping Nishikigoi; Firefly Books: Richmond Hill, ON, Canada, 2006; ISBN 9781554072156. [Google Scholar]
- Hoshino, S.; Fujita, S. Nishikigoi Mondo; International Nishikigoi Promotion Centre, Ed.; NABA Corporation: Tokyo, Japan, 2009. [Google Scholar]
- Amano, M. Colourful “Live Jewels”. General Survey of Fancy Carp; Kojima Shoten Publ. Co.: Tokyo, Japan, 1968. [Google Scholar]
- Kuroki, T. The Latest Manual to Nishikigoi, 9th ed.; Shin Nippon Kyoiku Tosho Co.: Shimonoseki, Japan, 1990. [Google Scholar]
- Tamadachi, M. The Cult of the Koi; T.F.H. Publications: Neptune City, NJ, USA, 1994; ISBN 9780866224406. [Google Scholar]
- Politikos, D.V.; Sykiniotis, N.; Petasis, G.; Dedousis, P.; Ordoñez, A.; Vabø, R.; Anastasopoulou, A.; Moen, E.; Mytilineou, C.; Salberg, A.-B.; et al. DeepOtolith v1.0: An Open-Source AI Platform for Automating Fish Age Reading from Otolith or Scale Images. Fishes 2022, 7, 121. [Google Scholar] [CrossRef]
- Toh, Y.; Ng, T.; Liew, B. Automated fish counting using image processing. In Proceedings of the 2009 International Conference on Computational Intelligence and Software Engineering (CiSE2009), Wuhan, China, 11–13 December 2009; pp. 1–5. [Google Scholar]
- Kartika, D.S.Y.; Herumurti, D. Koi fish classification based on HSV color space. In Proceedings of the 2016 International Conference on Information & Communication Technology and Systems (ICTS), Surabaya, Indonesia, 12 October 2016; pp. 96–100. [Google Scholar]
- PNG (Portable Network Graphics) Specification Version 1.0. Available online: https://www.w3.org/TR/REC-png.pdf (accessed on 5 May 2022).
- Evening, M. Adobe Photoshop 2020 for Photographers; Routledge: Abingdon-on-Thames, UK, 2020; ISBN 0367346834. [Google Scholar]
- Chen, W.; Shi, Y.Q.; Xuan, G. Identifying Computer Graphics Using HSV Color Model and Statistical Moments of Characteristic Functions. In Proceedings of the 2007 IEEE International Conference on Multimedia and Expo, Beijing, China, 2–5 July 2007; pp. 1123–1126. [Google Scholar]
- Smith, A.R. Color Gamut Transform Pairs. ACM Siggraph Comput. Graph. 1978, 12, 12–19. [Google Scholar] [CrossRef]
- Chernov, V.; Alander, J.; Bochko, V. Integer-Based Accurate Conversion between RGB and HSV Color Spaces. Comput. Electr. Eng. 2015, 46, 328–337. [Google Scholar] [CrossRef]
- Guzdial, M.J.; Ericson, B. Introduction to Computing and Programming in Python; Pearson: New York, NY, USA, 2015; ISBN 0134025547. [Google Scholar]
- Johansson, R.; Johansson, R.; John, S. Numerical Python; Springer: Berlin/Heidelberg, Germany, 2019; Volume 1. [Google Scholar]
- Watson, C.A.; Hill, J.E.; Pouder, D.B. Species Profile: Koi and Goldfish; Southern Regional Aquaculture Center: Stoneville, MS, USA, 2004. [Google Scholar]
- James, G.; Witten, D.; Hastie, T.; Tibshirani, R. An Introduction to Statistical Learning; Springer: Berlin/Heidelberg, Germany, 2013; Volume 112. [Google Scholar]
- Wickham, H.; Grolemund, G. R for Data Science: Import, Tidy, Transform, Visualize, and Model Data; O’Reilly Media: Sebastopol, CA, USA, 2016; ISBN 1491910399. [Google Scholar]
- Alfio, V.S.; Costantino, D.; Pepe, M. Influence of Image TIFF Format and JPEG Compression Level in the Accuracy of the 3D Model and Quality of the Orthophoto in UAV Photogrammetry. J. Imaging 2020, 6, 30. [Google Scholar] [CrossRef] [PubMed]
- Lange, I.D.; Perry, C.T. A Quick, Easy and Non-invasive Method to Quantify Coral Growth Rates Using Photogrammetry and 3D Model Comparisons. Methods Ecol. Evol. 2020, 11, 714–726. [Google Scholar] [CrossRef]
- Pepe, M.; Costantino, D. Techniques, Tools, Platforms and Algorithms in Close Range Photogrammetry in Building 3D Model and 2D Representation of Objects and Complex Architectures. Comput. Aided Des. Appl. 2020, 18, 42–65. [Google Scholar] [CrossRef]
Figure 1.
Example of cropping and background removal. The blue hue in the image is the reflection of the background on the fish scales.
Figure 1.
Example of cropping and background removal. The blue hue in the image is the reflection of the background on the fish scales.

Figure 2.
Body division with rectangles (R1…5). The five green rectangles represent the division of the kohaku body into five equal parts along the body length.
Figure 2.
Body division with rectangles (R1…5). The five green rectangles represent the division of the kohaku body into five equal parts along the body length.

Figure 3.
An example of color groups rendered separately. The BP group (A) represents all body pixels, the RP group (B) represents red pixels in body coloration, and the WP group (C) represents white pixels in body coloration.
Figure 3.
An example of color groups rendered separately. The BP group (A) represents all body pixels, the RP group (B) represents red pixels in body coloration, and the WP group (C) represents white pixels in body coloration.

Figure 4.
An example of color groups rendered separately. The BP group (A) represents all body pixels, and the PRP group (B) represents pale red pixels in body coloration.
Figure 4.
An example of color groups rendered separately. The BP group (A) represents all body pixels, and the PRP group (B) represents pale red pixels in body coloration.

Figure 5.
Body aspect ratio distribution.

Figure 6.
Pale red coverage rate values distribution.


Table 1.
Averages of RBA1…5 values and their absolute differences (Δ) in percentage.
| RBAi | Winners (%) | Losers (%) | Δ (%) |
|---|---|---|---|
| RBA1 | 9.6 | 9.6 | 0 |
| RBA2 | 19 | 19 | 0 |
| RBA3 | 26.2 | 26.2 | 0 |
| RBA4 | 27.1 | 27.2 | 0.1 |
| RBA5 | 18.1 | 18 | 0.1 |
Publisher’s Note: MDPI stays neutral with regard to jurisdictional claims in published maps and institutional affiliations. |
© 2022 by the authors. Licensee MDPI, Basel, Switzerland. This article is an open access article distributed under the terms and conditions of the Creative Commons Attribution (CC BY) license (https://creativecommons.org/licenses/by/4.0/).
Share and Cite
MDPI and ACS Style
Domasevich, M.A.; Hasegawa, H.; Yamazaki, T. Quality Evaluation of Kohaku Koi (Cyprinus rubrofuscus) Using Image Analysis. Fishes 2022, 7, 158. https://doi.org/10.3390/fishes7040158
AMA Style
Domasevich MA, Hasegawa H, Yamazaki T. Quality Evaluation of Kohaku Koi (Cyprinus rubrofuscus) Using Image Analysis. Fishes. 2022; 7(4):158. https://doi.org/10.3390/fishes7040158
Chicago/Turabian StyleDomasevich, Mikhail A., Hideo Hasegawa, and Tatsuya Yamazaki. 2022. "Quality Evaluation of Kohaku Koi (Cyprinus rubrofuscus) Using Image Analysis" Fishes 7, no. 4: 158. https://doi.org/10.3390/fishes7040158