Article

A Rapid Method for the Identification of Fresh and Processed Pagellus erythrinus Species against Frauds

1
Department of Veterinary Medicine and Animal Production, University of Naples Federico II, via F. Delpino, n.1, 80137 Naples, Italy
2
Department of Biology and Evolution of Marine Organisms, Stazione Zoologica Anton Dohrn, Villa Comunale, 80121 Naples, Italy
3
Department of Research Infrastructures for Marine Biological Resources, Stazione Zoologica Anton Dohrn, Villa Comunale, 80121 Naples, Italy
4
Department Agricultural Sciences, University of Naples Federico II, via Università, n.100, Portici, 80055 Naples, Italy
*
Author to whom correspondence should be addressed.
Foods 2020, 9(10), 1397; https://doi.org/10.3390/foods9101397
Submission received: 16 September 2020 / Revised: 28 September 2020 / Accepted: 30 September 2020 / Published: 2 October 2020
(This article belongs to the Special Issue Species Authentication and Pathogen Identification in Seafood)

Abstract

:
The commercialization of porgies or seabreams of the family Sparidae has greatly increased in the last decade, and some valuable species have become subject to seafood substitution. DNA regions currently used for fish species identification in fresh and processed products belong to the mitochondrial (mt) genes cytochrome b (Cytb), cytochrome c oxidase I (COI), 16S and 12S. However, these markers amplify for fragments with lower divergence within and between some species, failing to provide informative barcodes. We adopted comparative mitogenomics, through the analysis of complete mtDNA sequences, as a compatible approach toward studying new barcoding markers. The intent is to develop a specific and rapid assay for the identification of the common pandora Pagellus erythrinus, a sparid species frequently subject to fraudulent replacement. The genetic diversity analysis (Hamming distance, p-genetic distance, gene-by-gene sequence variability) between 16 sparid mtDNA genomes highlighted the discriminating potential of a 291 bp NAD2 gene fragment. A pair of species-specific primers were successfully designed and tested by end-point and real-time PCR, achieving amplification only in P. erythrinus among several fish species. The use of the NAD2 barcoding marker provides a rapid presence/absence method for the identification of P. erythrinus.

Graphical Abstract

1. Introduction

Food frauds are considered a major safety, quality, and economic problem worldwide, with rising awareness and concern in consumers [1,2,3,4,5]. In Europe, mislabeling is responsible for 41.8% of food fraud violations and fish products have a central role in this scenario [6]. The International Food Safety Authorities Network (INFOSAN) recently pointed out that there is a common desire from all countries for more technical support regarding food frauds prevention and management [1]. Fish and fish products are the most subject to fraud in the European Union, with intentional mislabeling being the main type of violation [6]. The common pandora (Pagellus erythrinus Linnaeus, 1758) is one of the most commercially caught Sparidae species in the Mediterranean Sea and the Atlantic Ocean. The commercialization of P. erythrinus, deriving from fishing activity between 2006 and 2016, has expanded from 9.34 to 13.90 tonnes (+48.72%), while the aquaculture production has progressively dropped from 197.00 tonnes in 2006 to 0.04 in 2016 [7]. Most of the wild common pandora catches come from Mediterranean fishery grounds (12.25 tonnes), mainly in Italy, Libya, Spain, and Tunisia, with a small share from Atlantic countries (1.65 tonnes) such as Morocco [7]. Fish farm production of P. erythrinus was 127.27 tonnes in 2014 in Greece, and 0.23 tonnes in 2016 in Cyprus [8]. Owing to the increasing appreciation of European consumers, P. erythrinus is deplorably subject to replacement with less valuable species. Fraudulent substitution of the common pandora occurs not only when prepared and processed specimens have lost external characters but also as whole fish, due to the morphological resemblance with other sparid species (e.g., Pagellus acarne, Pagellus bellottii, Pagrus pagrus, Lutjanidae spp.) [9,10,11,12,13]. Currently, cytochrome b-Cytb, cytochrome c oxidase I-COI, 16S, and 12S genes of the mitochondrial (mt) DNA are traditionally used for fish species identification [14,15,16]. However, these universal barcodes are not always effective for unambiguous species authentication as well as for forensic approaches such as fraud detection [14,17,18]. The limitation of providing adequate resolution at deep nodes emerges especially when fish species have a high degree of genetic homology. Traditional markers are inadequate, especially when they amplify for fragments that differentiate species by point mutations [19]. We have recently shown that the analysis of the complete mtDNA (mitogenomics) provides a useful approach for identifying fast and adequate barcoding markers. In particular, our previous study showed that the NAD5 gene, compared to traditional markers, possesses a higher discrimination capacity for species of the family Sparidae [20]. NAD5 is coding for the subunit 5 of NADH dehydrogenase, part of the mitochondrial membrane, involved in the electron transport to the respiratory chain [21]. This gene consists of short variable sequence regions associated with conserved areas that allowed to obtain universal primers for sparids, amplifying in all species for a 265 bp fragment.
Here, a more detailed study on the genetic distance between the complete mtDNA of species belonging to the family Sparidae was carried on using a gene-by-gene approach. The updated mtDNA comparison allowed identifying NAD2 as a new barcoding gene that agrees to discriminate species within the same genus, based on its extremely high level of divergence in the nucleotide sequence. Our applicative research shifted toward the development of presence/absence assay for discriminating P. erythrinus. In this study, we propose a NAD2 fragment as a specific marker for the common pandora. The gene NAD2 was previously investigated as a marker for population studies of plants, parasites and animals [22,23,24,25]. However, no use is made of this gene, as far as we know, in fish species identification against frauds, and our results show that its use warrants further investigation. We designed species-specific primers, testing their performance in both classical and Real-Time PCR. The present research allows and simplifies common pandora authentication since a classical PCR sequencing-free or RT-PCR without electrophoresis concludes analysis and significantly reduces the time and costs needed for correct species identification.

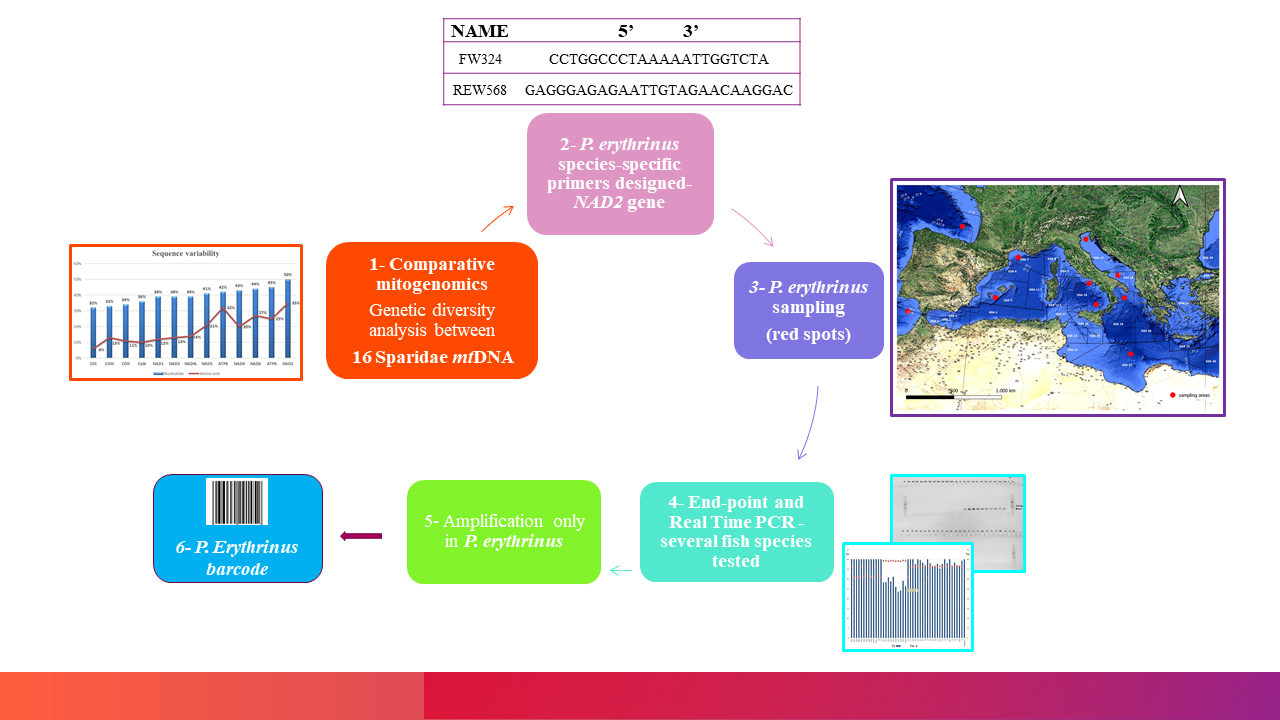
2. Materials and Methods

2.1. Fish Samples

Ten common pandora specimens from different FAO areas (27, 34, and 37) were sampled and used to test the PCR primer species-specificity (Table 1, Figure 1). The geographical coordinates of the fishing spots were provided by fish market operators. In fact, for the traceability protocol established by EC Reg. 1224/2009, each fishing company with boats over 10 m must have an electronic logbook for detecting the point where the nets are lowered (trawl fishing).
In the FAO area 37, spanning most of the species distribution (www.aquamaps.org), eight specimens were harvested from as many Geographical Sub-Areas (GSA) (Figure 1). The evaluation of primer specificity was extended to the other 26 fish species, as reported in Table 2.
These additional species were selected for the purpose to comprise (i) those used to replace P. erythrinus (e.g., Pagellus acarne), (ii) phylogenetically related sparid species (e.g., Dentex dentex) [26], and (iii) other species commonly found in Mediterranean fish markets. Eleven specimens of D. dentex, the most genetically related sparid species (Figure 2), were sampled, as reported in Table 3.
All additional species were provided by Pozzuoli (Naples, Italy) and Salerno (Italy) fish markets. Specimens were labeled and conserved on board at −20 °C, transported in isothermal conditions to fish markets, and then to the research laboratory. The classification at the species level was carried out on the bases of fishes anatomical and morphological characteristics at the Department of Veterinary Medicine and Animal Production, University of Naples Federico II, Naples (Italy).

2.2. Total Genomic DNA Extraction

Total DNA extraction for each sample was performed in double from muscle tissue using the DNeasy Blood & Tissue Kit (Qiagen, Hilden, Germany) according to the procedure proposed by the manufacturer [27]. DNA concentration was determined with Nanodrop 2000 spectrophotometer (Thermo Fisher Scientific, Waltham, MA, USA). The range of DNA amount was 40 ng/µL, while the purity was 1.8–2.0 ratio at A260/A280. DNA quantity and quality were evaluated by electrophoretic analysis in 1% agarose gel.

2.3. Comparative Analysis of mtDNA Complete Sequences

Sixteen complete mitogenome sequences of sparid species were analyzed. Ten of the sixteen were available in GenBank and six were sequenced and deposited in NCBI by this research group (Table 4). MtDNA sequences were analyzed and compared by the use of several bioinformatics tools, with the aim to find species-specific gene fragments for P. erythrinus identification. Unipro UGENE software [28] was used to perform the alignment. With the aim to evaluate the genetic divergence among genes and species, the hamming distance algorithm was used [29]. The p-genetic distance within species, the nucleotide sequence variability, pairwise and multiple alignments and gene divergence were determined as previously described [20,30,31].

2.4. NAD2 Fragment Amplification and Sequence Analysis

A pair of P. erythrinus-specific NAD2 primers that amplified a 291 bp fragment was designed by eye after multiple alignments of the 16 sparid species complete mtDNA sequences using BioEdit Sequence Alignment Editor [46]. In particular, primer design was carried out so that the nucleotide base at 3′ end was species-specific. Melting temperature (Tm), secondary structure, self-annealing, and inter-primer binding, were verified using Multiple Primer Analyzer (Thermo Fisher Scientific, Waltham, MA, USA). NAD2 primers efficiency for sparid species identification was further verified in silico [28].
PCR amplifications were performed as reported in Ceruso et al., 2019 [20], with the annealing temperature at 57 °C (291 bp) for 1 min. PCR products were purified using the QIAquick PCR Purification Kit (Qiagen). PCR reactions were carried out on mtDNA extracted from 10 fresh P. erythrinus specimens originating from different GSA/FAO areas (Table 1, Figure 1) and fresh specimens belonging to several other species of commercial interest (Table 2 and Table 3).
With the aim to confirm the correct amplification of the NAD2 gene fragment, amplicons sequences were assessed with the Sanger method using the Automated Capillary Electrophoresis Sequencer 3730 DNA Analyzer (Applied Biosystems, Foster City, CA, USA) at the Molecular Biology Service at the Stazione Zoologica Anton Dohrn. NAD2 sequences were evaluated with the BioEdit Sequence Alignment Editor. The concordance between morphological and molecular analyses was assessed running a BLAST analysis of the obtained sequences on GenBank for species identification [47].

2.5. Real-Time PCR

To assess the presence or absence of an amplicon with a simple yes/no answer, making it similar to a terminal PCR and gel electrophoresis, we tested primer sensibility and specificity in a protocol for Real-Time PCR (RT-PCR) technique. For some labs, it could be useful to assemble a reaction, load it into a single instrument, and obtain the needed information by visualizing species-specific amplification without the additional electrophoresis step. The DNA samples were used as a template for RT-PCR experiments performed in a Viia7 real-time PCR system (Applied Biosystems) at 1:10 dilution, with the primers described before [48]. The PCR volume of each sample was 10 μL with 5 μL of 2× RT-PCR SYBR Green Master Mix (Thermo Fisher), 0.05 or 0.1 pmol/μL for each primer and 2 μL of 1:10 diluted DNA template. The expected fragment of 291 bp in length had a theoretical melting temperature of about 87 °C calculated by Endmemo (http://www.endmemo.com/bio/tm.php). A slight difference in RT-PCR experiments is expected, due to the specific instrument used and the reaction conditions. In the set-up experiment, a specific amplicon with a melting temperature of about 80 °C was detected (data not shown), so we decided to test all fish specimens. Experiments were performed in triplicate. The diagram was elaborated with Excel.

3. Results

3.1. Pagellus erythrinus mtDNA Comparative Data

Hamming distance comparison results showed that the genetic dissimilarity among mtDNA of P. erythrinus and other sparid species varies from a minimum of 10% (Dentex dentex) to a maximum of 19% (Acanthopagrus latus and Rhabdosargus sarba) (Figure 2). In Figure 2, the species are ordered clockwise from the species closest to the farthest from P. erythrinus. Statistical analysis was reported in Ceruso et al., 2019 [20].
The Hamming distance was also studied comparing each mitochondrial gene. Results showed that the five genes with higher values of genetic dissimilarity were ATP6 (25%), NAD2 (24%), NAD4 (24%), NAD6 (24%), and NAD5 (23%) (Figure 3).
The p-genetic distance analysis among all sparids mtDNA displayed that the NAD group genes have a sequence distance ranging between 0.20 and 0.25, more than COI (0.16) and Cytb genes (0.19) (Figure 4).
Accordingly, nucleotide sequence variability analysis displayed the highest values in the NAD gene group (NAD1 39%, NAD2 50%, NAD3 39%, NAD4L 39%, NAD4 43%, NAD5 41%, NAD6 44%) (Figure 5). About amino acidic sequences, NAD2 (35%) and ATP8 (32%) proteins showed the highest variability (Figure 5).

3.2. NAD2 Amplification and Analysis

Following the results of Sparids mitogenome comparison, primers for amplifying species-specific nucleotide sequences were designed on the NAD2 gene. The high degree of nucleotide sequence variability of this gene among sparids species allowed to correctly design primers amplifying a 291 bp (from 303 to 593 nt) fragment so the nucleotide base at 3′ end was species-specific for P. erythrinus (Table 5, Figure 6).
As reported in the Materials and Methods Section 2.4, the specificity of the designed primers was firstly tested in silico against all available Sparidae mitogenomes (Table 4).
Endpoint-PCR amplification was obtained in all the 10 genomic DNA samples of P. erythrinus. No amplification occurred in the DNAs of other fish species (Figure 7).
The ten P. erythrinus amplicons were sequenced to confirm the correct amplification of the 291 bp NAD2 fragment. Amplicon sequence comparison with databases showed accurate species identification, with similarity scores of NAD2 sequences ranging between 98% and 100%.
The value of intraspecific genetic variability ranged between 0% and 0.8%, with three different nucleotides found in two out of ten specimens (specimens Pe9 and Pe10 in Table 1).

3.3. NAD2 Amplification by RT-PCR

All the P. erythrinus samples gave an amplification with a Ct (Cycle Threshold) between 23 and 31 (a low Ct indicates the presence of the specific fragment used in the experiment) and a Tm between 78 °C and 79 °C (as expected). All the other species gave an amplification with Ct between 36 and 40 (where 40 means undetectable signal, like the negative control) and Tm that varied between 60 °C (the negative control) and 72 °C (Figure 8), indicating the presence of a very small amount of a non-specific product.

4. Discussion

Current studies focused on DNA based fish species identification use mitochondrial markers (e.g., COI, Cytb, 12S and 16S) standardly, assuming that they have discriminating ability on all fish families, genus or species. Nevertheless, the poor reliability of most widely used mitochondrial genes for barcoding and for constructing phylogenetic trees has been outlined earlier [49,50,51,52]. Thus, the high degree of genetic homology among fish species of the same family may cause limitations to providing adequate resolution for a correct identification, since species are differentiated by point mutations. Currently, mitochondrial genomes can be rapidly obtained from genome or transcriptome datasets [27], but comparative mitogenomics has been barely used for the discovery of new specific genes useful as markers for species and strain recognition [19,53,54].
The first innovation of this paper is that a vast amount of data was explored, considering the complete mtDNA of sixteen Sparidae species, to verify the presence of genes and gene fragments with more genetic divergence than standard markers. Thus, the investigation of the complete mitochondrial genome of the most commercially important sparid species allowed us to identify a new barcoding marker. The new approach showed that the “top five genes” with higher values of genetic dissimilarity among sparids were 1-ATP6, 2-NAD2, 3-NAD4, 4-NAD6, and 5-NAD5. It is important to note that among these five genes, there are two (ATP6-684 bp and NAD6-522 bp) with a total length of much less than others (NAD2-1047 bp, NAD4-1381 bp and NAD5-1839 bp). In the three longer genes, the genetic dissimilarity degree appears to have greater statistical significance. Another consideration is that this ranking does not include genes currently used for sparid species identification (COI, Cytb, 12S and 16S).
The p-genetic distance analysis confirmed previous results, with the same “top five genes”, but in a different order: 1-NAD2; 2-NAD5; 3-NAD4; 4-ATP6 and 5-NAD6.
Lastly, also the gene sequence variability study completed and reinforced previous findings. The best genes were 1-NAD2, followed by 2-ATP6; 3-NAD6, 4-NAD4 and 5-ATP8. Once again, NAD genes group have higher values compared with traditional barcoding genes used for sparid species identification, i.e., Cytb, COI, 16S and 12S.
Another important consideration and innovation of our study is that the comparison carried out allowed to find a new gene, never considered before for sparids barcoding scopes (NAD2), with an incisive, rapid, and unequivocal discriminating ability. Therefore, applying bioinformatics analysis, the barcoding value of all the NAD group genes was previously reported in fish families, but the NAD5 gene was selected as a potential marker [20,55].
One of the main features that differentiates the NAD2 gene from the NAD5 is the distribution of genetic diversity. In fact, the NAD5 had highly divergent areas in alternance with very similar areas between species. This made it possible to design primers that amplified across all species, allowing diversification through sequencing only. Instead, the NAD2 high degree of genetic divergence is spread throughout all the gene, in order to allow the design of primers with a 3′ primer start position different from the other species hence specific for P. erythrinus. Clearly, this NAD2 feature makes it possible to design species-specific primers for other sparid species, bringing great benefits in the research field of species identification against frauds.
Finally, this research provides an expansion of knowledge on the genetic dissimilarity among Sparids. Previous research on the genetic distance among sparid species in the family Sparidae focalized on single genes (e.g., Cytb), not on the complete mtDNA [56].
The new approach based on the complete mtDNA genome has allowed us to know the potential information content on genetic variation and lineage divergence of Sparidae species. The comparative mitogenomic analysis reveals the close relationship of P. erythrinus with other sparid species, with genetic divergence ranging from 10 to 19%. Gene-by-gene Hamming distance analysis identifies ATP6, NAD2, NAD4, NAD5, and NAD6 as the less conserved mitochondrial genes among porgies and seabreams.
Our results allowed to find the species-specific barcode marker for P. erythrinus, to use in frauds prevention based on species substitution. This research represents a new way to approach the studies on fish species identification and should be applied to other fish species to prevent and manage frauds.

5. Conclusions

An in-depth analysis of the complete mitogenomes of sparid fishes provides a novel species-specific barcoding marker for the identification of the common pandora P. erythrinus, a seafood industry product commonly subject to frauds by replacement. This study reports a consistent and fast presence/absence visual assay to prevent frauds by substitution of P. erythrinus, through a simple end-point PCR that does not need sequencing. The RT-PCR confirmed primer specificity and sensibility and does not require electrophoresis but implies more laboratory skills.
The Official Controls Regulation (EU) 2017/625, gives increasing importance to consumer protection and safety against fraudulent practices along the agri-food chain. The replacement and mislabeling of fish species with others of lower commercially value is a growing problem in the production and distribution of fishery products chain. Effective species identification in fresh, frozen, and treated products may contribute to the “molecular traceability” of seafood, in agreement with Regulation (EU) 1379/2013 (European Commission, Brussels, Belgium, 2013). Competent national authorities could make the food control and authentication activities more effective thanks to the full use of DNA test analysis, in order to discourage fraudulent species replacement activities.

Author Contributions

Conceptualization, T.P., P.S., M.C.; methodology, C.M., M.C., P.D.L., I.V., E.B.; resources, T.P., P.S.; writing—Original draft preparation, C.M., M.C., G.S.; writing—Review and editing, T.P., P.S.; supervision, T.P., P.S., A.A; funding acquisition, T.P., P.S., A.A. All authors have read and agreed to the published version of the manuscript.

Funding

This research received no external funding.

Conflicts of Interest

The authors declare no conflict of interest.

References

  1. Spink, J.; Embarek, P.B.; Savelli, C.J.; Bradshaw, A. Global perspectives on food fraud: Results from a WHO survey of members of the International Food Safety Authorities Network (INFOSAN). Npj Sci. Food 2019, 3, 12. [Google Scholar] [CrossRef] [PubMed]
  2. Spink, J.; Moyer, D.C. Defining the public health threat of food fraud. J. Food Sci. 2011, 76, R157–R162. [Google Scholar] [CrossRef] [PubMed]
  3. Spink, J. The current state of food fraud prevention: Overview and requirements to address “How to Start?” and “How Much is Enough?”. Curr. Opin. Food Sci. 2019, 27, 130–138. [Google Scholar] [CrossRef]
  4. Lang, R.E.D. Report on the Food Crisis, Fraud in the Food Chain and the Control Thereof. Tech. Report No. 2013/2091(INI); Committee on the Environment, Public Health and Food Safety, European Parliament: Strasbourg, France, 2013. [Google Scholar]
  5. Chen, J.; CFSA. Chinese National Center for Food Safety Risk Assessment. Strategies for ensuring food safety of Chinese products—Fight against food fraud. In Proceedings of the Institute for Food Technologists (IFT) Annual Conference, Chicago, IL, USA, 11–14 July 2015. [Google Scholar]
  6. EU Food Fraud Network and the System for Administrative Assistance. Food Fraud Annual Report 2018. Available online: https://ec.europa.eu/food/sites/food/files/safety/docs/ff_ffn_annual-report_2018.pdf (accessed on 7 August 2020).
  7. FAO. FishStat Plus. Available online: http://www.fao:fishery/statistics/software/fishstat/en (accessed on 7 August 2020).
  8. Basurco, B.; Lovatelli, A.; Garcia, B. Current status of Sparidae aquaculture. In Sparidae: Biology and Aquaculture of Gilthead Sea Bream and Other Species; Pavlidis, A., Mylonas, C.C., Eds.; Blackwell Publishing Ltd.: Oxford, UK, 2011; pp. 10–11. [Google Scholar]
  9. Malandra, R.; Renon, P. Le Principali Frodi dei Prodotti della Pesca; Libreria Universitaria Valdina: Milano, Italy, 1998; pp. 89–91; 105–106. [Google Scholar]
  10. Antonucci, F.; Costa, C.; Aguzzi, J.; Cataudella, S. Ecomorphology of morpho-functional relationships in the family of sparidae: A quantitative statistic approach. J. Morphol. 2009, 270, 843–855. [Google Scholar] [CrossRef]
  11. Messina, A. Identificazione di Sparidi di Interesse Commerciale Sui Mercati Internazionali Mediante DNA Barcoding. Specialist Thesis, Università di Pisa, Pisa, Italy, 2012. [Google Scholar]
  12. Riina, M.V.; Gilli, M.; Costa, R.; Colussi, S.; Bertuzzi, S.; Trisorio, S.; Gili, S.; Perazzini, A.Z.; Pezzolato, M.; Richelmi, G.; et al. Evaluation of DNA Markers for Fish Identification. Ital. J. Food Saf. 2012, 1, 25–29. [Google Scholar] [CrossRef] [Green Version]
  13. Armani, A.; Guardone, L.; Castigliego, L.; D’Amico, P.; Messina, A.; Malandra, R.; Gianfaldoni, D.; Guidi, A. DNA and Mini-DNA Barcoding for the Identification of Porgies Species (Family Sparidae) of Commercial Interest on the International Market. Food Control 2015, 50, 589–596. [Google Scholar] [CrossRef]
  14. Trotta, M.; Schönhuth, S.; Pepe, T.; Cortesi, M.L.; Puyet, A.; Bautista, J.M. Multiplex PCR Method for use in real-time PCR for identification of fish fillets from grouper (Epinephelus and Mycteroperca Species) and common substitute species. J. Agric. Food Chem. 2005, 53, 2039–2045. [Google Scholar] [CrossRef]
  15. Pepe, T.; Trotta, M.; di Marco, I.; Anastasio, A.; Bautista, J.M.; Cortesi, M.L. Fish species identification in surimi-based products. J. Agric. Food Chem. 2007, 55, 3681–3685. [Google Scholar] [CrossRef]
  16. Cawthorn, D.M.; Steinman, H.A.; Witthuhn, R.C. Evaluation of the 16S and 12S RRNA genes as universal markers for the identification of commercial fish species in South Africa. Gene 2012, 491, 40–48. [Google Scholar] [CrossRef]
  17. Melo, B.F.; Dorini, B.F.; Foresti, F.; Oliveira, C. Little divergence among mitochondrial lineages of Prochilodus (Teleostei, Characiformes). Front. Genet. 2018, 9, 1–9. [Google Scholar] [CrossRef]
  18. Li, J.; Yang, H.; Xie, Z.; Yang, X.; Xiao, L.; Li, S.; Chen, M.; Zhao, H.; Zhang, Y. The complete mitochondrial genome of the Rhabdosargus Sarba (Perciformes: Sparidae). Mitochondrial DNA Part A 2014, 27, 1606–1607. [Google Scholar] [CrossRef]
  19. Chagas, A.T.D.A.; Ludwig, S.; Pimentel, J.D.S.M.; De Abreu, N.L.; Rodriguez, D.N.; Leal, H.G.; Kalapothakis, E. Use of complete mitochondrial genome sequences to identify barcoding markers for groups with low genetic distance. Mitochondrial DNA Part A 2020, 31, 139–146. [Google Scholar] [CrossRef] [PubMed]
  20. Ceruso, M.; Mascolo, C.; Anastasio, A.; Pepe, T.; Sordino, P. Frauds and fish species authentication: study of the complete mitochondrial genome of some sparidae to provide specific barcode markers. Food Control 2019, 103, 36–47. [Google Scholar] [CrossRef]
  21. Voet, D.; Voet, J.G.; Pratt, C.W. Fundamentals of Biochemistry: Life at the Molecular Level, 4th ed.; Wiley: Hoboken, NJ, USA, 2013; pp. 581–620. [Google Scholar]
  22. Abbas, B.; Tjolli, I.; Dailami, M. Phylogenetic of sago palm (Metroxylon sagu) and others monocotyledon based on mitochondrial nad2 gene markers. Biodiversitas J. Biol. Divers. 2019, 20, 2249–2256. [Google Scholar] [CrossRef] [Green Version]
  23. Vanhove, M.P.M.; Briscoe, A.G.; Jorissen, M.W.P.; Littlewood, D.T.J.; Huyse, T. The first next-generation sequencing approach to the mitochondrial phylogeny of African monogenean parasites (Platyhelminthes: Gyrodactylidae and Dactylogyridae). BMC Genom. 2018, 19, 520. [Google Scholar] [CrossRef]
  24. Feng, X.; Johnson, E.G.; Williams, E.P.; Place, A.R. Successful identification and discrimination of hatchery-reared blue crabs (Callinectes sapidus) released into the chesapeake bay using a genetic tag. J. Shellfish. Res. 2017, 36, 277–282. [Google Scholar] [CrossRef]
  25. Zhang, D.; Zou, H.; Wu, S.G.; Li, M.; Jakovlić, I.; Zhang, J.; Chen, R.; Li, W.X.; Wang, G.T. Three new Diplozoidae mitogenomes expose unusual compositional biases within the Monogenea class: Implications for phylogenetic studies. BMC Evol. Biol. 2018, 18, 133. [Google Scholar] [CrossRef] [Green Version]
  26. Ceruso, M.; Venuti, I.; Osca, D.; Caputi, L.; Anastasio, A.; Crocetta, F.; Sordino, P.; Pepe, T. The complete mitochondrial genome of the sharpsnout seabream diplodus puntazzo (Perciformes : Sparidae). Mitochondrial DNA Part B 2020, 5, 2379–2381. [Google Scholar] [CrossRef]
  27. Mascolo, C.; Ceruso, M.; Sordino, P.; Palma, G.; Anastasio, A.; Pepe, T. Comparison of mitochondrial DNA enrichment and sequencing methods from fish tissue. Food Chem. 2019, 294, 333–338. [Google Scholar] [CrossRef]
  28. Kumar, A.; Chordia, N. Methods in molecular biology. In Silico PCR Primer Designing and Validation; Basu, C., Ed.; Humana Press: New York, NY, USA, 2015; Volume 1275, pp. 143–151. [Google Scholar] [CrossRef]
  29. Mitchell, M. An Introduction to Genetic Algorithms; MIT Press: Cambridge, MA, USA, 1998. [Google Scholar]
  30. Kumar, S.; Stecher, G.; Li, M.; Knyaz, C.; Tamura, K. MEGA X: Molecular evolutionary genetics analysis across computing platforms. Mol. Biol. Evol. 2018, 35, 1547–1549. [Google Scholar] [CrossRef]
  31. Tamura, K.; Nei, M.; Kumar, S. Prospects for inferring very large phylogenies by using the neighbor-joining method. Proc. Natl. Acad. Sci. USA 2004, 101, 11030–11035. [Google Scholar] [CrossRef] [PubMed] [Green Version]
  32. Xia, J.; Xia, K.; Jiang, S. Complete mitochondrial DNA sequence of the yellowfin seabream Acanthopagrus latus and a genomic comparison among closely related sparid species. Mitochondrial DNA 2008, 19, 385–393. [Google Scholar] [CrossRef] [PubMed]
  33. Shi, X.; Su, Y.; Wang, J.; Ding, S.; Mao, Y. Complete mitochondrial genome of black porgy Acanthopagrus schlegelii (Perciformes, Sparidae). Mitochondrial DNA 2012, 23, 310–312. [Google Scholar] [CrossRef] [PubMed]
  34. Mascolo, C.; Ceruso, M.; Chirollo, C.; Palma, G.; Anastasio, A.; Sordino, P.; Pepe, T. The complete mitochondrial genome of the Angolan dentex Dentex angolensis (Perciformes: Sparidae). Mitochondrial DNA Part B 2019, 4, 1245–1246. [Google Scholar] [CrossRef] [Green Version]
  35. Ceruso, M.; Mascolo, C.; Palma, G.; Anastasio, A.; Pepe, T.; Sordino, P. The complete mitochondrial genome of the common dentex, Dentex dentex (Perciformes: Sparidae). Mitochondrial DNA Part B 2018, 3, 391–392. [Google Scholar] [CrossRef] [Green Version]
  36. Mascolo, C.; Ceruso, M.; Palma, G.; Anastasio, A.; Sordino, P.; Pepe, T. The complete mitochondrial genome of the Pink dentex Dentex gibbosus (Perciformes: Sparidae). Mitochondrial DNA Part B 2018, 3, 525–526. [Google Scholar] [CrossRef] [Green Version]
  37. Zeng, L.; Jiang, L.; Xu, M.; Wu, C. Complete mitochondrial genome of yellowback sea bream Evynnis tumifrons. Mitochondrial DNA Part B 2016, 1, 352–354. [Google Scholar] [CrossRef] [Green Version]
  38. Mascolo, C.; Ceruso, M.; Palma, G.; Anastasio, A.; Sordino, P.; Pepe, T. The complete mitochondrial genome of the axillary seabream, Pagellus acarne (Perciformes: Sparidae). Mitochondrial DNA Part B 2018, 3, 434–435. [Google Scholar] [CrossRef]
  39. Ponce, M.; Infante, C.; Jimenez-Cantizano, R.M.; Perez, L.; Manchado, M. Complete mitochondrial genome of the blackspot seabream, Pagellus bogaraveo (Perciformes: Sparidae), with high levels of length heteroplasmy in the WANCY region. Gene 2008, 409, 44–52. [Google Scholar] [CrossRef]
  40. Ceruso, M.; Mascolo, C.; Lowe, E.K.; Palma, G.; Anastasio, A.; Pepe, T.; Sordino, P. The complete mitochondrial genome of the common Pandora Pagellus erythrinus (Perciformes: Sparidae). Mitochondrial DNA Part B 2018, 3, 624–625. [Google Scholar] [CrossRef] [Green Version]
  41. Ponce, M.; Infante, C.; Catanese, G.; Cardenas, S.; Manchado, M. Complete mitochondrial DNA of redbanded seabream (Pagrus auriga). In Proceedings of the Conference EAS - Aquaculture Europe 04, Barcelona, Spain, 1 September 2004. [Google Scholar]
  42. Afriyie, G.; Guo, Y.; Kuebutornye, F.K.A.; Larbi, C.A.; Wang, Z. Complete mitochondrial DNA sequence analysis of Bluespotted seabream, Pagrus caeruleostictus (Perciformes: Sparidae). Mitochondrial DNA Part B 2020, 5, 1913–1914. [Google Scholar] [CrossRef] [Green Version]
  43. Miya, M.; Kawaguchi, A.; Nishida, M. Mitogenomic exploration of higher teleostean phylogenies: A case study for moderate-scale evolutionary genomics with 38 newly determined complete mitochondrial DNA sequences. Mol. Biol. Evol. 2001, 18, 1993–2009. [Google Scholar] [CrossRef] [PubMed] [Green Version]
  44. Xia, J.; Xia, K.; Gong, J.; Jiang, S. Complete mitochondrial DNA sequence, gene organization and genetic variation of control regions in Parargyrops edita. Fish. Sci. 2007, 73, 1042–1049. [Google Scholar] [CrossRef]
  45. Dray, L.M.; Neuhof, M.; Diamant, A.; Huchon, D. The complete mitochondrial genome of the gilthead seabream Sparus aurata L. (Sparidae). Mitochondrial DNA 2016, 27, 781–782. [Google Scholar] [CrossRef]
  46. Hall, T.A. BioEdit: A user-friendly biological sequence alignment editor and analysis program for windows 95/98/NT. Nucl. Acids Symp. 1999, 41, 95–98. [Google Scholar]
  47. Ratnasingham, S.; Hebert, P.D.N. A DNA-based registry for all animal species: The barcode index number (BIN) System. PLoS ONE 2013, 8. [Google Scholar] [CrossRef] [Green Version]
  48. Freeman, W.M.; Walker, S.J.; Vrana, K.E. Quantitative RT-PCR: Pitfalls and potential. Biotechniques 1999, 26, 112–122, 124–125. [Google Scholar] [CrossRef]
  49. Meyer, C.P.; Paulay, G. DNA Barcoding: Error rates based on comprehensive sampling. PLoS Biol. 2005, 3, e422. [Google Scholar] [CrossRef] [Green Version]
  50. Waugh, J. DNA barcoding in animal species: Progress, potential and pitfalls. Bioessays 2007, 29, 188–197. [Google Scholar] [CrossRef]
  51. Costa-Silva, G.J.; Rodriguez, M.S.; Roxo, F.F.; Foresti, F.; Oliveira, C. Using different methods to access the difficult task of delimiting species in a complex neotropical hyperdiverse group. PLoS ONE 2015, 10, e0135075. [Google Scholar] [CrossRef]
  52. DeSalle, R.; Goldstein, P. Review and interpretation of trends in DNA barcoding. Front. Ecol. Evol. 2019, 7, 302. [Google Scholar] [CrossRef] [Green Version]
  53. Zarowiecki, M.Z.; Huyse, T.; Littlewood, D.T.J. Making the most of mitochondrial genomes—Markers for phylogeny, molecular ecology and barcodes in schistosoma (Platyhelminthes: Digenea). Int. J. Parasitol. 2007, 37, 1401–1418. [Google Scholar] [CrossRef] [PubMed]
  54. Wang, J.; Zhang, L.; Zhang, Q.; Zhou, M.; Wang, X.; Yang, X.-Z.; Yuan, M.-L. Comparative mitogenomic analysis of mirid bugs (Hemiptera: Miridae) and evaluation of potential DNA barcoding markers. PeerJ 2017, 5, e3661. [Google Scholar] [CrossRef] [PubMed] [Green Version]
  55. Miya, M.; Sato, Y.; Fukunaga, T.; Sado, T.; Poulsen, J.Y.; Sato, K.; Minamoto, T.; Yamamoto, S.; Yamanaka, H.; Araki, H.; et al. MiFish, a set of universal PCR primers for metabarcoding environmental DNA from fishes: Detection of more than 230 subtropical marine species. R. Soc. Open Sci. 2015, 2, 150088. [Google Scholar] [CrossRef] [Green Version]
  56. Chiba, S.N.; Iwatsuki, Y.; Yoshino, T.; Hanzawa, N. Comprehensive phylogeny of the family Sparidae (Perciformes: Teleostei) inferred from mitochondrial gene analyses. Genes Genet. Syst. 2009, 84, 153–170. [Google Scholar] [CrossRef] [Green Version]
Figure 1. Red spots show the geographical origins of the P. erythrinus specimens sampled for this study. The sampling areas considered the GSA division from GFCM (Establishment of Geographical Sub-Areas in the GFCM area amending the resolution GFCM/31/2007/2) and FAO areas. GFCM: General Fisheries Commission for the Mediterranean. GSA: Geographical Sub-Area.
Foods 09 01397 g001
Figure 2. Hamming distance comparison showed that the genetic dissimilarity among mtDNA of Pagellus erythrinus and other sparid species ranges from 10% (Dentex dentex) to 19% (Acanthopagrus latus and Rhabdosargus sarba).
Foods 09 01397 g002
Figure 3. Gene-by-gene Hamming distance analysis carried out between P. erythrinus and other sparid species. The blue bracket shows the five less conserved mitochondrial genes in the Sparidae family.
Foods 09 01397 g003
Figure 4. p-genetic distance analysis. The genes were sorted by increasing p-distance values. The gene with the lowest value is COI, while the gene with the highest value is NAD2.
Foods 09 01397 g004
Figure 5. Gene-by-gene analysis of nucleotide and amino acid sequence interspecific variability. The genes were sorted by increasing variability values. The gene with the lowest value is COI, while the gene with the highest value is NAD2.
Foods 09 01397 g005
Figure 6. Species-specific primer alignment on Sparidae NAD2 orthologous genes. Primers (highlighted in yellow) aligned only in P. erythrinus (sample n. 10). White arrows show the 3′ end species-specific position. (A) Primer FW303. (B) Primer REW593 (reverse-complement).
Foods 09 01397 g006
Figure 7. Gel electrophoretic image. End-point PCR amplification of NAD2 fragment in ten geographically disjunct specimens of P. erythrinus (lanes 14–35, from Pe1 to Pe10). No amplification was obtained for all other fish species (lanes 1–13 and 36–46). Abbreviations as in Table 1, Table 2 and Table 3. N: Negative control; M: 100 bp ladder.
Foods 09 01397 g007
Figure 8. Real-Time PCR. Threshold cycles (Ct) on the left and melting temperature (Tm) on the right. Abbreviations as in Table 2, Table 3 and Table 4.
Foods 09 01397 g008
Table 1. Geographical origins of the P. erythrinus specimens sampled for this study.
P. erythrinus
AbbreviationLatitudeLongitudeSampling Areas
Pe138.7145892.230898FAO 37 area—GSA5—Balearic Island
Pe242.7743694.384218FAO 37 area—GSA7—Gulf of Lions
Pe340.77548013.603978FAO 37 area—GSA10—South Tyrrhenian
Pe438.74887114.524641FAO 37 area—GSA10—Central Tyrrhenian
Pe544.99115613.065691FAO 37 area—GSA17—Northern Adriatic
Pe641.53367417.278337FAO 37 area—GSA18—Southern Adriatic Sea
Pe739.34322817.981462FAO 37 area—GSA19—Western Ionian Sea
Pe833.95293918.508806FAO 37 area—GSA21—Southern Ionian Sea
Pe944.708601−3.470325FAO 27 area—Atlantic Ocean
Pe1035.916767−7.425403FAO 34 area—Atlantic Ocean
Table 2. Fish species other than P. erythrinus used in this study by end-point PCR and Real-Time qPCR. Common names are from ASFIS List of Species for Fishery Statistics Purposes (http://www.fao.org/fishery/collection/asfis/en).
Scientific NameFamilyCommon NameAbbreviation
Dentex dentexSparidaeCommon dentexDd
Dentex gibbosusSparidaePink dentexDg
Cheimerius nufarSparidaeSanter seabreamCn
Pagellus acarneSparidaeAxillary seabreamPa
Aulopus filamentosusAulopidaeRoyal flagfinAf
Boops boopsSparidaeBogueBb
Trisopterus minutusGadidaePoor codTm
Cepola macrophthalmaCepolidaeRed bandfishCm
Diplodus annularisSparidaeAnnular seabreamDa
Diplodus sargusSparidaeWhite seabreamDs
Coris julisLabridaeRainbow wrasseCj
Chelidonichthys lucernaTriglidaeTub gurnardCl
Lithognathus mormyrusSparidaeSand steenbrasLm
Xyrichtys novaculaLabridaePearly razorfishXn
Pleuronectes platessaPleuronectidaeEuropean plaicePp
Lophius piscatoriusLophiidaeAngler (= Monk)Lp
Scophthalmus maximusScophthalmidaeTurbotPm
Sebastes capensisSebastidaeCape redfishSc
Solea soleaSoleidaeCommon soleSs
Trachurus trachurusCarangidaeAtlantic horse mackerelTt
Spondyliosoma cantharusSparidaeBlack seabreamSpc
Thunnus albacaresScombridaeYellowfin tunaTa
Thunnus obesusScombridaeBigeye tunaTo
Thunnus thynnusScombridaeAtlantic bluefin tunaTt
Mullus barbatusMullidaeRed mulletMb
Arnoglossus laternaBothidaeMediterranean scaldfishAl
Table 3. Geographical origins of the D. dentex specimens sampled for this study.
Dentex Dentex
AbbreviationLatitudeLongitudeSampling Areas
Dd139.8086623.740905GSA 5—Balearic Island
Dd242.5190353.534141GSA 7—Gulf of Lions
Dd338.77134814.946960GSA 10—South Tyrrhenian
Dd440.40944613.798889GSA 10—Central Tyrrhenian
Dd540.0445759.841622GSA 11.2—Sardinia (East)
Dd644.98047313.137520GSA 17—Northern Adriatic
Dd740.66828418.290108GSA 18—Southern Adriatic Sea
Dd840.04458717.147530GSA 19—Western Ionian Sea
Dd931.47593818.685467GSA 21—Southern Ionian Sea
Dd1035.33849635.708826GSA 27—Levante
Dd1140.87462012.985808GSA 10—Ponza Island, Central Thyrrhenian
Table 4. Sparids species with whole mtDNA sequences available in GenBank evaluated in this research.
SpeciesAc. NumberFAO Fishing AreasReferences
Acanthopagrus latusNC_010977FAO 71[32]
Acanthopagrus schlegeliiJQ_746035FAO 71[33]
Dentex angolensisNC_044097FAO 47[34]
Dentex dentexMG_727892FAO 37[35]
Dentex gibbosusMG_653593FAO 37[36]
Dentex tumifronsNC_029479FAO 71[37]
Diplodus puntazzoMT319027FAO 37[26]
Pagellus acarneMG_736083FAO 37[38]
Pagellus bogaraveoNC_009502FAO 27[39]
Pagellus erythrinusMG_653592FAO 37[40]
Pagrus aurigaAB_124801FAO 37[41]
Pagrus caeruleostictusMN319701FAO 34[42]
Pagrus majorNC_003196Farmed and supplied from Andalusia (Spain) fish market[43]
Parargyrops editaEF_107158FAO 71[44]
Rhabdosargus sarbaKM_272585Farmed Daya Bay Aquaculture Center, Guangdong (China)[18]
Sparus aurataLK_022698Farmed and supplied from Jaffa (Israel) fish market[45]
Table 5. P. erythrinus species-specific NAD2 primers.
Primer Name5′→3′ SequenceTm °CCG%ntATCG
FW303CCTGGCCCTAAAAATTGGTCTA65.145.5226664
REV593GAGGGAGAGAATTGTAGAACAAGGAC65.446.226113210

