Article

Food Selectivity in Juvenile Three-Spined Stickleback Gasterosteus aculeatus L. (Gasterosteidae) at Nursery Grounds in the White Sea

by
Anna S. Genelt-Yanovskaya
1,*,
Evgeny A. Genelt-Yanovskiy
1,
Natalia V. Polyakova
2,
Mikhail V. Ivanov
3,
Tatiana S. Ivanova
3 and
Dmitry L. Lajus
4
1
Department of Earth and Environmental Sciences, University of Exeter, Penryn Campus, Penryn TR10 9FE, Cornwall, UK
2
Laboratory of Behavior of Lower Vertebrates, A.N. Severtsov Institute of Ecology and Evolution RAS, Moscow 119071, Russia
3
Department of Ichthyology and Hydrobiology, Saint Petersburg State University, Saint Petersburg 199034, Russia
4
Estonian Marine Institute, University of Tartu, Mäealuse, 14, 12618 Tallinn, Estonia
*
Author to whom correspondence should be addressed.
J. Mar. Sci. Eng. 2023, 11(12), 2369; https://doi.org/10.3390/jmse11122369
Submission received: 17 November 2023 / Revised: 10 December 2023 / Accepted: 13 December 2023 / Published: 15 December 2023
(This article belongs to the Section Marine Biology)

Abstract

:
The spatial and temporal variability in the dietary preferences of juvenile three-spined stickleback Gasterosteus aculeatus were studied across the typical coastal habitats of Keret Archipelago, Kandalaksha Bay(the White Sea). The sampling of fish using a beach seine was conducted in the late July–early August period and in late August. Additionally, zooplankton samples were collected to conduct a quantitative assessment of the abundance of potential prey items. The similarity percentage (SIMPER) analysis was applied to the data obtained from the stomach content and revealed the five planktonic taxa most prominently contributing to the diet of juvenile sticklebacks. Among these, the copepod Temora longicornis was the most important prey item at marine sites, while Acartia longiremis dominated the diet of fish in the marine lagoon. The calculation of the selectivity index revealed that some taxa (such as A. longiremis) were always avoided by juvenile fish, whereas the selectivity of some taxa increased in late August. In general, juvenile sticklebacks demonstrated a pronounced individual variation in their selectivity, even when a particular prey item was selected positively during the whole period of study. Our data highlight that despite the predominant consumption of easily available prey by juvenile sticklebacks, they demonstrate taxonomic- and size-specific prey selectivity.

1. Introduction

The survival of juvenile life stages is critical for the successful recruitment of fish populations [1,2,3]. At the spawning and nursery grounds, the survival of juveniles can be a strong influencing factor on habitat type and trophic relationships with adult fishes of the same and other species, especially regarding predation and competition [4]. The abundance and diet of adult and juvenile fish at a particular spawning ground can be strongly dependent on the type of spawning ground. Wave explosion, water turbidity, substrate, availability of shelter, predator pressure, and availability of food resources are all factors shaping the quality of fish spawning grounds [5,6,7,8].
The indented coastline of Kandalaksha Bay, the White Sea, is an important spawning area for many common species, such as herring Clupea pallassii [9,10], smelt Osmerus dentex [11], and two species of sticklebacks: nine-spined stickleback Pungitius pungitius and three-spined stickleback Gasterosteus aculeatus [12]. These latter two species belong to an ecological group of ‘small fishes’, which are an important element of coastal and pelagic food webs [13,14,15,16]. Studies of the dietary preferences of sticklebacks, as mostly demersal fishes during the spawning season and pelagic during the rest of the year, are important for better understanding benthic–pelagic coupling in temperate and subarctic marine ecosystems. The marine populations of the three-spined stickleback are migratory—these fishes spend most of the summer in inshore areas and are pelagic species during the other months of the year. Adults lay eggs in mid-June, larvae hatch within one week, and then juveniles grow in the inshore and nearshore areas until late summer and early autumn [17]. Recent studies, based on combinations of the conventional stomach content analysis, carbon and nitrogen stable isotope analysis, and environmental DNA analysis, demonstrate that the diet of adult sticklebacks at spawning grounds includes benthic and planktonic taxa with pronounced shifts within the spawning season [18,19,20].
Previous studies of the diet of juvenile White Sea G. aculeatus at nursery grounds focused on the most suitable habitat for this species—dense beds of eelgrass and Zostera marina [21]. However, as sticklebacks use several types of intertidal habitats as nursery grounds, including Z.marina, rockweeds Fucus spp. and Ascophillum nodosum, semi-isolated marine lagoons and even rocky shores [17,22], it is important to understand how each type of spawning and nursery ground affects the trophic behavior of growing juveniles. By comparing the dietary preferences of juvenile fish with the structure of nearshore zooplankton communities, this paper focuses on the comparative analysis of the feeding patterns of three-spined stickleback juveniles across various typical nursery grounds for this species in early and late phases of active juvenile growth in nearshore waters during their first summer.

2. Materials and Methods

Samples were collected in August 2014 over two periods of the G. aculeatus spawning season, particularly 1.08–2.08 (hereafter—date 1, or early August) and 18.08–20.08 (date 2, or late August) at six sites differing by dominant intertidal habitat (Table 1, Figure 1). Sampling was implemented using a beach seine with the length and height of wings at 7.5 and 1.5 m, respectively; the mesh size was 5 mm from knot to knot in the wings and 1 mm in the codend. The seine was pulled from the shoreline with a rowing boat to an approx. 30-m distance from the shore and then pulled towards the shore to encircle the 120 square meter area.
In order to calculate the abundance of sticklebacks per square meter in a way that is comparable with other studies on sticklebacks in the White Sea using the same sampling equipment [18,22], the catch efficiency coefficient equal to 0.6 (the ratio of fish caught in relation to the total number of fish in the catch area) was applied. In a few cases, sticklebacks were caught using hand nets. From the seine net, two samples were collected. One consisted of 50 mL of fish to evaluate the abundance and size structure of juvenile sticklebacks. The other was collected for the evaluation of juvenile diets. The number of fish used for diet analysis is presented in Table 1. Exceptions were the samples from Keret and Krugliash at date two, when the abundance of fish was low, and all juveniles from the seine net were collected.
Simultaneously to juvenile stickleback sampling, we also collected zooplankton samples to analyze the density of planktonic food organisms. One replicate per site was collected with a plankton net (mesh size 93 µm) by filtering 100 L of the surface water.
The diet of juvenile sticklebacks was evaluated using standard stomach content analysis [18], and the subsequent calculation of standard indices was calculated either per sample (usually 30 fish, see Table 1) or per individual fish.
The following indices were used: feeding intensity measured as the fullness index (FI, ‱ or FI) [23,24], the frequency of occurrence (%Fi), the percentage of biomass (%Ii), the percentage number (%Qi), and the number of taxa from the stomach content significantly contributing to the diet (D-index). The partial feeding intensity index (PFI), expressing the fullness contribution of each prey category, was then assigned, summing up to the total stomach fullness [25,26]. Based on stomach content data, the D index was also calculated, indicating the number of ‘effective taxa’, i.e., the taxa significantly contributing to the diet of fish [27].
The role of individual objects in the diet (i.e., prey selectivity) was also calculated using the following Equation (1) [28,29]:
E = ( r i p i ) ( r i + p i )
where E is the selectivity index, ri is the proportion of prey species i in fish stomachs, and pi is the proportion of prey species i in the sea.
As a result, the E index represents the relative composition of the prey items in the stomach content and in the environment. The selectivity index was calculated based on either the food spectrum of individual fish within the sample or averaged per sample. The selectivity index generally varies between −1 and 1, with negative values indicating avoidance and positive values indicating active selection. Following several recent studies on food selectivity in aquatic species [30], E index values between −0.25 and +0.25 were considered as indicating non-selective feeding with E ≥ +0.25 indicating the preference for specific prey items, and E ≤ −0.25, and avoidance of particular prey items.
Statistical analyses were performed using standard spreadsheet software (MS Excel 2013), STATISTICA v7.0, PAST v.411 [31], and R version 4.2.3. Separate factorial ANOVA analyses were implemented to reveal the differences between sampling dates and sites using various parameters, e.g., the TL, FI, and D index, for the contribution of prey items to the food spectrum. The assumptions of ANOVA analyses were evaluated with Fisher’s post hoc comparisons. The relationships between FI and the abundance of juveniles and the E index of each prey item and TL of juveniles were evaluated using linear regression analysis. A two-way ANOSIM test was applied to explore the differences between the diet of juvenile sticklebacks by date and site [32]. ANOSIM generates a test statistic, R, and the magnitude of R is indicative of the degree of separation between groups, with a score of 1 indicating complete separation and 0 indicating no separation [33,34]. Similarity percentage analysis (SIMPER) was used with the Bray–Curtis dissimilarity metric to examine which prey items mostly contribute to the diet of juvenile sticklebacks [33].

3. Results

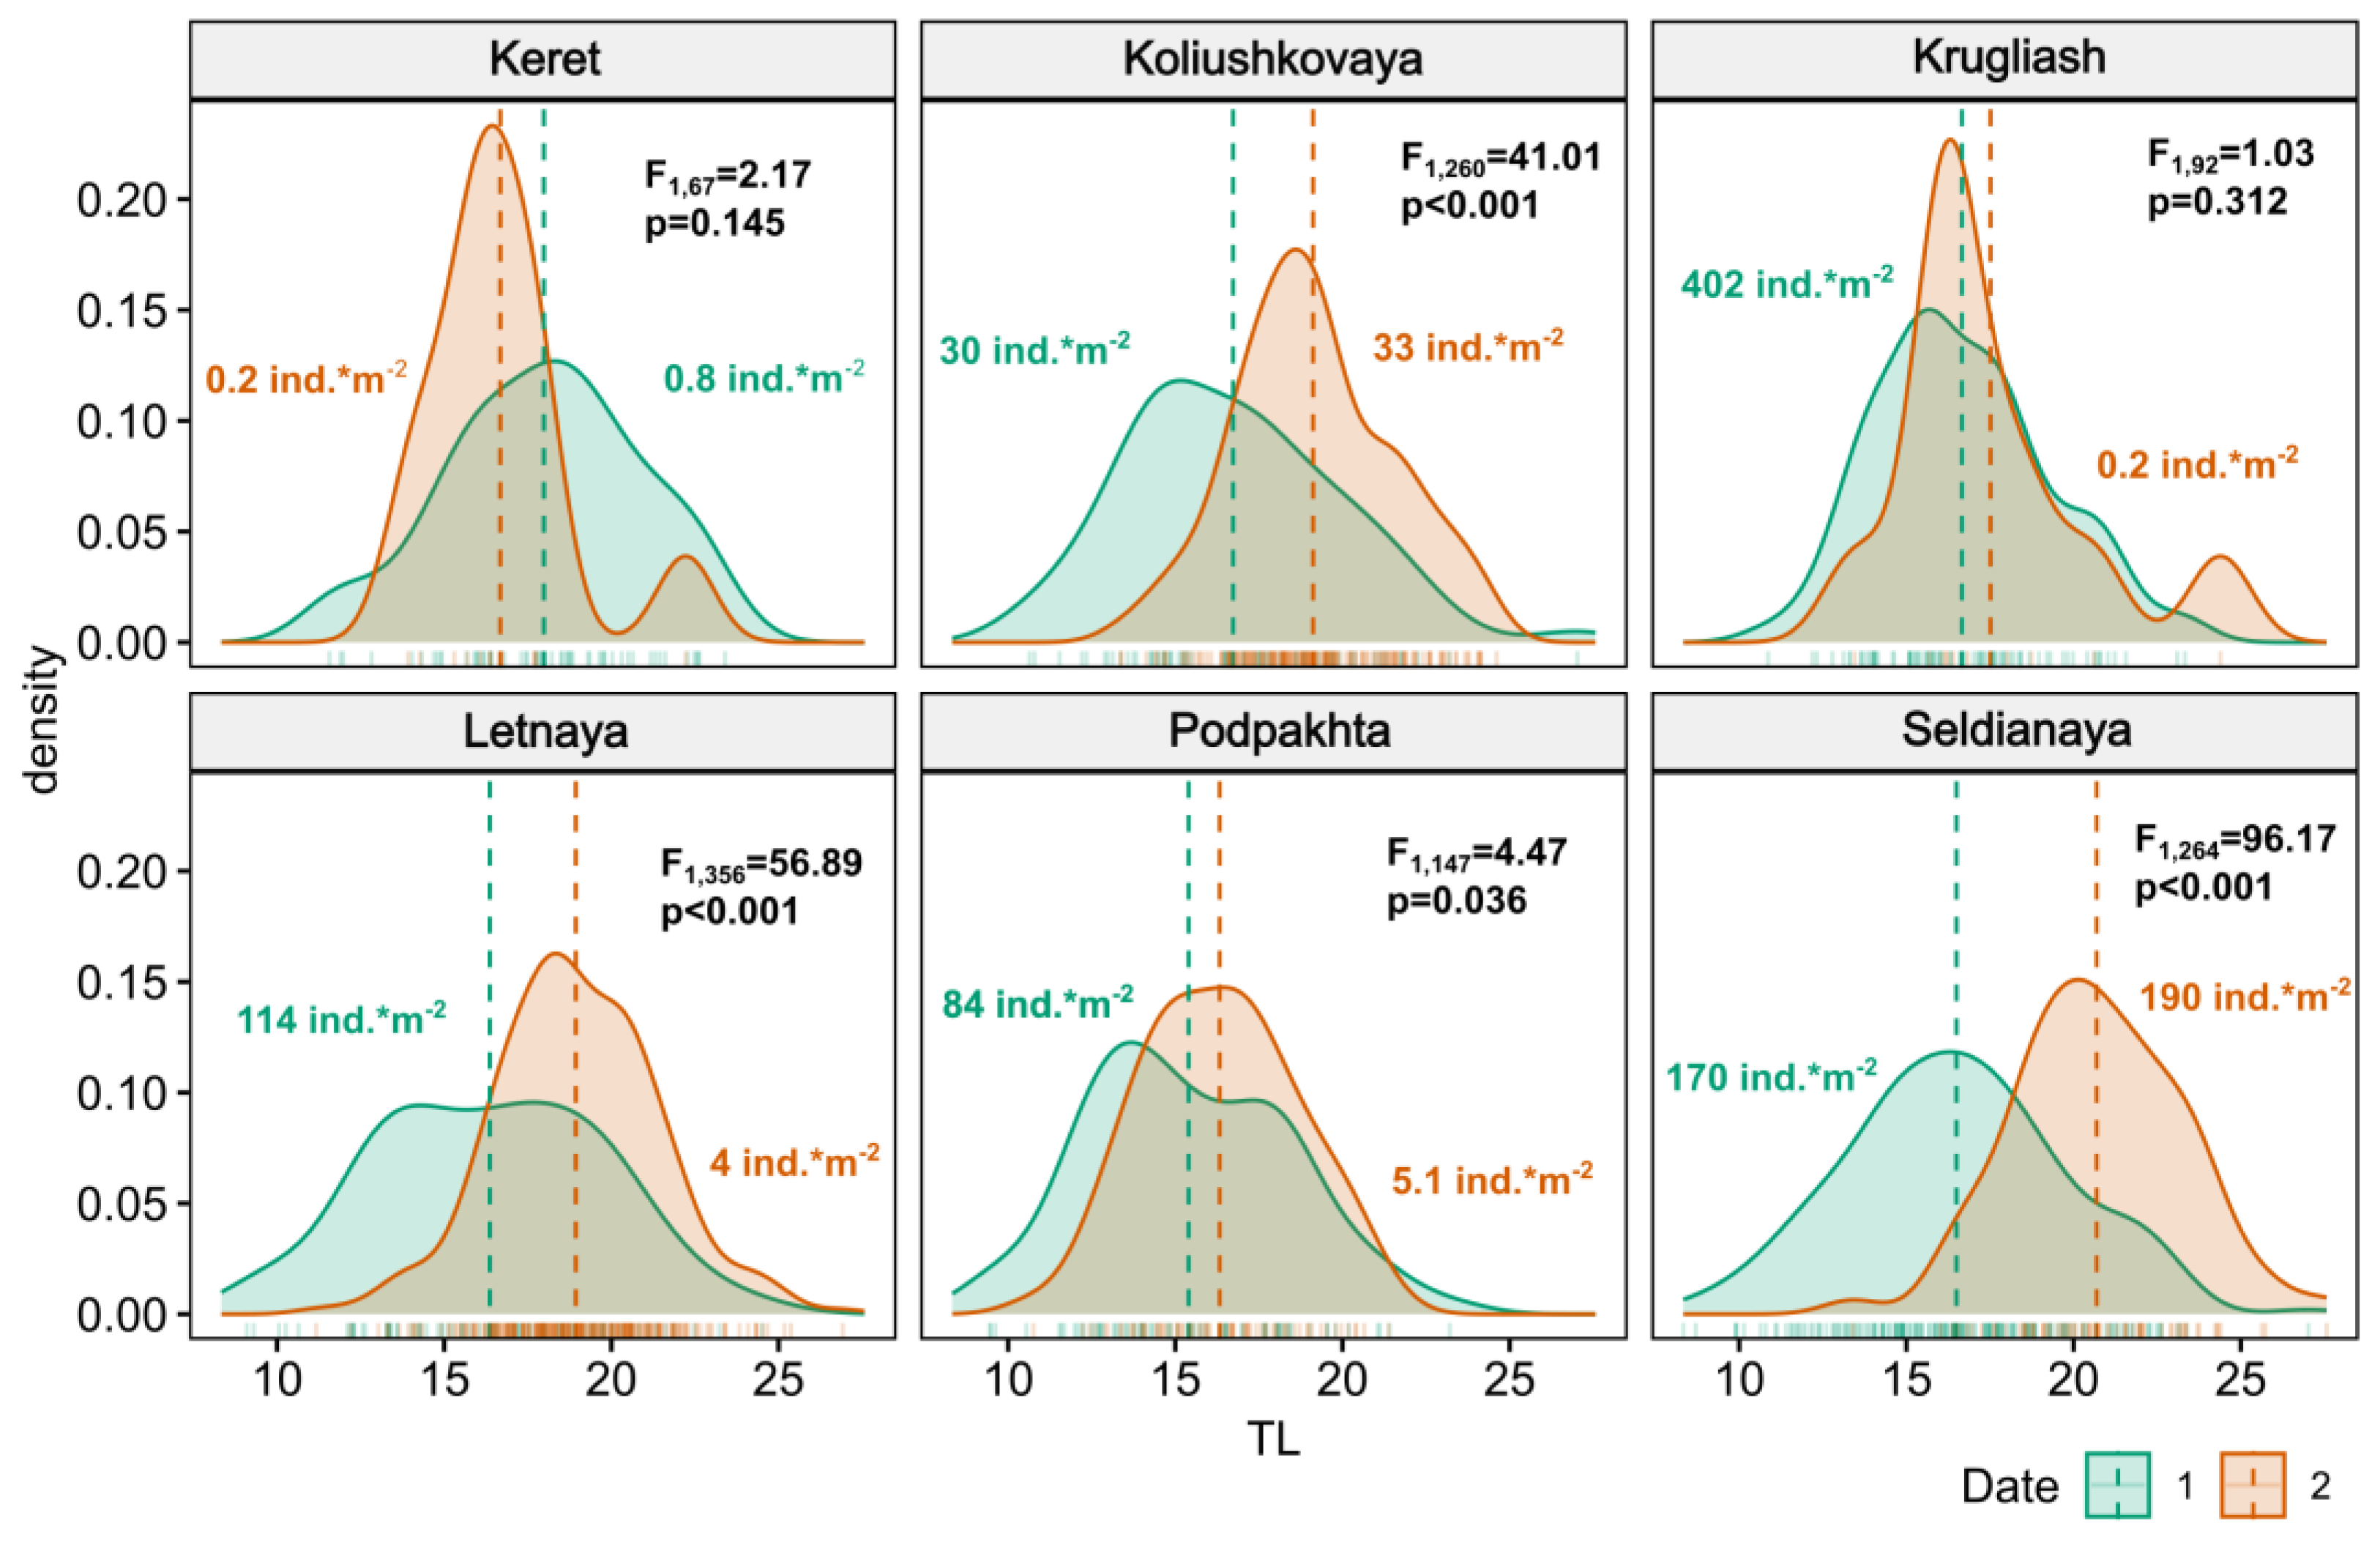
3.1. Size Structure and Abundance of Gasterosteus aculeatus Juveniles

Two-factor ANOVA results revealed some significant differences in juvenile length across the sites studied and the two periods of observation (F5,1186 = 10.68, p < 0.0001). The mean total length (TL) of juveniles increased by 15–25% in August at two eelgrass Zostera marina bed sites (Seldianaya: from 16.5 ± 0.2 to 20.7 ± 0.3; Letnaya: from 16.4 ± 0.4 to 18.9 ± 0.1 mm). In Koliushkovaya lagoon, where dense eelgrass beds are also present, the mean length increased from 16.7 ± 0.4 to 19.1 ± 0.2 mm (Figure 2). An increase in TL was also observed at the rockweed site Podpakhta from 15.4 ± 0.3 to 16.3 ± 0.3 mm, yet the significance level was lower than for eelgrass and lagoon sites. On the other two sites, TL did not change significantly. At these two sites, represented by rockweeds (Krugliash) and an intertidal rocky shore (Keret), the density of juveniles was lower in late August compared to the eelgrass bed sites. Data on the density of juveniles at all sites during the two periods of study is shown in Figure 2.

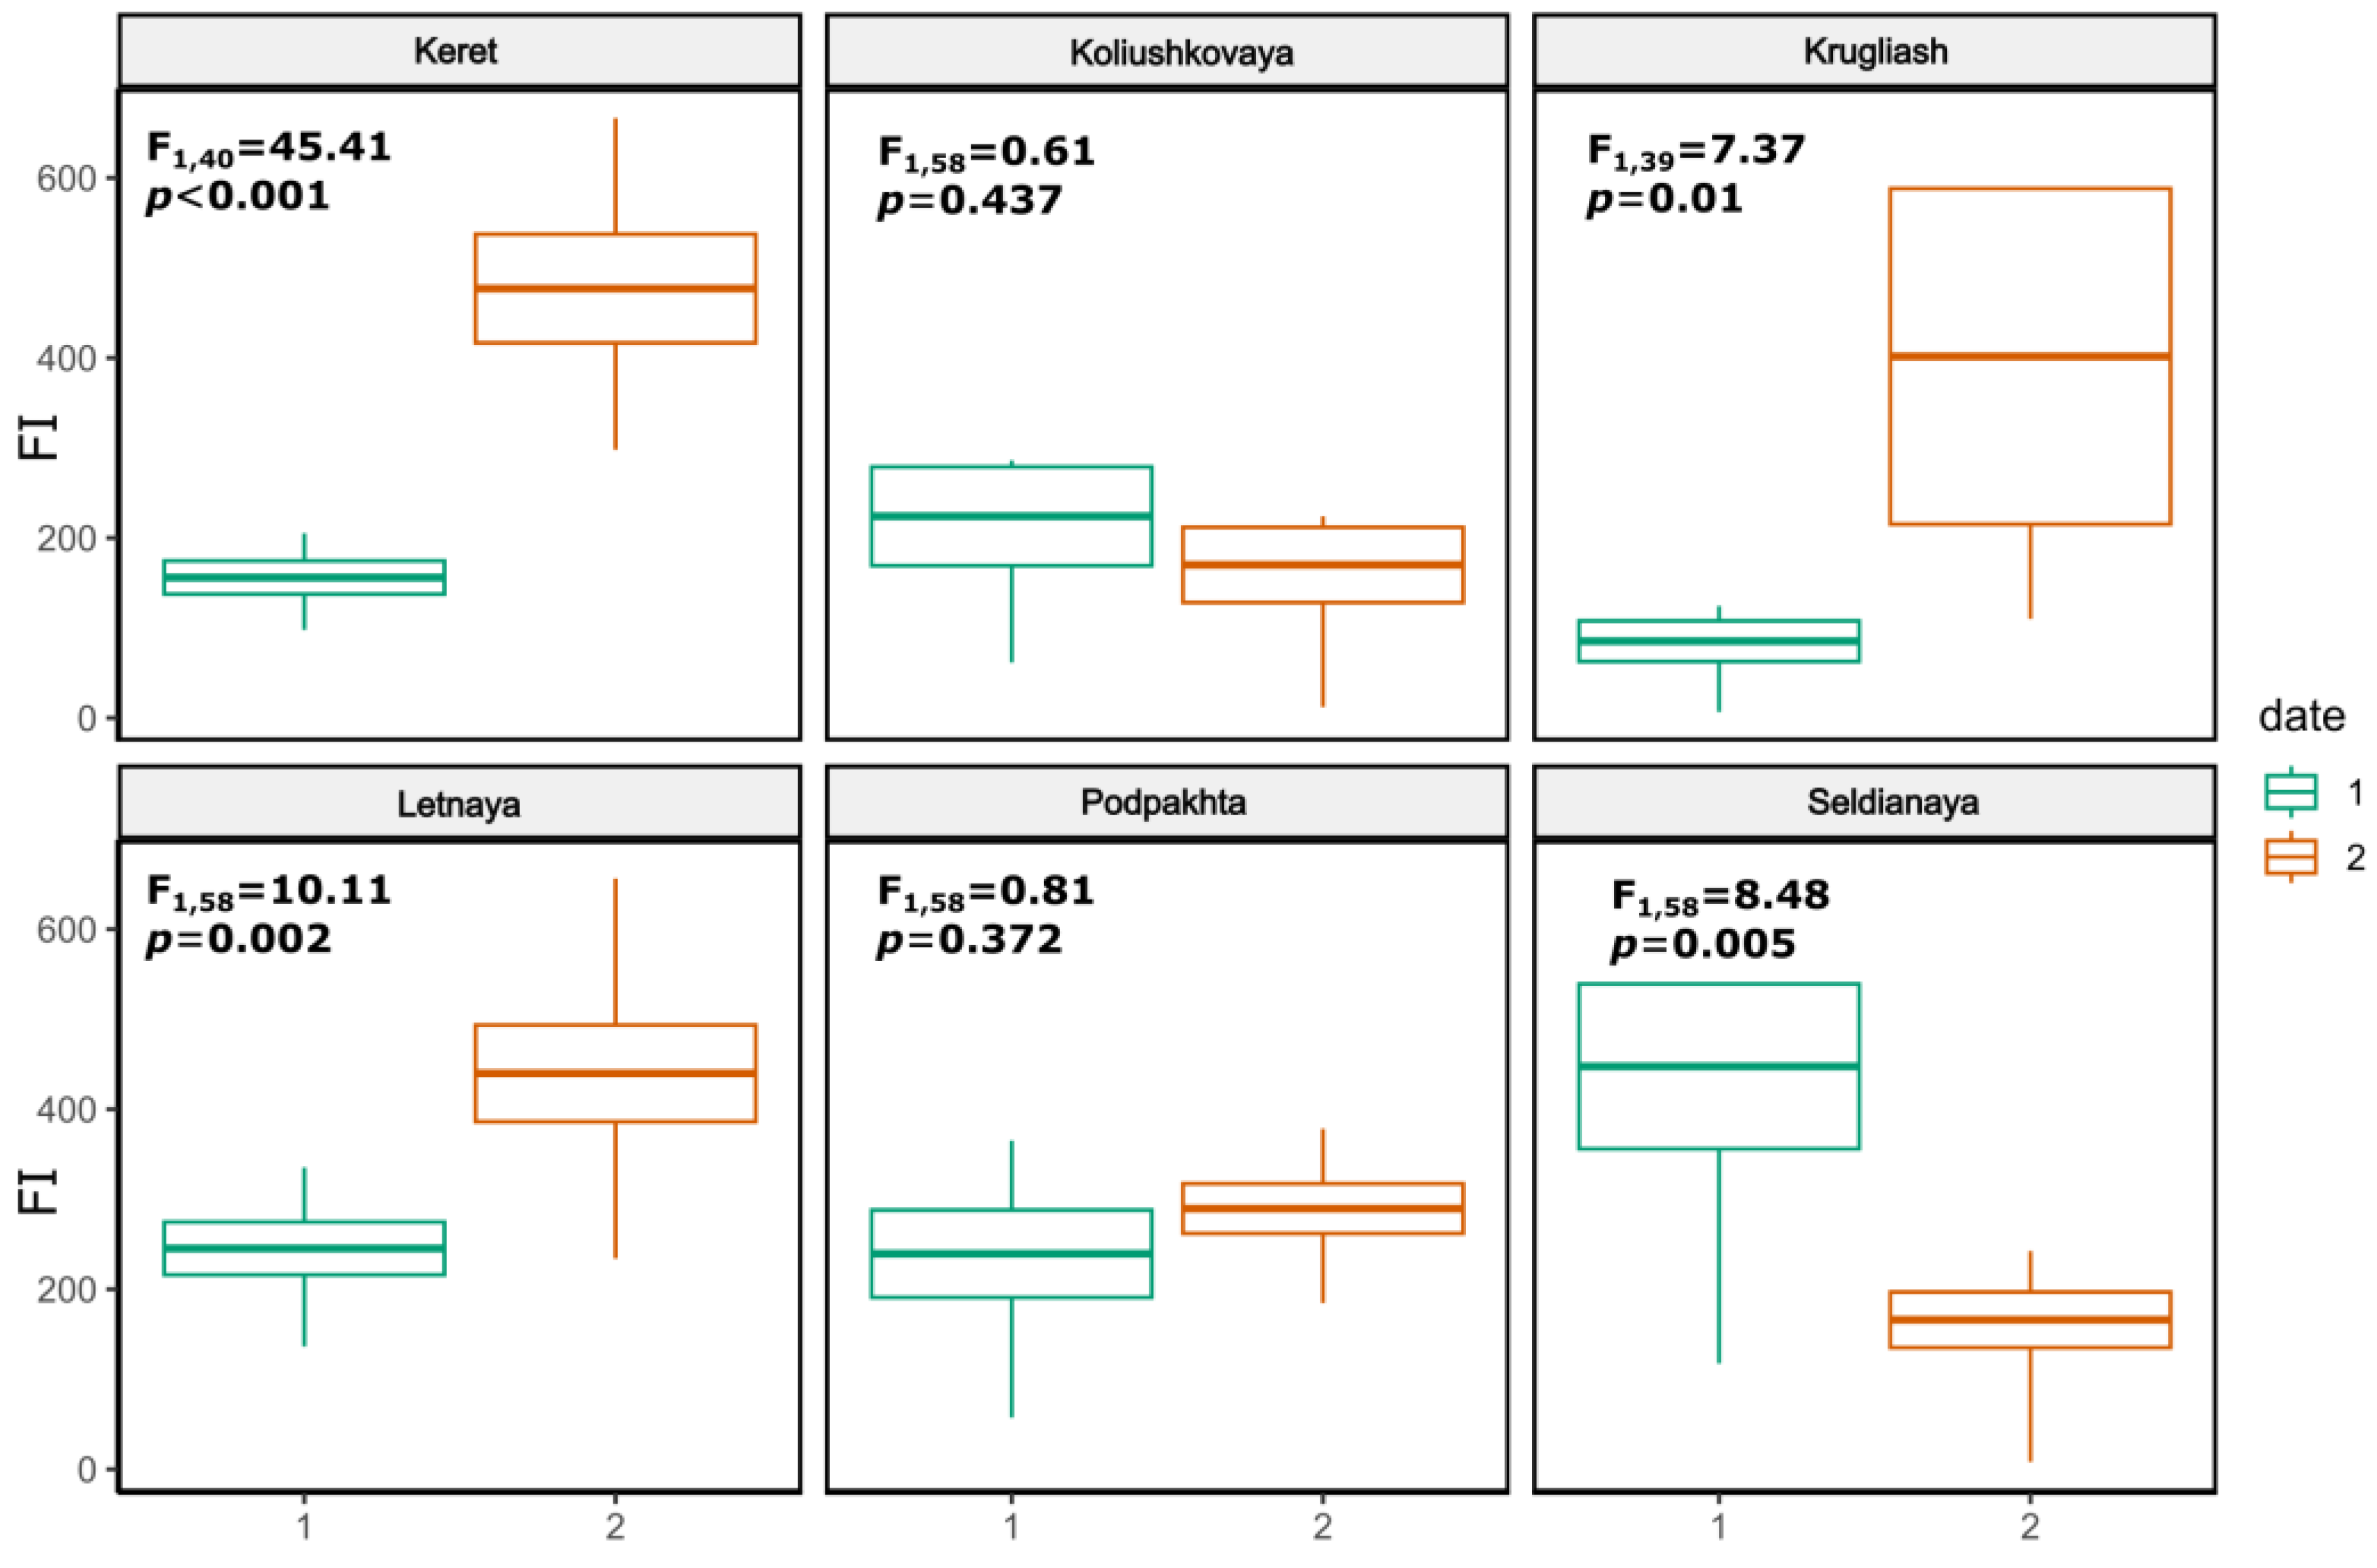
3.2. Feeding Intensity of Gasterosteus aculeatus

Feeding intensity, measured as the stomach fullness index (FI), significantly varied between early and late August (ANOVA, F5,311 = 8.88, p < 0.01) and between the sites within each of the two periods of sampling (early August: F5,174 = 5.74, p < 0.001; late August: F5,137 = 5.91, p < 0.001). The proportion of empty stomachs in juvenile sticklebacks never exceeded 20% and did not vary between the data and station, with a 9% mean for all sites in early August and 6% in late August.
FI varied between early and late August at all sites except Podpakhta and Koliushkovaya (Figure 3). At Seldianaya, FI decreased by 2.7 times from 447.5 ± 91.6‱ in early August (maximum value across all six sites) to 165.9 ± 30.8‱. At the other three sites, FI increased in late August, and at Krugliash (the rockweed site), mean FI increased 4.7 times from 85.3 ± 22.6‱ to 401.8 ± 101.6‱. Based on the regression analysis, the FI of individual fishes was significantly and inversely proportional to the abundance of juveniles (F1,321 = 9.429, R2 = 0.029 p = 0.0023).

3.3. Stomach Content Analysis

In total, 31 prey items were found in the stomachs of juvenile sticklebacks. The number of taxa found in the stomachs varied between sites and dates from 7 to 17, with an overall mean value of 13. The mean number of taxa per individual varied between 2.4 and 5.1 (mean = 3.9). The maximum taxonomic diversity in the stomach contents was observed in fish from Seldianaya and a minimum in Koliushkovaya. The mean number of taxa mostly contributing to the diet (evaluated using the D index) per fish was 2.7 (with a maximum of 3.5 and minimum of 1.9) based on abundance and 2.4 taxa (max 3.2, min 1.6) using the biomass of food items. The two-factor ANOVA demonstrated that the D index and number of taxa in individual stomachs of stickleback juveniles varied between the dates of sampling and sites (F5,282 = 5.58, p < 0.0001). The list of taxa mostly contributing to the diet varied between sites (Figure 4). The D-index did not show a significant correlation with FI (R = −0.04, p > 0.05 using abundance data and R = 0.07, p > 0.05 using biomass data).
The similarity percentage (SIMPER) analysis revealed five planktonic taxa that mostly contribute to the diet of juvenile sticklebacks. Of these, 22% of the heterogeneity among samples was explained by the abundance of Temora longicornis (Müller O.F., 1785), 9% was explained by Acartia longiremis (Lilljeborg, 1853), 13% by Podon leuckarti (G.O. Sars, 1862), 13% by Copepoda juv. (nauplii and copepoditii Copepoda), 6% by Microsetella norvegica (Boeck, 1865), and 13% by benthic Orthocladiinae larvae. The total heterogeneity among samples was 88%, and the changes in biomass of the above-mentioned species in the stomach content explained 75% of the spatial and temporal differences between the samples.
The most important planktonic component of the diet of juveniles was T. longicornis, observed in the stomach contents of juvenile sticklebacks at marine sites, contributing, on average, 32% to the total biomass of stomach contents (varying between 17 and 60%). It contributed to the significantly different diets between sites and sampling periods (ANOVA, F5–311 = 21.32, p < 0.0001). The only site where T. longicornis did not contribute significantly to the stomach content was Koliushkovaya lagoon, where A. longiremis prevailed in the diet of juvenile sticklebacks.
In early August, the highest proportion of this species in stomachs was found in Seldianaya (two-way ANOVA post hoc p < 0.05). In late August, the proportion of T. longicornis at Seldianaya was similar, and an increased proportion of this species in stomachs was observed at Keret (two-way ANOVA post hoc p < 0.001) and Podpakhta (two-way ANOVA post hoc p < 0.01).
The most important component of benthic feeding was Orthocladiinae larvae, contributing, on average, 17% to the stomach contents and reaching a maximum of 38%. No variation in the consumption of this species by stickleback juveniles was observed between sites and dates if a complete dataset was taken into use in the analysis (two-way ANOVA, F5–311 = 3.46, all post hoc p > 0.05). However, among the early August samples, a higher proportion of Orthocladiinae was observed in Seldianaya (ANOVA post hoc p < 0.01).
In general, planktonic taxa prevailed in the stomach contents both by density (up to 98%) and biomass (up to 95%) (see Figure 4 for details). Benthic species (nine taxa) significantly contributed to biomass (from 5% to 46%) only at a few sites and for a short period of time. Two-factor ANOVA demonstrated that the proportion of planktonic components in the diet of fishes did not vary between these two periods of observation (F5,282 = 2.5, p = 0.43) but varied between sites (F5,282 = 2.5, p < 0.05). The only site where benthic taxa significantly contributed to the diet of juvenile sticklebacks by biomass at both periods of observation was Krugliash (36% and 46%, respectively). The length of the juveniles (TL) did not have a significant effect on the proportion of benthic versus planktonic taxa in the stomach contents found using one-way ANOVA (F18,275 = 1.53, p = 0.07).
The two-way ANOSIM analysis implemented using the partial fullness index (PFI) revealed that both the date and site of sampling significantly affect the diet of juvenile sticklebacks (Table 2). Similar analyses conducted on three other input data (%Ii, %Qi, presence-absence of taxa) also yielded highly significant (p < 0.0001) R values for both the date (ANOSIM R values between 0.51 and 0.52) and site (R values between 0.23 and 0.29) factors. The diet of sticklebacks varied between sites significantly in each of the two sampling periods according to a one-way ANOSIM analysis (Table 2). Pairwise comparisons revealed that in early August (Date 1), all sites differed significantly from each other. In late August (Date 2), two pairwise site comparisons did not reveal significant differences (Letnaya-Keret) and (Keret-Podpakhta); the remainder were significant (Table 2).

3.4. Food Resources: Zooplankton

In total, 25 zooplankton taxa were recorded during the study, varying between 1 and 15 taxa per site. The taxonomic diversity of planktonic communities at marine sites was similar across the two periods of investigation. The most abundant taxa at marine sites were M. norvegica, T. longicornis, Oithona similis and P. leucartii. This group of taxa was observed at all sites except Koliushkovaya lagoon, yet the contribution of each taxon to the general abundance values was different across the sites and the two periods of study (Figure 4). In Koliushkovaya lagoon, only one zooplankton species was found—A. longiremis.
The diversity of zooplankton measured with the D-index using abundance (N) and biomass (B) values varied between sites and dates. According to the two-way ANOVA (factors ‘site’ and ‘date’), both the abundance and biomass of zooplankton varied significantly between sites (ANOVA, F1–5 = 2.62, p < 0.05), and the biomass of zooplankton significantly varied between the dates of sampling (ANOVA, F1–5 = 6.64, p < 0.05). The highest abundance and biomass values of zooplankton were observed in the lagoon (ANOVA post hoc p < 0.05). While no significant differences were found between zooplankton abundance at marine sites, eelgrass beds tend to show higher values in early August, while rocky shore and rockweed sites had a higher zooplankton abundance in late August (Table 3).

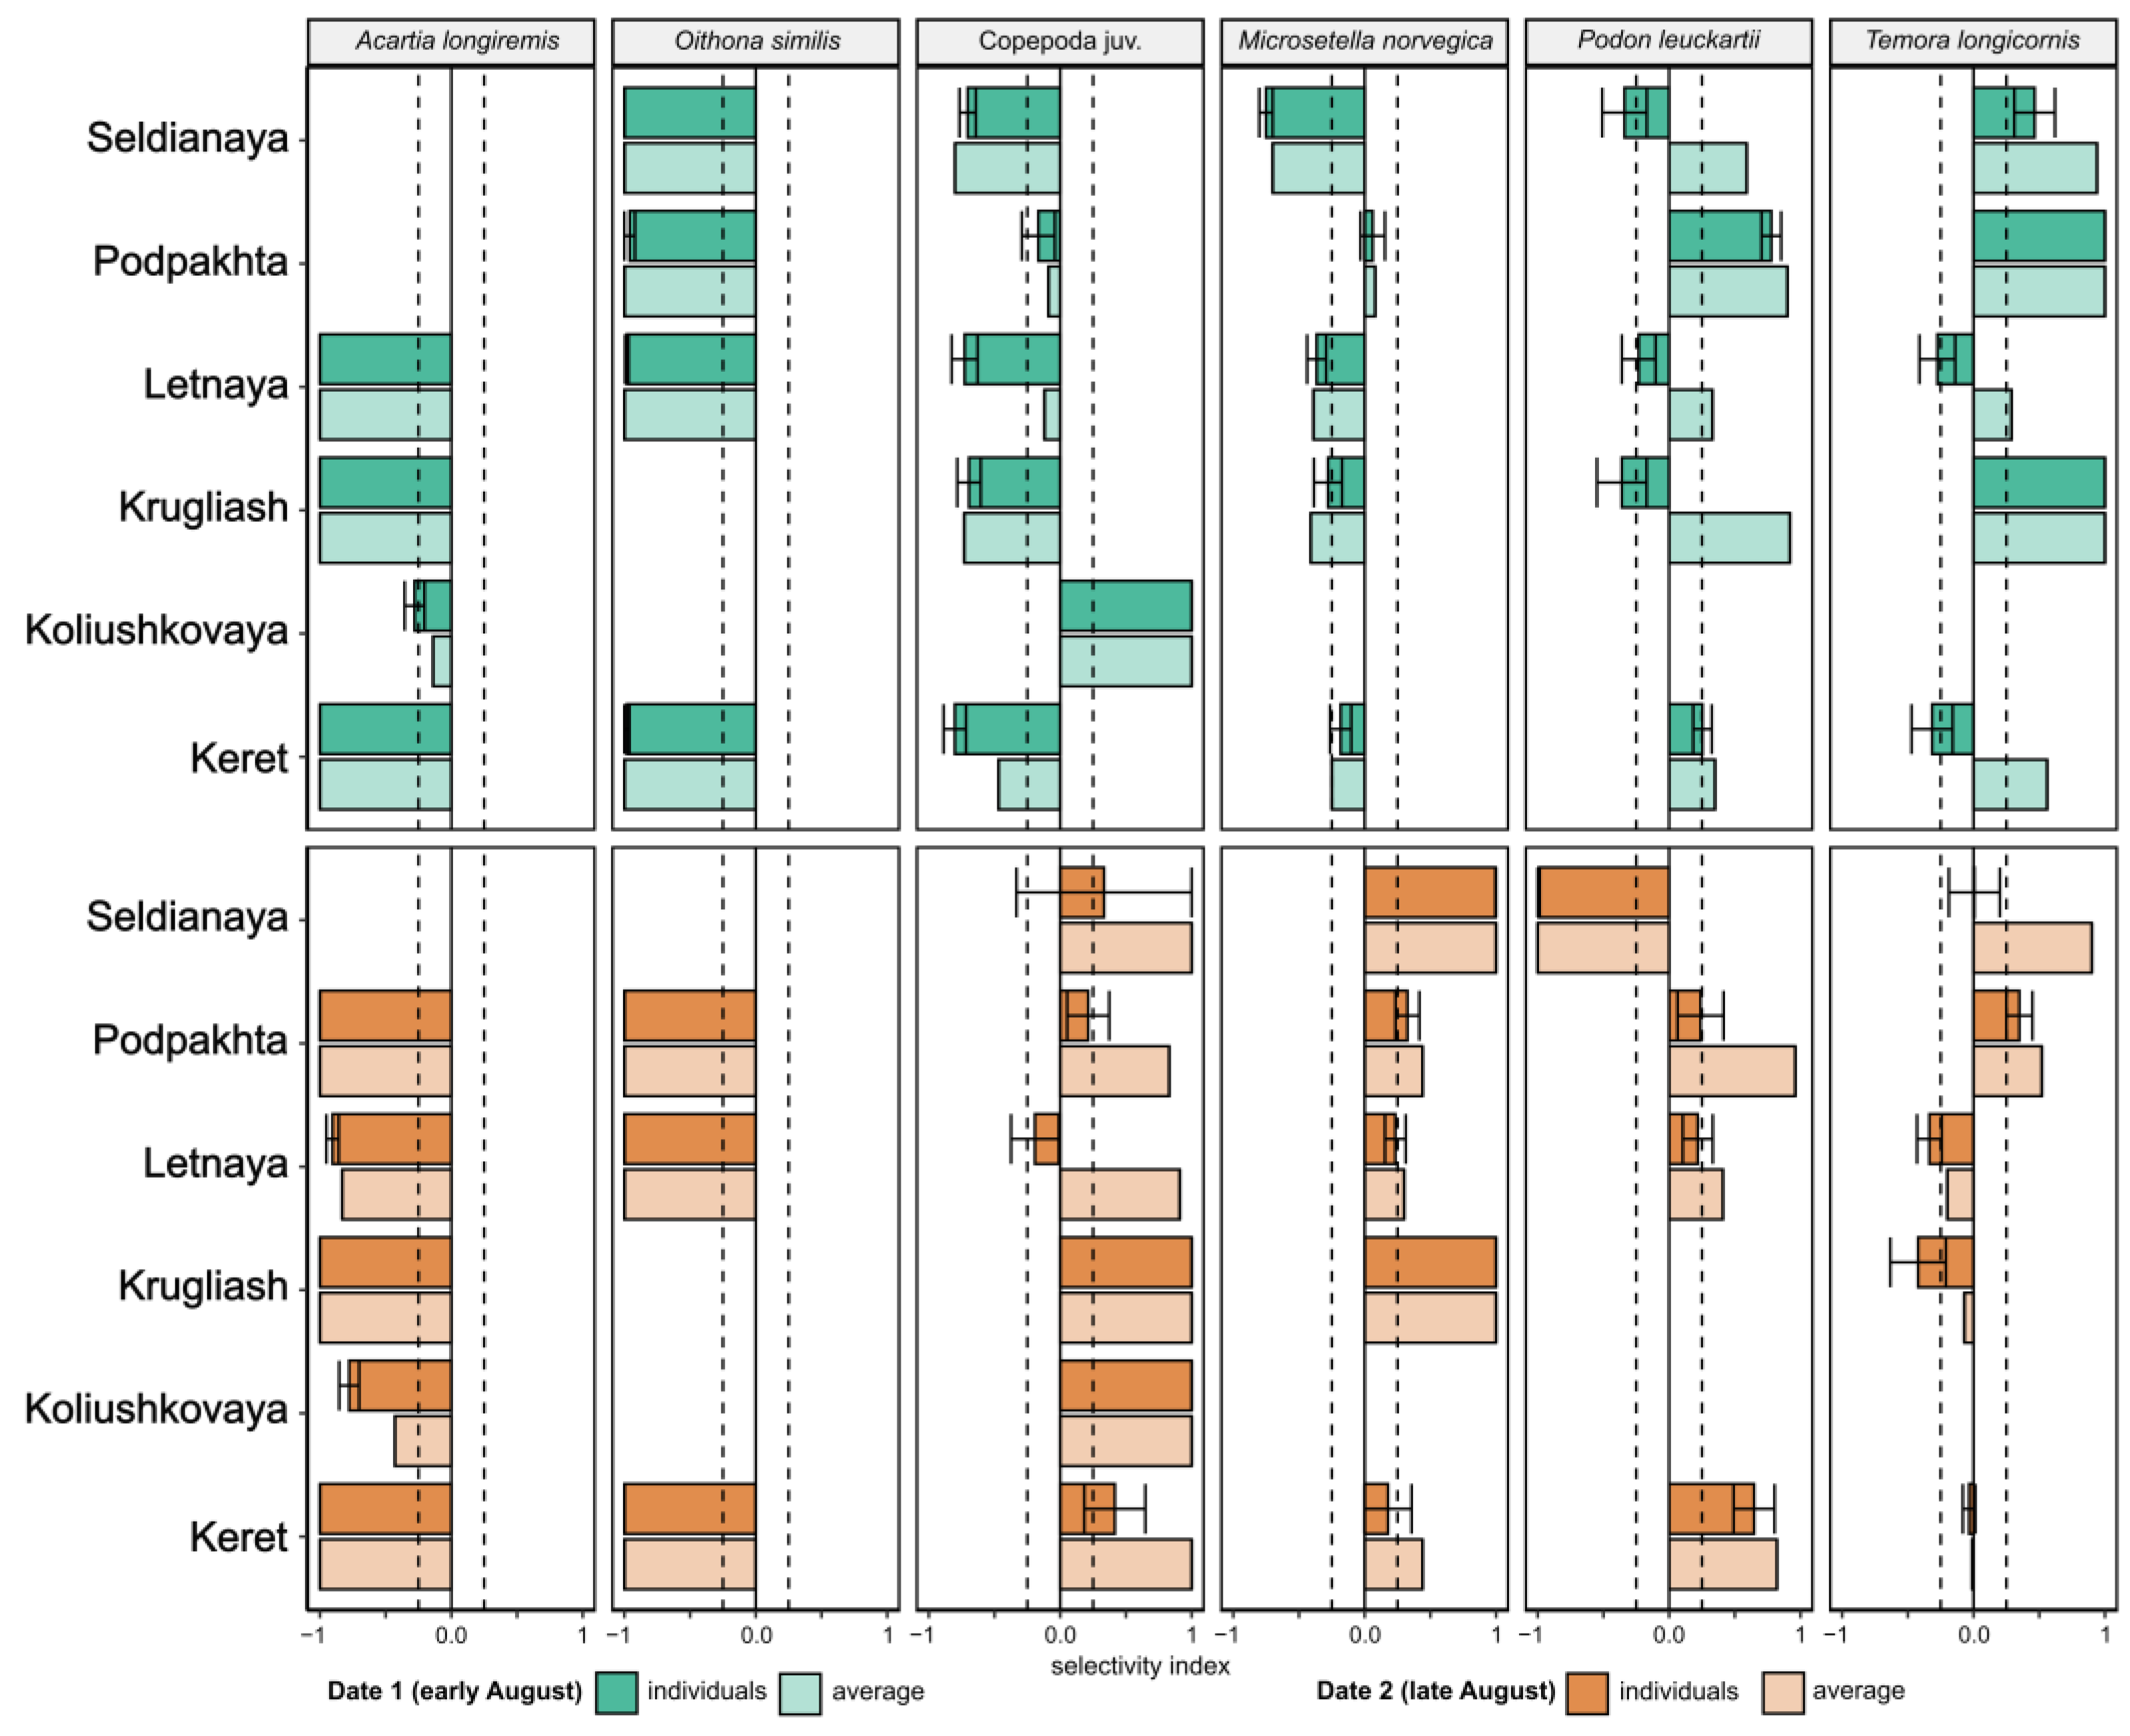
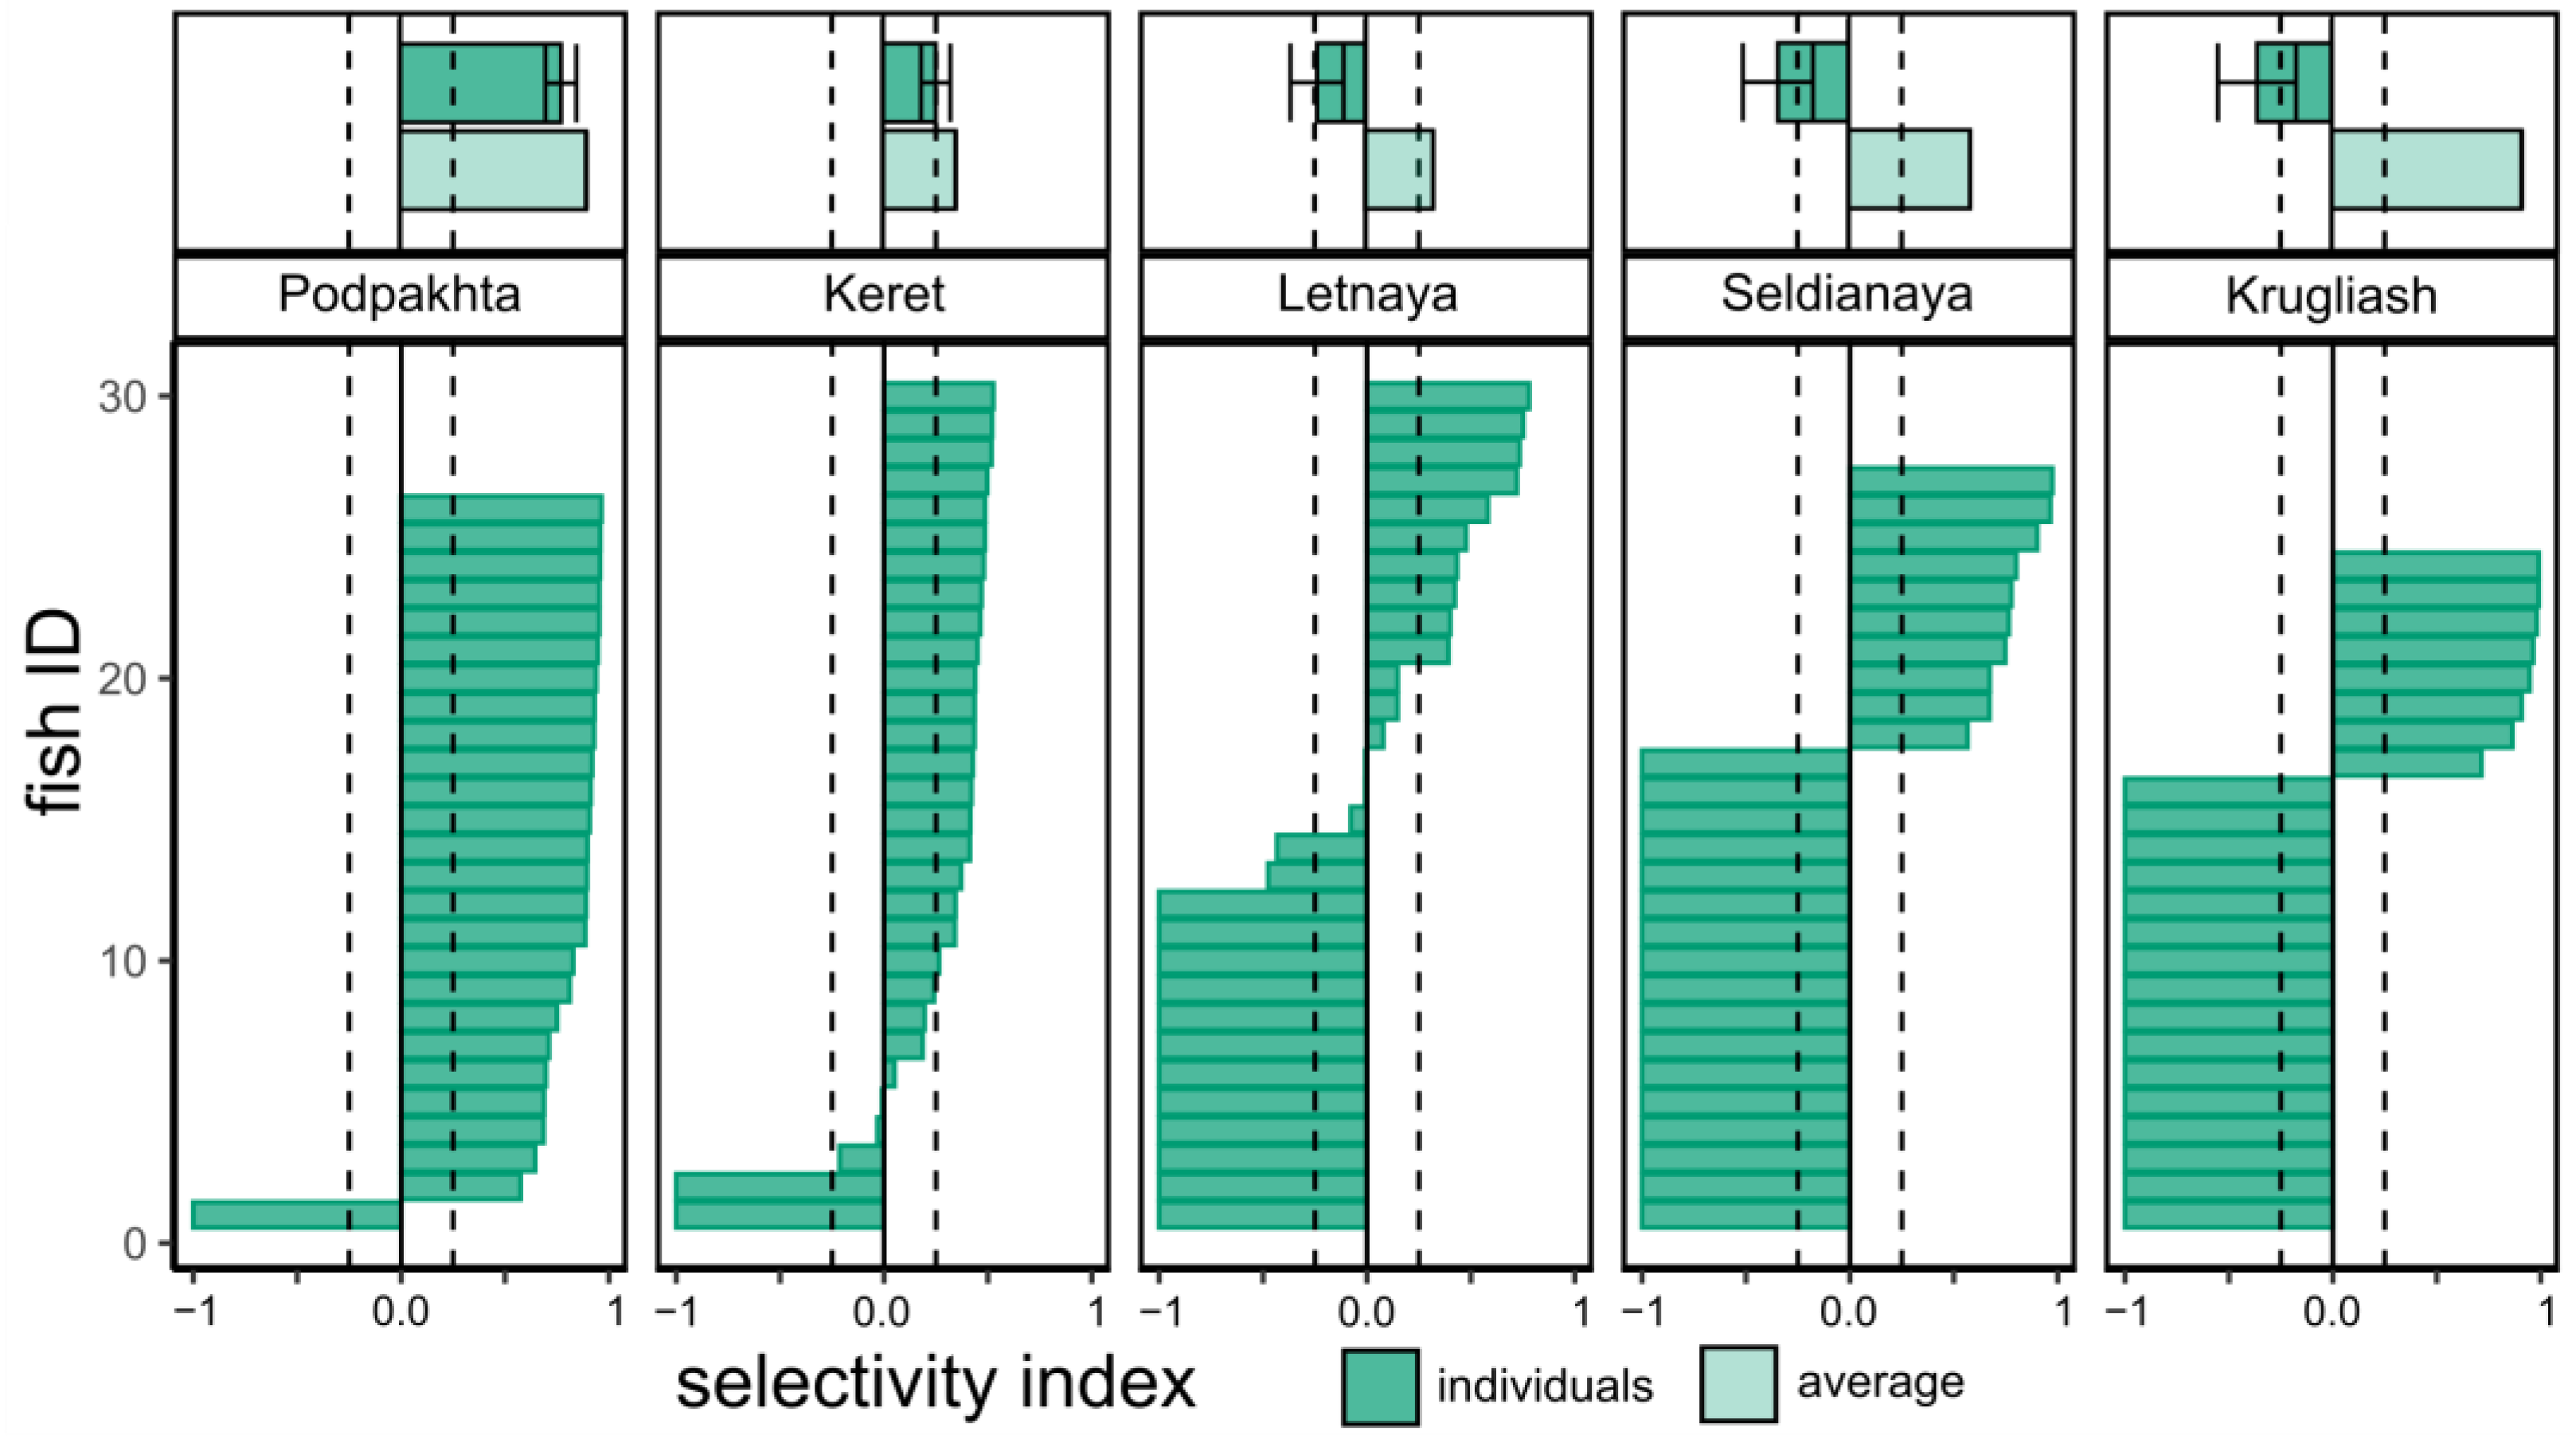
3.5. Food Selectivity

The calculation of Ivlev’s selectivity index E based on the food spectrum of individual fish yielded the following results. In early August (Figure 5), negative values of the E index lower than < −0.25 (i.e., avoidance of prey items) were observed for A. longiremis and O. similis at most sites, indicating that these species were found in zooplankton communities but were absent in the stomach contents of juvenile sticklebacks. The only exception for A. longiremis was marine lagoon Koliushkovaya, where E values varied between zero and −0.25. In M. norvegica, a mean value lower than <−0.25 was observed only at the eelgrass site of Seldianaya; at other sites, E varied between −0.25 and +0.25 for this species. Positive E values higher than 0.25 (prey selectivity) were observed for T. longicornis and P. leuckartii at the rockweed site of Podpakhta and for T. longicornis at another rockweed site, Krugliash. At the lagoon site, Copepoda juv. were selected by sticklebacks against a background of high negative values of E observed at other sites.
In late August, the stickleback still demonstrated an avoidance of A. longiremis and O. similis at most sites. Juvenile copepods (Copepoda juv.) were predated selectively at the lagoon and rockweed site Krugliash. The selective predation of stickleback juveniles on M. norvegica was also observed at Krugliash as well as at Seldianaya. No clear selectivity of T. longicornis was observed in late August; P. leuckartii was avoided at Seldianaya and positively selected at the rocky shore site of Keret (Figure 5).
Using the E index based on the values averaged per sample revealed that A. longiremis and O. similis were avoided by juvenile sticklebacks in early and late August. In A. longiremis, the values of the E index varied between −0.14 and −1 and were −1 for O. similis at all sites and dates. The early August values of E for T. longicornis were positive at all sites, reaching +1 and varied between −0.2 and +0.9 in late August. Similarly, the E index was positive for P. leuckartii in early August, but a highly negative (−1) value was demonstrated for Seldianaya in late August in contrast with other sites (Figure 5). Linear regression analysis did not reveal relationships between the TL of fish and the E index of each prey item.

4. Discussion

4.1. August Planktonic Food Resources of Juvenile Sticklebacks

In general, the zooplankton of the studied sites was represented by a boreal warm-water mass-related taxa assemblage typical of the coastal areas of the White Sea in summer [35]. The dominant group was Copepoda, reaching 90–100% of the total biomass and density of the whole zooplankton community with the addition of taxa belonging to Cladocera. These results correspond well with major studies of zooplankton in the region that describe Copepoda as the major contributing group to White Sea zooplankton [36,37].
The absolute zooplankton biomass varied between 38.5 and 5040 mg/m3 with a general mean of 779 mg/m3. When Koliushkovaya lagoon was excluded from the analysis, due to the exclusive dominance of A. longiremis, the total biomass of zooplankton in ‘open’ marine sites was 281 mg/m3. These values correspond well to the within-decadal variation in zooplankton biomass in Kandalaksha Bay between 140 and 257 mg/m3 [38]. These studies also indicate that zooplankton biomass is generally higher in coastal areas compared to the open sea [35].
Among the nursery grounds studied, the highest total biomass of zooplankton was observed in eelgrass (Zostera marina) beds. As dense eelgrass thickets significantly reduce water currents, this community located on the edge of subtidal and intertidal zones forms a unique habitat for both planktonic and benthic species [39,40]. Locally calm hydrodynamic conditions provide an optimal habitat for zooplankton [41,42] and, thus, support the extensive food resources for juvenile sticklebacks for which eelgrass beds are also a most important nursery habitat.

4.2. Size Structure and Abundance of Juvenile Sticklebacks at Nursery Grounds

The studied G. aculeatus nursery grounds can be subdivided into three types on the basis of stickleback juvenile abundance: habitats with constant abundance throughout the juvenile nearshore growth season, either constantly high or low, and habitats where the abundance of juveniles decreased from early to late August.
The exposed rocky shore—Keret—was the least optimal nursery ground, where the abundance of juvenile fish was constantly low. On the contrary, eelgrass beds—Seldianaya, Letnaya—and the marine lagoon were the most optimal nursery grounds and also the most important spawning ground for adult sticklebacks [22]. While rockweed sites—Krugliash and Podpakhta—demonstrated a high abundance of juveniles in early August, these significantly decreased at the end of the growing season. At two of the three eelgrass bed sites studied (Seldianaya and marine lagoon Koliushkovaya), the abundance of juveniles was high during the whole growing season (Figure 2). The mean length of juveniles at all three eelgrass sites also increased by the end of August, indicating the successful growth and survival of fish. These results correspond well to data from aquarium experiments that demonstrate how juvenile sticklebacks prefer eelgrass to rockweed habitat. Eelgrass beds are presumed to provide shelter for juvenile sticklebacks and other juvenile fish from predators; thus, the survival rate of juveniles in this nursery habitat is high [39,40,43,44,45].

4.3. Feeding Intensity in G. aculeatus Juveniles

In this study, the feeding intensity of fish was evaluated using the index of stomach fullness (FI) [23,24]. Fish with empty stomachs never exceeded 20%, indicating both suitable conditions for feeding and active feeding behavior at the sites studied. Previously, higher values of 60–80% of fish with empty stomachs were reported. These values are linked to temperature conditions and the availability of food [46,47,48]. Our findings on FI variation among the sites studied and over the two periods of the stickleback spawning season correspond well with the data from Abdel-Malek, 1968 [48]. During that time, FI in juvenile sticklebacks varied between 50 and 456 ‱, producing very similar values to this study. Recent data on Baltic Sea populations also demonstrated similar values [20]. Feeding intensity was not related directly to the type of nursery ground but was related to the abundance of juveniles. Fish from samples with a lower abundance were characterized by a higher feeding intensity regardless of the period of sampling.

4.4. Stomach Content in Juvenile G. aculeatus

In total, 31 prey items were recorded in the stomachs of juvenile sticklebacks, varying between 7 and 17 in various nursery habitats. According to studies conducted in the 1960s [48], the number of taxa in the stomach contents varied between 5 and 25, indicating the same level of diversity of prey objects in the stickleback diet throughout a five-decade period between studies. In general, juvenile sticklebacks were found to be planktivorous, as planktonic taxa prevailed in the stomach content by abundance and biomass. Among the diversity of prey items, nine benthic taxa were found in the stomachs, rarely contributing up to 46% of biomass to the stomach content. Krugliash was the only site where benthic taxa were important for the stickleback diet during both early (36%) and late (46%) August.
The prevalence of planktonic diet in juvenile stickleback diet has previously been reported from the White Sea [21,43], the Baltic Sea [49], and freshwater lakes in the British Isles [50]. In adult White Sea three-spined sticklebacks, the diversity of prey items is also comparable [18], and similar values of the diversity of prey items were observed in nine-spined stickleback P. pungitius from lacustrine environments despite the fact that adult fish were mostly considered in the study [51].
The D index and number of taxa in individual stomachs varied significantly between the dates and sites and did not correlate with FI. The fish diet varied between early and late August, and no relationship between the size of fish (TL) and the taxonomic richness of prey items in stomachs was observed. No clear differentiation between the taxonomic richness of prey items consumed by stickleback juveniles in relation to the particular type of marine nursery ground was found. Nevertheless, within each sampling period, the diversity of prey items observed in the stomachs was significantly different between most sites, with minor exceptions indicating differences in the availability of prey items. The highest number of ‘effective’ taxa (i.e., mostly contributing to the diet of fish based on the calculation of the D index) was observed in Letnaya and Podpakhta (4.6 ± 0.16 and 4.5 ± 0.16), contrasting with the marine lagoon Koliushkovaya where the lowest number of effective taxa (2.52 ± 0.14) was found in fish diet. At the eelgrass site Seldianaya, the diversity of prey items was highest in early August and, on average, in late August. In the stomachs of individual fish, 2–5 prey items were observed, indicating that. despite the broad taxonomic range of potential prey items found in the stomachs at each site, these <5 prey items prevailed in the fish diet. According to our data, 70% of the fish diet was described as ‘effective’, and the other 30% were randomly consumed. Across all the sites studied, two taxa were the most important contributors to the diet of juvenile sticklebacks, namely T. longicornis and Orthocladiinae, similar to the data from Seldianaya obtained earlier [21], with the only exception of the marine lagoon, where A. longiremis overwhelmingly prevailed in the zooplankton. In late August samples, the proportion of T. longicornis was higher, probably indicating that, with the growth of individual fishes, their ability to catch this crustacean increased. The consumption of chironomid larvae (Orthocladiinae) via stickleback larvae probably indicates the patchy distribution of this prey item. Chironomids are common and an important element of fish diets in marine and freshwater ecosystems [4,50,51,52].
When Orthocladiinae is present in the stomach contents of juvenile sticklebacks, they represent the majority of the food biomass consumed, while T. longicornis occurs evenly across the individual fish within the sample. On average, three individuals of Orthocladiinae were observed per stomach of G. aculeatus, with a maximum of eight larvae. No differences in the consumption rate of Orthocladiinae were observed between the sites and dates of sample collection. A comparison of the consumption of other effective taxa by stickleback juveniles revealed that the consumption of P. leuckartii varied significantly among sites only, while the consumption of T. longicornis, M. norvegica, Copepoda juv., and A. longiremis varied between both sampling dates and sites. The observed spatial and temporal variability in the diet of juvenile sticklebacks corresponds well with the previous findings [29,48,49,53].

4.5. Prey Selectivity by Juvenile Sticklebacks in the White Sea

Prey selectivity has previously been studied in both adult and juvenile three-spined sticklebacks, yet these studies were mostly implemented using aquarium experiments or in freshwater environments and were more often focused on adult fishes. Yet, these studies contributed significantly to an understanding of the role of local hydrology in trophic preferences [54], the profitability and visual characteristics of prey items [55], and competition with other species within the same habitat [56,57], with a special focus on ecosystems where the three-spined stickleback is a non-native species [58,59]. As the body size of sticklebacks is comparable to many macroinvertebrate predators (e.g., insect larvae), potential overlaps in their dietary preferences were also considered [60]. One of the most detailed descriptions of dietary shifts in sympatric species of sticklebacks, including G. aculeatus, P. pungitius, G. wheatlandi, and Apeltes quadractus, was implemented at tidal saltmarsh spawning grounds in Canada [61]. This study considered seasonal dynamics in the selective feeding of sticklebacks from early summer when adults came to the spawning grounds in late August and when both adults and juveniles were present in the samples [61].
In our study, in early August, T. longicornis was selectively preferred by juvenile sticklebacks (Ivlev’s E index values up to 1) at all sites studied, based on the E index averaged per sample. Considering individually calculated E index values, similar results or neutral selectivity were obtained. The selectivity for T. longicornis (mean body size 0.56 ± 0.003 mm) varied among sites in late August when both ways of calculating the E index were applied. While E index values for average fish varied from −0.2 to + 0.9 at various sites, individual data yielded values between −0.42 and + 0.34, both indicating neutral or even avoiding a pattern of selectivity for this species. A similar seasonal variation in selectivity by sticklebacks was observed for P. leuckartii. At most sites, this species was selected positively during early August. In late August, the positive selectivity for this species was observed at Keret (reaching +0.64 by individuals and +0.8 by average fish). On the contrary, P. leuckartii was avoided by juveniles at Seldianaya in late August, according to both methods of calculating the E index.
Two prey taxa (M. norvegica and Copepoda juv.), as the smallest organisms in the stickleback diet, were considered, demonstrating opposing patterns of selectivity over the two periods of observation. The mean size of M. norvegica was 0.41 ± 0.001 mm, and Copepoda juv. was mainly represented by nauplii Copepoda (0.11 ± 0.001 mm). These taxa were among the prey items of mainly smaller juvenile sticklebacks. Both prey items were negatively or neutrally selected in early August (E from −0.75 to +0.06 for M. norvegica and from −0.8 to −0.16 for Copepoda juv.) and positively or neutrally selected in late August (E from +0.23 to +1 for M. norvegica and from −0.19 to +1 for Copepoda juv.). A plausible explanation for the change in dietary preferences of these fish might be that this shift is linked to changes in the abundance of prey items. In early August, both M. norvegica and Copepoda juv. each contributed about 15–20% to the total zooplankton biomass (Figure 4). Later, their abundance in the zooplankton decreased, but small sizes of juvenile sticklebacks were still present at the nursery grounds due to the extended spawning period (Figure 2). The observed decrease in the abundance of M. norvegica and Copepoda juv. in zooplankton might be related either to seasonal trends or be a consequence of selective feeding by juvenile sticklebacks.
Several dominant planktonic taxa were mostly avoided by sticklebacks. In both periods of observation, O. similis was avoided at all sites where this species was present in the zooplankton (see Figure 3 and Figure 4 for details). As the size of individual O. similis (0.4 ± 0.005 mm) is similar to M. norvegica, differential selectivity patterns for these two species can be linked to several factors. First, M. norvegica (as in many other Harpacticoida) is bright-colored (red to orange). As the same part of the spectrum is recognized by at least female sticklebacks during the mating season [62], this can potentially increase the visibility of this species for juvenile sticklebacks. Second, these species demonstrate very different swimming behaviors. Despite spending most of their time motionless, cyclopoids of the genus Oithona (e.g., O. plumifera) are able to jump fast for up to 20 body lengths (speed 22.1 mm/s) and almost exclusively upwards [63]. This behavior can be beneficial for O. similis to avoid attacks by sticklebacks. On the contrary, M. norvegica demonstrated a very slow swimming velocity (0.6 mm/s) [64], and even T. longicornis, almost always selected by sticklebacks, had a speed of 5.9 mm/s in adults, and lower values during early life stages [65].
Another species selectively avoided (E index values mostly around −1) by juvenile sticklebacks was A. longiremis at nearly all sites and over both periods. In zooplankton communities, this species reached about 60% of the total biomass, and in the marine lagoon, Koliushkovaya reached 100% of the total biomass. Considering that the FI of stickleback juveniles at this site was generally low (Figure 3), it is possible to assume that this is a case of forced feeding on the only available prey item despite high prey availability. The possible evidence for forced dietary preferences in the lagoon is that selectivity for the second prey item group available—Copepoda juv.—was highly positive despite its remarkably low abundance in the zooplankton. This probably indicates that when individual fish find the larvae of copepods (remarkably, this group can also include early stages of A. longiremis to some extent), feeding on them is preferred, and if not, the only available food is adult A. longiremis.
While a comparison of the two methods of calculating the E index mostly yielded similar results, the following three cases can be considered: (1) E index values calculated per individual and per average fish both simultaneously indicated either very high or very low positive selectivity, (2) each index indicated values within the ‘neutral’ selectivity zone between −0.25 and +0.25, (3) the averaged fish index indicated positive selectivity while the individual-based index indicated slightly negative or neutral selectivity. Individual variation in the prey selectivity for P. leuckartii by G. aculeatus at various sites in early August is a good example of these three patterns (Figure 6). Thus, the conventional way of calculating the E index, i.e., the values calculated per average fish at the nursery ground (i.e., local population), mostly indicated a general trend of prey selectivity by individual stickleback populations at each nursery ground. On the contrary, individual E values provided more accurate estimates and indicated sites and dates where various fish within the sample had different consumption levels of prey items by individuals within the local population.

5. Conclusions

This study provides several insights into the prey selectivity of the juvenile three-spined sticklebacks of Gasterosteus aculeatus in several types of nursery ground habitats during their early and late phases of active growth in inshore waters during their first summer in the White Sea.
Nursery grounds were classified into three categories based on the abundance of juvenile sticklebacks. Eelgrass beds were found to be the most optimal nursery grounds, with consistently high juvenile abundance and successful growth and survival. By contrast, exposed rocky shores were the least optimal, with consistently low juvenile abundance. The stomach content analysis indicated that the percentage of fish with empty stomachs was generally low, indicating suitable feeding conditions and active feeding behavior among juvenile sticklebacks. Feeding intensity was correlated with the abundance of juveniles, with a higher feeding intensity observed in samples with a lower abundance. The diet of juvenile sticklebacks was primarily planktonic. Benthic taxa played a significant role in the diet at specific sites, particularly in the rockweed habitat. The diversity of prey items varied between sites and sampling periods, with a few dominant prey items making up the majority of their diet. Juvenile sticklebacks exhibited prey selectivity, with preferences for certain prey items in early August. However, prey selectivity patterns varied among the sites and time periods, indicating the influence of local factors and prey availability. Some prey items, such as A. longiremis, were selectively avoided, while others, like T. longicornis and P. leuckartii, were positively selected. Seasonal changes in prey availability appeared to influence the dietary preferences of juvenile sticklebacks. This study found that selectivity for specific prey items shifted between early and late August, potentially in response to changes in prey abundance.

Author Contributions

Conceptualization, methodology, writing—original draft preparation, A.S.G.-Y.; sampling, A.S.G.-Y., N.V.P., M.V.I. and T.S.I.; laboratory analysis and data analysis, A.S.G.-Y., N.V.P. and E.A.G.-Y.; writing—review and editing, A.S.G.-Y., E.A.G.-Y., D.L.L. and M.V.I.; funding acquisition, M.V.I., A.S.G.-Y. and E.A.G.-Y. All authors have read and agreed to the published version of the manuscript.

Funding

This research was funded by the Russian Science Foundation, (project No. RSF 22-24-00956).

Institutional Review Board Statement

Not applicable.

Data Availability Statement

Data are contained within the article.

Acknowledgments

The authors would like to thank the staff of the Education and Research station “Belomorskaya” of Saint Petersburg State University and our colleagues at the Department of ichthyology and hydrobiology of Saint Petersburg State University for their support and collaboration. Also, we would like to thank James Scourse, Chris Lowe (University of Exeter) and two anonymous reviewers for their input towards increasing the reading quality of the manuscript.

Conflicts of Interest

The authors declare no conflict of interest. The funders had no role in the design of the study; in the collection, analyses, or interpretation of data; in the writing of the manuscript; or in the decision to publish the results.

References

  1. Van De Wolfshaar, K.E.; Barbut, L.; Lacroix, G. From Spawning to First-Year Recruitment: The Fate of Juvenile Sole Growth and Survival under Future Climate Conditions in the North Sea. ICES J. Mar. Sci. 2022, 79, 495–505. [Google Scholar] [CrossRef]
  2. Doyle, M.J.; Strom, S.L.; Coyle, K.O.; Hermann, A.J.; Ladd, C.; Matarese, A.C.; Shotwell, S.K.; Hopcroft, R.R. Early Life History Phenology among Gulf of Alaska Fish Species: Strategies, Synchronies, and Sensitivities. Deep Sea Res. Part II Top. Stud. Oceanogr. 2019, 165, 41–73. [Google Scholar] [CrossRef]
  3. Robert, D.; Shoji, J.; Sirois, P.; Takasuka, A.; Catalán, I.A.; Folkvord, A.; Ludsin, S.A.; Peck, M.A.; Sponaugle, S.; Ayón, P.M.; et al. Life in the Fast Lane: Revisiting the Fast Growth—High Survival Paradigm during the Early Life Stages of Fishes. Fish Fish. 2023, 24, 863–888. [Google Scholar] [CrossRef]
  4. Westrelin, S.; Balzani, P.; Haubrock, P.J.; Santoul, F. Interannual Variability in the Trophic Niche of Young-of-year Fish Belonging to Four Piscivorous Species Coexisting in a Natural Lake. Freshw. Biol. 2023, 68, 487–501. [Google Scholar] [CrossRef]
  5. Wells, R.A.; McNeil, W.J. Effect of Quality of the Spawning Bed on Growth and Development of Pink Salmon Embryos and Alevins; US Department of the Interior, Bureau of Commercial Fisheries: Washington, DC, USA, 1970.
  6. Van Deurs, M.; Persson, A.; Nilsson, P.A.; Jørgensen, C. Fish Resist Temptation from Junk Food: State-dependent Diet Choice in Reproductive Atlantic Cod Gadus Morhua Facing Seasonal Fluxes of Lipid-rich Prey. Oikos 2022, 2022, oik.08739. [Google Scholar] [CrossRef]
  7. Byström, P.; Persson, L.; Wahlström, E. Competing Predators and Prey: Juvenile Bottlenecks in Whole-Lake Experiments. Ecology 1998, 79, 2153–2167. [Google Scholar] [CrossRef]
  8. Okun, N.; Mehner, T. Distribution and Feeding of Juvenile Fish on Invertebrates in Littoral Reed (Phragmites) Stands. Ecol. Freshw. Fish 2005, 14, 139–149. [Google Scholar] [CrossRef]
  9. Lajus, D.L.; Alekseeva, Y.I.; Lajus, J.A. Herring Fisheries in the White Sea in the 18th–Beginning of the 20th Centuries: Spatial and Temporal Patterns and Factors Affecting the Catch Fluctuations. Fish. Res. 2007, 87, 255–259. [Google Scholar] [CrossRef]
  10. Evseenko, S.A.; Mishin, A.V. On the Distribution of Larvae and Localization of Spawning Stocks of White Sea Herring Clupea pallasii marisalbi. J. Ichthyol. 2011, 51, 776–787. [Google Scholar] [CrossRef]
  11. Semenova, A.V.; Stroganov, A.N.; Ponomareva, E.V.; Afanas’ev, K.I.; Vilkina, O.V. Large-Scale Genetic Structure and Diversity of Arctic Rainbow Smelt Osmerus dentex Steindachner et Kner, 1870 throughout Its Distributional Range Based on Microsatellites. Polar Biol. 2021, 44, 927–940. [Google Scholar] [CrossRef]
  12. Lajus, D.; Ivanova, T.; Rybkina, E.; Lajus, J.; Ivanov, M. Multidecadal Fluctuations of Threespine Stickleback in the White Sea and Their Correlation with Temperature. ICES J. Mar. Sci. 2021, 78, 653–665. [Google Scholar] [CrossRef]
  13. Cusa, M.; Berge, J.; Varpe, Ø. Seasonal Shifts in Feeding Patterns: Individual and Population Realized Specialization in a High Arctic Fish. Ecol. Evol. 2019, 9, 11112–11121. [Google Scholar] [CrossRef] [PubMed]
  14. Hure, M.; Mustać, B. Feeding Ecology of Sardina pilchardus Considering Co-Occurring Small Pelagic Fish in the Eastern Adriatic Sea. Mar. Biodivers. 2020, 50, 40. [Google Scholar] [CrossRef]
  15. Kingsford, M.J. Drift Algae and Small Fish in Coastal Waters of Northeastern New Zealand. Mar. Ecol. Prog. Ser. 1992, 80, 41–55. [Google Scholar] [CrossRef]
  16. Hoch, J.M.; Cabanelas Bermudez, A.; Coury, O.S.; Donahou, A.S.; Jeffers, C.N.; LaMartina, M.; Ramsaran, D.; Spadafore, S. The Influence of Personality on Small Fish Migration and Dispersal in the Everglades. Wetlands 2019, 39, 991–1002. [Google Scholar] [CrossRef]
  17. Lajus, D.L.; Golovin, P.V.; Zelenskaia, A.E.; Demchuk, A.S.; Dorgham, A.S.; Ivanov, M.V.; Ivanova, T.S.; Murzina, S.A.; Polyakova, N.V.; Rybkina, E.V. Threespine Stickleback of the White Sea: Population Characteristics and Role in the Ecosystem. Contemp. Probl. Ecol. 2020, 13, 132–145. [Google Scholar] [CrossRef]
  18. Genelt-Yanovskaya, A.S.; Polyakova, N.V.; Ivanov, M.V.; Nadtochii, E.V.; Ivanova, T.S.; Genelt-Yanovskiy, E.A.; Tiunov, A.V.; Lajus, D.L. Tracing the Food Web of Changing Arctic Ocean: Trophic Status of Highly Abundant Fish, Gasterosteus aculeatus (L.), in the White Sea Recovered Using Stomach Content and Stable Isotope Analyses. Diversity 2022, 14, 955. [Google Scholar] [CrossRef]
  19. Jakubavičiūtė, E.; Casini, M.; Ložys, L.; Olsson, J. Seasonal Dynamics in the Diet of Pelagic Fish Species in the Southwest Baltic Proper. ICES J. Mar. Sci. 2016, 74, 750–758. [Google Scholar] [CrossRef]
  20. Demchuk, A.S.; Uspenskiy, A.A.; Golubkov, S.M. Abundance and Feeding of Fish in the Coastal Zone of the Neva Estuary, Eastern Gulf of Finland. Boreal Environ. Res. 2021, 26, 1. [Google Scholar]
  21. Demchuk, A.; Ivanov, M.; Ivanova, T.; Polyakova, N.; Mas-Martí, E.; Lajus, D. Feeding Patterns in Seagrass Beds of Three-Spined Stickleback Gasterosteus aculeatus Juveniles at Different Growth Stages. J. Mar. Biol. Assoc. UK 2015, 95, 1635–1643. [Google Scholar] [CrossRef]
  22. Ivanova, T.S.; Ivanov, M.V.; Golovin, P.V.; Polyakova, N.V.; Lajus, D.L. The White Sea Threespine Stickleback Population: Spawning Habitats, Mortality, and Abundance. Evol. Ecol. Res. 2016, 17, 301–315. [Google Scholar]
  23. Garrido, S.; Murta, A.G.; Moreira, A.; Ferreira, M.J.; Angélico, M.M. Horse Mackerel (Trachurus trachurus) Stomach Fullness off Portugal: Index Calibration and Spatio-Temporal Variations in Feeding Intensity. ICES J. Mar. Sci. 2008, 65, 1662–1669. [Google Scholar] [CrossRef]
  24. Hureau, J.-C. Biologie Cornparee de Quelques Poissons Antarctiques (Nototheniidae); Bull. Inst. Océanogr: Monaco, France, 1970. [Google Scholar]
  25. Amundsen, P.; Sánchez-Hernández, J. Feeding Studies Take Guts—Critical Review and Recommendations of Methods for Stomach Contents Analysis in Fish. J. Fish Biol. 2019, 95, 1364–1373. [Google Scholar] [CrossRef] [PubMed]
  26. Hyslop, E.J. Stomach Contents Analysis—A Review of Methods and Their Application. J. Fish Biol. 1980, 17, 411–429. [Google Scholar] [CrossRef]
  27. Jost, L. Entropy and Diversity. Oikos 2006, 113, 363–375. [Google Scholar] [CrossRef]
  28. Ivlev, V.S. Experimental Ecology of the Feeding of Fishes; Pishchepromizdat: Moscow, Russia, 1955. [Google Scholar]
  29. Wootton, R.J. A Functional Biology of Sticklebacks, 1st ed.; Calow, P., Ed.; Croom Helm: London, UK, 1984. [Google Scholar]
  30. Zeng, H.; Tang, F.; Li, Z.; Lu, W.; Zheng, Y. Feeding Selectivity and Diet Shift of Protosalanx chinensis during Spring in Lake Dalong, Northeastern China. Water 2023, 15, 1847. [Google Scholar] [CrossRef]
  31. Hammer, Ø.; Harper, D.A. Past: Paleontological Statistics Software Package for Educaton and Data Analysis. Palaeontol. Electron. 2001, 4, 1. [Google Scholar]
  32. Clarke, K.R.; Warwick, R.M. Similarity-Based Testing for Community Pattern: The Two-Way Layout with No Replication. Mar. Biol. 1994, 118, 167–176. [Google Scholar] [CrossRef]
  33. Clarke, K.R. Non-Parametric Multivariate Analysis of Changes in Community Structure. Aust. J. Ecol. 1993, 18, 117–143. [Google Scholar] [CrossRef]
  34. Clarke, K.R.; Green, R.H. Statistical Design and Analysis for a’biological Effects’ Study. Mar. Ecol. Prog. Ser. 1988, 46, 213–226. [Google Scholar] [CrossRef]
  35. Kosobokova, K.N.; Pertsova, N.M. Zooplankton of the White Sea: Structure, Dynamics and Ecology of Communities. White Sea Syst. Water Column Atmos. Cryosphere River Runoff Biosph. Interact. It 2012, 2, 640–675. [Google Scholar]
  36. Bek, T.A. Coastal Zone in the White Sea Ecosystem. J. Gen. Biol. 1990, 51, 116–124. [Google Scholar]
  37. Bek, T.A.; Kaliakina, N.M. General Characteristics of Interridal Zone. Mar. Fauna Ser. White Sea Biol. Resour. Probl. Their Ration. Use Part 1 1995, 42, 197–212. [Google Scholar]
  38. Prygunkova, R.V. Differences in the Change of Biological Seasons in the Plankton of the Chupa Bay (White Sea) in Different Years. Mar. Fauna Stud. 1985, 31, 99–108. [Google Scholar]
  39. Lazzari, M.A.; Sherman, S.; Kanwit, J.K. Nursery Use of Shallow Habitats by Epibenthic Fishes in Maine Nearshore Waters. Estuar. Coast. Shelf Sci. 2003, 56, 73–84. [Google Scholar] [CrossRef]
  40. Lazzari, M.A.; Stone, B.Z. Use of Submerged Aquatic Vegetation as Habitat by Young-of-the-Year Epibenthic Fishes in Shallow Maine Nearshore Waters. Estuar. Coast. Shelf Sci. 2006, 69, 591–606. [Google Scholar] [CrossRef]
  41. Zarubina, E.Y.; Ermolaeva, N.I. Seasonal Dynamics of Macrophytes and Zooplankton in the Littoral Zone of the Novosibirsk Reservoir in 2013. Int. J. Appl. Fundam. Res. 2014. 172p. [Google Scholar]
  42. Semenchenko, V.P.; Razlutskiy, V.I.; Buseva, J.F.; Palash, A.L. Zooplankton of the Littoral Zone of Lakes of Various Types; Belosurrian Science: Minsk, Belarus, 2013. [Google Scholar]
  43. Rybkina, E.V.; Ivanova, T.S.; Ivanov, M.V.; Kucheryavyy, A.V.; Lajus, D.L. Habitat Preference of Three-Spined Stickleback Juveniles in Experimental Conditions and in Wild Eelgrass. J. Mar. Biol. Assoc. UK 2017, 97, 1437–1445. [Google Scholar] [CrossRef]
  44. Jackson, E.L.; Attrill, M.J.; Rowden, A.A.; Jones, M.B. Seagrass Complexity Hierarchies: Influence on Fish Groups around the Coast of Jersey (English Channel). J. Exp. Mar. Biol. Ecol. 2006, 330, 38–54. [Google Scholar] [CrossRef]
  45. Lee, S.Y.; Fong, C.W.; Wu, R.S.S. The Effects of Seagrass (Zostera japonica) Canopy Structure on Associated Fauna: A Study Using Artificial Seagrass Units and Sampling of Natural Beds. J. Exp. Mar. Biol. Ecol. 2001, 259, 23–50. [Google Scholar] [CrossRef]
  46. Lovell, T. Nutrition and Feeding of Fish; Van Nostrand Reinhold: Washington, DC, USA, 1989. [Google Scholar]
  47. Neverman, D.; Wurtsbaugh, W.A. The Thermoregulatory Function of Diel Vertical Migration for a Juvenile Fish, Cottus extensus. Oecologia 1994, 98, 247–256. [Google Scholar] [CrossRef] [PubMed]
  48. Abdel-Malek, S.A. Threespine Stickleback (Gasterosteus aculeatus L.) Juvenile Feeding in the Kandalaksha Bay of the White Sea. Vopr. Ikhtiologii 1968, 8, 294–302. [Google Scholar]
  49. Hangelin, C.; Vuorinen, I. Food Selection in Juvenile Three-Spined Sticklebacks Studied in Relation to Size, Abundance and Biomass of Prey. Hydrobiologia 1988, 157, 169–177. [Google Scholar] [CrossRef]
  50. Hynes, H.B.N. The Food of Fresh-Water Sticklebacks (Gasterosteus aculeatus and Pygosteus pungitius), with a Review of Methods Used in Studies of the Food of Fishes. J. Anim. Ecol. 1950, 19, 36. [Google Scholar] [CrossRef]
  51. Berezina, N.A.; Zhgareva, N.N.; Strelnikova, A.P. Feeding Features of the Nine-Spined Stickleback Pungitius pungitius (Gasterosteidae) In Water Bodies of the North-West of Russia. J. Ichthyol. 2023, 63, 309–318. [Google Scholar] [CrossRef]
  52. Walkey, M. The Ecology of Neoechinorhynchus rutili (Muller). J. Parasitol. 1967, 53, 795–804. [Google Scholar] [CrossRef] [PubMed]
  53. Ziuganov, V.V. Genetics of Osteal Plate Polymorphism and Microevolution of Threespine Stickleback (Gasterosteus aculeatus L.). Theor. Appl. Genet. 1983, 65, 239–246. [Google Scholar] [CrossRef] [PubMed]
  54. Helenius, L.K.; Borg, J.P.G.; Nurminen, L.; Leskinen, E.; Lehtonen, H. The Effects of Turbidity on Prey Consumption and Selection of Zooplanktivorous Gasterosteus aculeatus L. Aquat. Ecol. 2013, 47, 349–356. [Google Scholar] [CrossRef]
  55. Ibrahim, A.A.; Huntingford, F.A. Laboratory and Field Studies on Diet Choice in Three-Spined Sticklebacks, Gasterosteus aculeatus L., in Relation to Profitability and Visual Features of Prey. J. Fish Biol. 1989, 34, 245–257. [Google Scholar] [CrossRef]
  56. Spilseth, S.A.; Simenstad, C.A. Seasonal, Diel, and Landscape Effects on Resource Partitioning between Juvenile Chinook Salmon (Oncorhynchus tshawytscha) and Threespine Stickleback (Gasterosteus aculeatus) in the Columbia River Estuary. Estuaries Coasts 2011, 34, 159–171. [Google Scholar] [CrossRef]
  57. Lehtiniemi, M.; Hakala, T.; Saesmaa, S.; Viitasalo, M. Prey Selection by the Larvae of Three Species of Littoral Fishes on Natural Zooplankton Assemblages. Aquat. Ecol. 2007, 41, 85–94. [Google Scholar] [CrossRef]
  58. Bretzel, J.B.; Geist, J.; Gugele, S.M.; Baer, J.; Brinker, A. Feeding Ecology of Invasive Three-Spined Stickleback (Gasterosteus aculeatus) in Relation to Native Juvenile Eurasian Perch (Perca fluviatilis) in the Pelagic Zone of Upper Lake Constance. Front. Environ. Sci. 2021, 9, 670125. [Google Scholar] [CrossRef]
  59. Roch, S.; von Ammon, L.; Geist, J.; Brinker, A. Foraging Habits of Invasive Three-Spined Sticklebacks (Gasterosteus aculeatus)—Impacts on Fisheries Yield in Upper Lake Constance. Fish. Res. 2018, 204, 172–180. [Google Scholar] [CrossRef]
  60. Campbell, C.E. Prey Selectivities of Threespine Sticklebacks (Gasterosteus aculeatus) and Phantom Midge Larvae (Chaoborus Spp.) in Newfoundland Lakes. Freshw. Biol. 1991, 25, 155–167. [Google Scholar] [CrossRef]
  61. Delbeek, J.C.; Williams, D.D. Feeding Selectivity of Four Species of Sympatric Stickleback in Brackish-Water Habitats in Eastern Canada. J. Fish Biol. 1988, 32, 41–62. [Google Scholar] [CrossRef]
  62. Rick, I.P.; Mehlis, M.; Bakker, T.C.M. Male Red Ornamentation Is Associated with Female Red Sensitivity in Sticklebacks. PLoS ONE 2011, 6, e25554. [Google Scholar] [CrossRef] [PubMed]
  63. Paffenhofer, G.-A.; Mazzocchi, M.G. On Some Aspects of the Behaviour of Oithona plumifera (Copepoda: Cyclopoida). J. Plankton Res. 2002, 24, 129–135. [Google Scholar] [CrossRef]
  64. Koski, M.; Kiørboe, T.; Takahashi, K. Benthic Life in the Pelagic: Aggregate Encounter and Degradation Rates by Pelagic Harpacticoid Copepods. Limnol. Oceanogr. 2005, 50, 1254–1263. [Google Scholar] [CrossRef]
  65. Van Duren, L.; Videler, J. Swimming Behaviour of Developmental Stages of the Calanoid Copepod Temora longicornis at Different Food Concentrations. Mar. Ecol. Prog. Ser. 1995, 126, 153–161. [Google Scholar] [CrossRef]
Figure 1. The study area.
Jmse 11 02369 g001
Figure 2. Density plots of size frequency distribution of juvenile three-spined stickleback Gasterosteus aculeatus at studied spawning grounds of Chupa inlet. TL (OX axis)—total length. The color of each density plot indicates two periods of sampling (dates 1 and 2; see Section 2 for details). Vertical dashed lines correspond to mean TL values. F-values and corresponding p-values are from one-way ANOVA tests used to compare mean TL between two periods of sampling.
Jmse 11 02369 g002
Figure 3. Box plots of seasonal variation in the fullness index (FI, ‱) of juvenile three-spined stickleback Gasterosteus aculeatus (L.) at various spawning grounds. The horizontal bar in the middle of each box is the mean; the box indicates the quartiles (25th and 75th percentiles) of FI values, and the whiskers indicate the non-outlier range.
Jmse 11 02369 g003
Figure 4. The structure of zooplankton communities (stacked bar plots) and the stomach contents (circle diagrams) of juvenile sticklebacks in early and late August. Habitat types of nursery grounds are indicated by symbols; lines connect a series of observations at each site. Percentage values indicated by the site names (e.g., Letnaya −96%) denote the percentage change in the abundance of juvenile sticklebacks at each site between the two periods of observation. The size of each bar plot is proportional to the total biomass of zooplankton at the two periods of observation; the size of each circle diagram is proportional to the FI (fullness index) of stickleback stomachs at each site.
Jmse 11 02369 g004
Figure 5. Seasonal variation in Ivlev’s food selectivity index (E) in juvenile three-spined stickleback Gasterosteus aculeatus in early and late August. Dashed lines correspond to selectivity index values of −0.25 and +0.25. Filled bars represent the within-sample variation in the E index calculated per individual fish (E index mean ± SE); semitransparent bars represent the E index calculated per average fish in the sample.
Jmse 11 02369 g005
Figure 6. Individual variation in prey selectivity (E index mean ± SE) for Podon leuckartii by juvenile three-spined stickleback Gasterosteus aculeatus in early August. Bars represent the individual E index values per fish studied; fish ID (OY axis)—the individual fish number in each sample. The top plates above location names correspond to the mean values of the E index per sample as in Figure 5 (E index mean ± SE and E index per averaged fish in sample), respectively. Dashed lines correspond to selectivity index values between −0.25 and +0.25.
Jmse 11 02369 g006
Table 1. Basic information on sampling locations (geographic coordinates and intertidal habitat type) and the number of samples collected during the two sampling periods.
SiteCoordinatesIntertidal HabitatG. aculeatus Sample Size, Ind.
Date 1Date 2
KeretN 66.30261E 33.69054rocky shore3012
KrugliashN 66.33070E 33.54565rockweeds3011
KoliushkovayaN 66.31335E 33.64348lagoon, eelgrass bed3030
LetnayaN 66.24456E 33.79524eelgrass bed3030
PodpakhtaN 66.29600E 33.61527rockweeds3030
SeldianayaN 66.33765 E 33.62485eelgrass bed3030
Table 2. Summary results of one-way analysis of similarities (ANOSIM) analyses based on partial fullness index (PFI) data.
FactorR-Valuep-Value
Date0.330.0001
Site0.270.0001
Date 10.380.0001
Date 20.370.0001
Pairwise, Date 1Pairwise, Date 2
R-valuep-valueR-valuep-value
Keret-Krugliash0.390.00010.440.0001
Keret-Koliushkovaya0.730.00010.810.0001
Keret-Letnaya0.440.00010.10.0851
Keret-Podpakhta0.250.00010.130.0728
Keret-Seldianaya0.50.00010.510.0001
Krugliash-Koliushkovaya0.530.00010.550.0001
Krugliash-Letnaya0.150.00020.410.0001
Krugliash-Podpakhta0.120.00140.490.0002
Krugliash-Seldianaya0.120.00050.50.0001
Koliushkovaya-Letnaya0.750.00010.520.0001
Koliushkovaya-Podpakhta0.570.00010.610.0001
Koliushkovaya-Seldianaya0.550.00010.130.0001
Letnaya-Podpakhta0.240.00010.150.0001
Letnaya-Seldianaya0.160.00010.380.0001
Podpakhta-Seldianaya0.180.00010.330.0001
Table 3. Mean + SE density (N, 1000*ind/m3) and biomass (mg/m3) of zooplankton at various types of stickleback nursery grounds in the White Sea.
Nursery Ground TypeDate 1Date 2
NSE NBSE BNSE NBSE B
lagoon126-5040-30-1500-
eelgrass beds35.815.05327.7222.6413.211.22282.2239.39
rocky shore17.6-142.7-12.5-465.9-
rockweeds7.93.5150.812.2916.411440.2329.88
Disclaimer/Publisher’s Note: The statements, opinions and data contained in all publications are solely those of the individual author(s) and contributor(s) and not of MDPI and/or the editor(s). MDPI and/or the editor(s) disclaim responsibility for any injury to people or property resulting from any ideas, methods, instructions or products referred to in the content.

