Impacts on Metabolism and Gill Physiology of Darter Species (Etheostoma spp.) That Are Attributed to Wastewater Effluent in the Grand River


Abstract
:1. Introduction
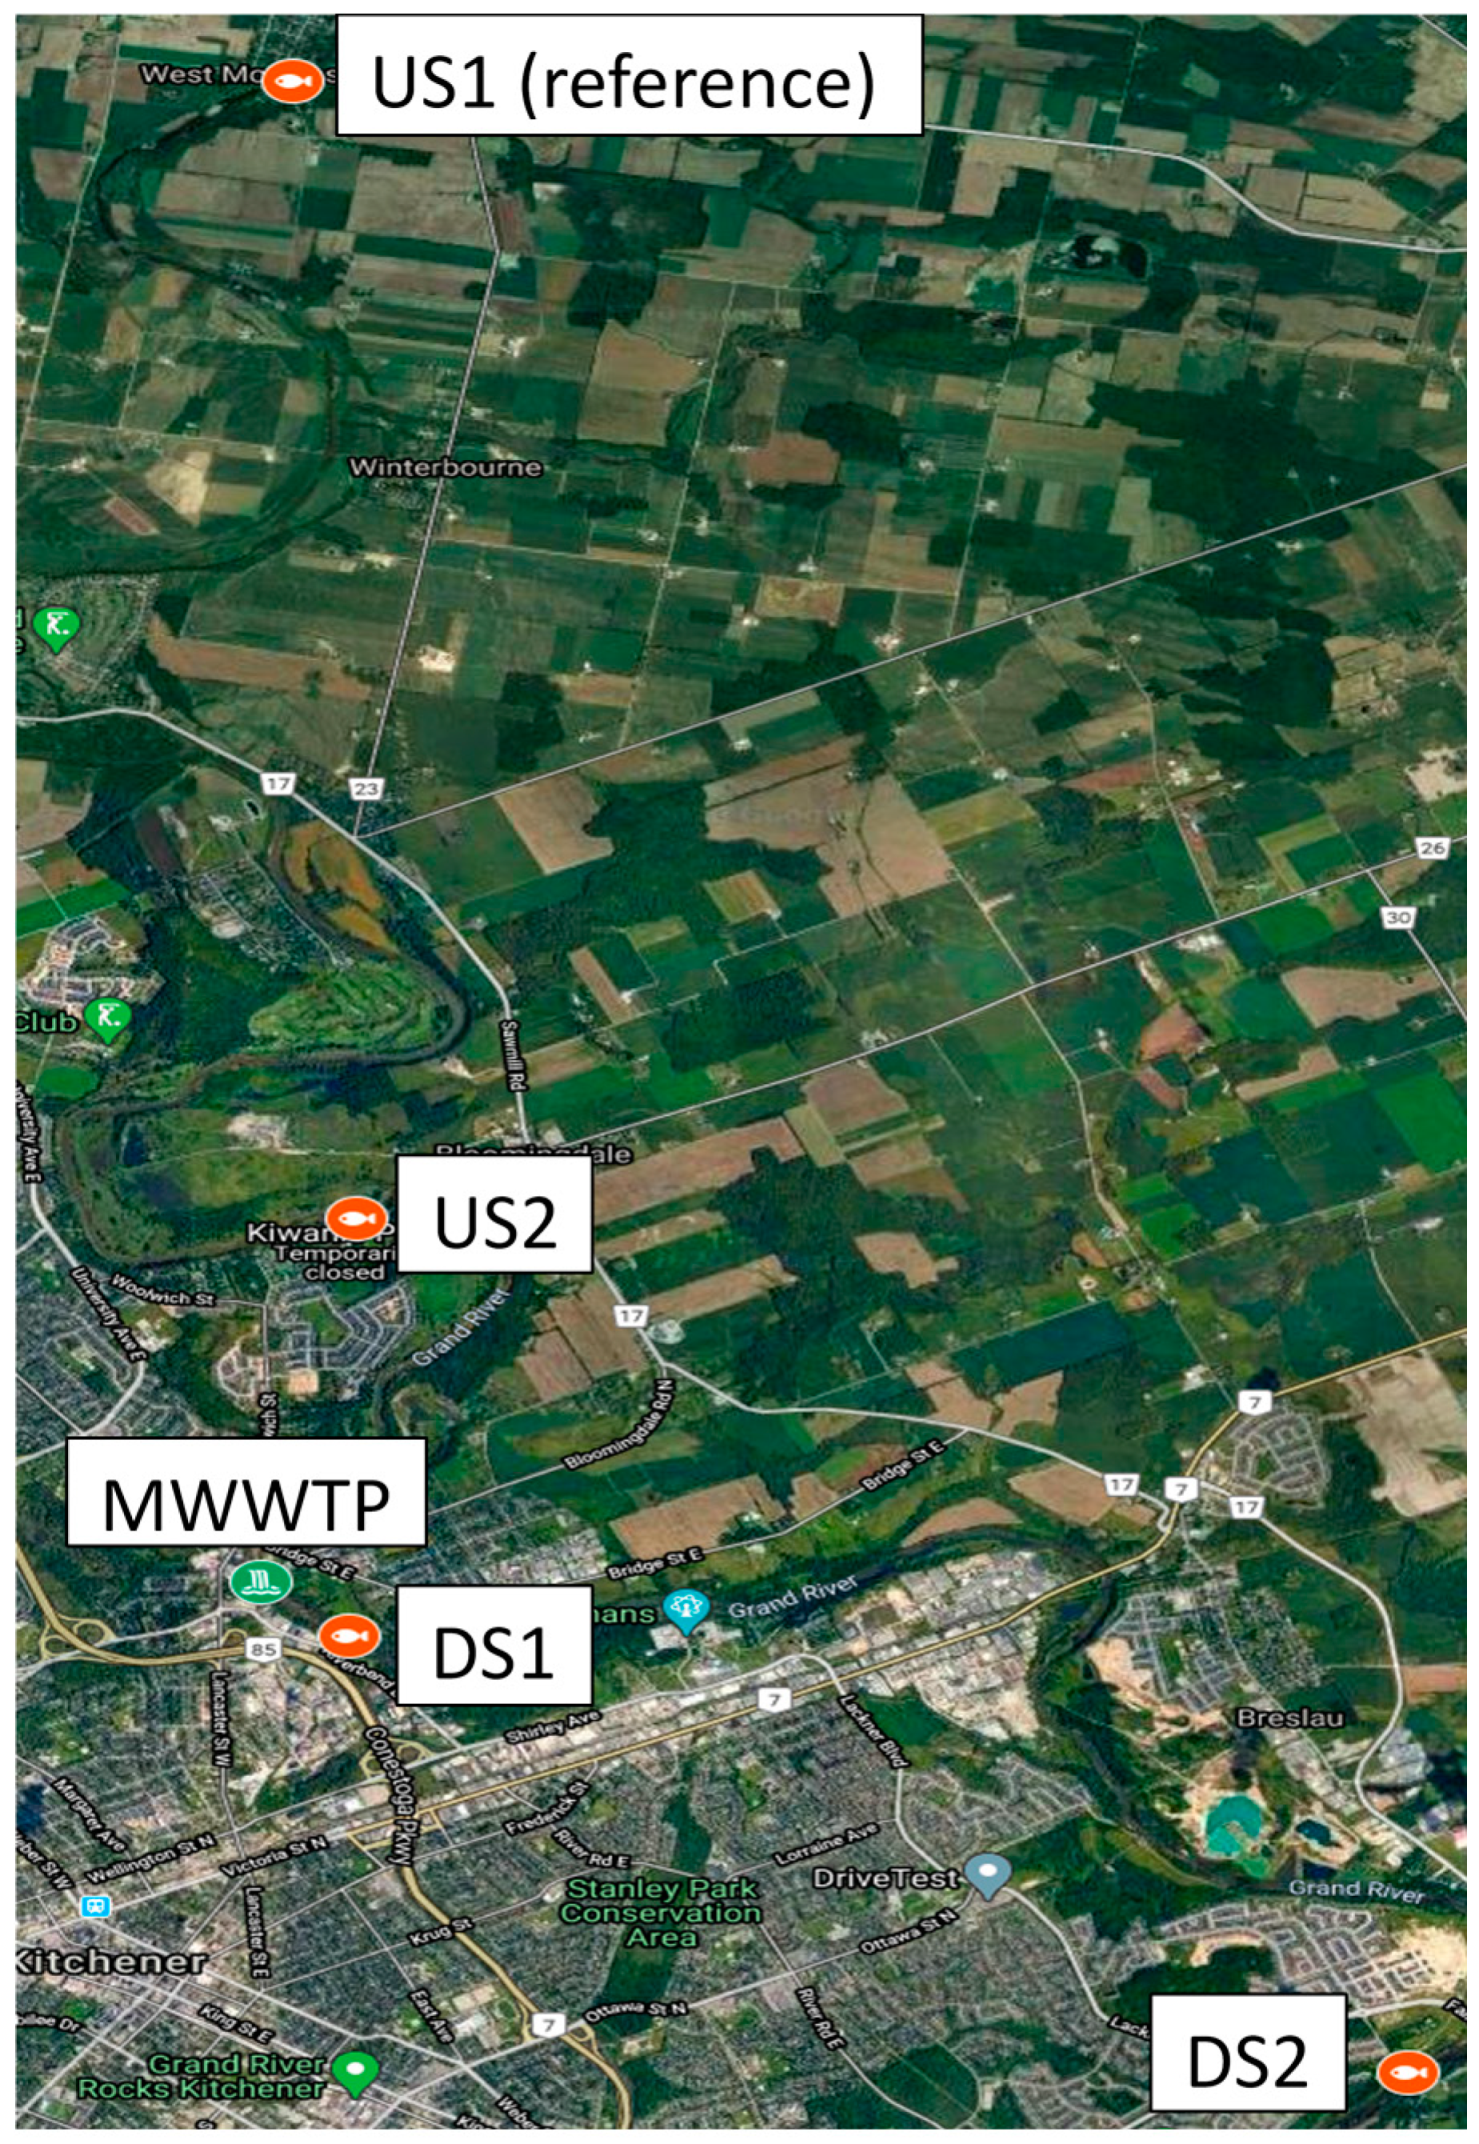
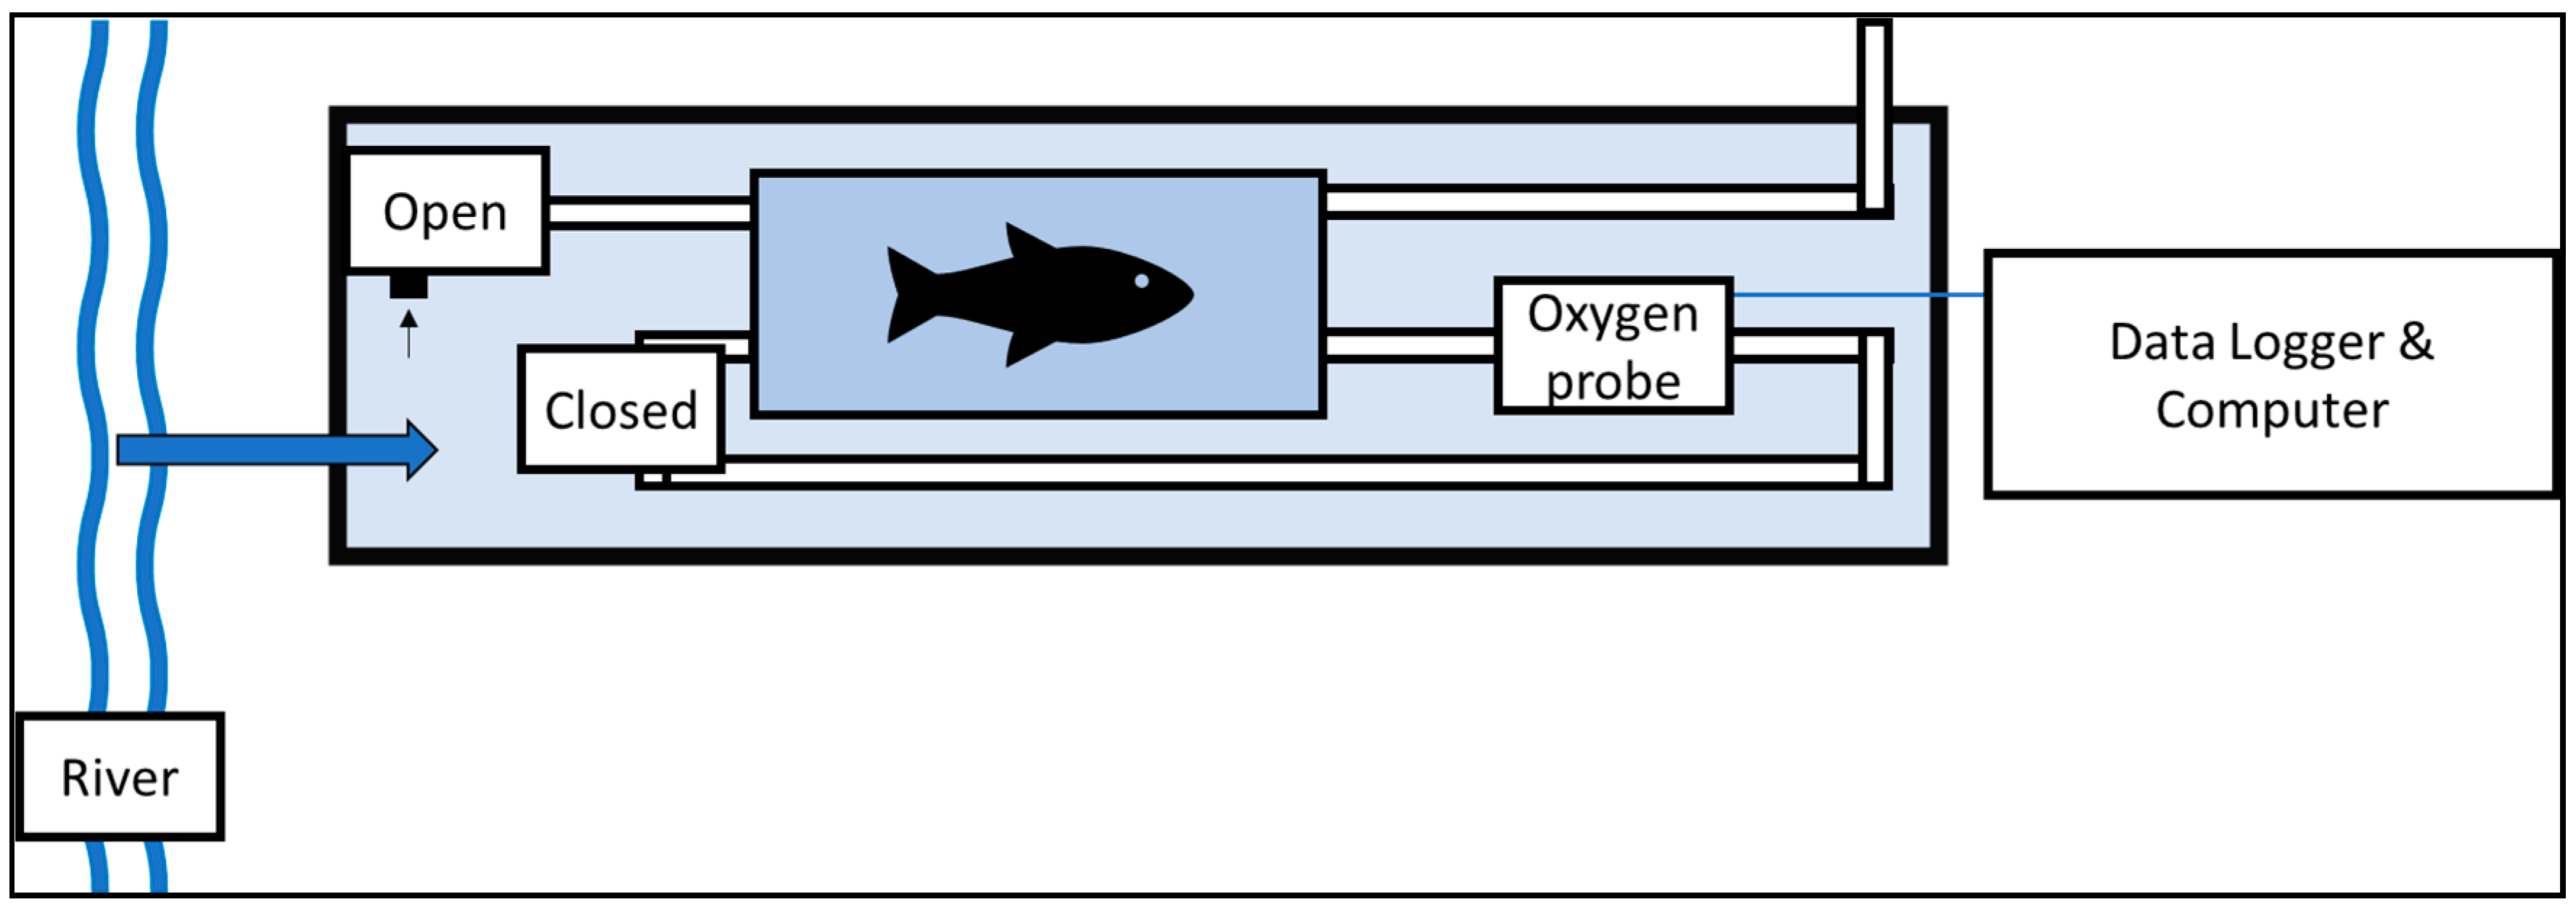
2. Materials and Methods
3. Results
3.1. Water Quality
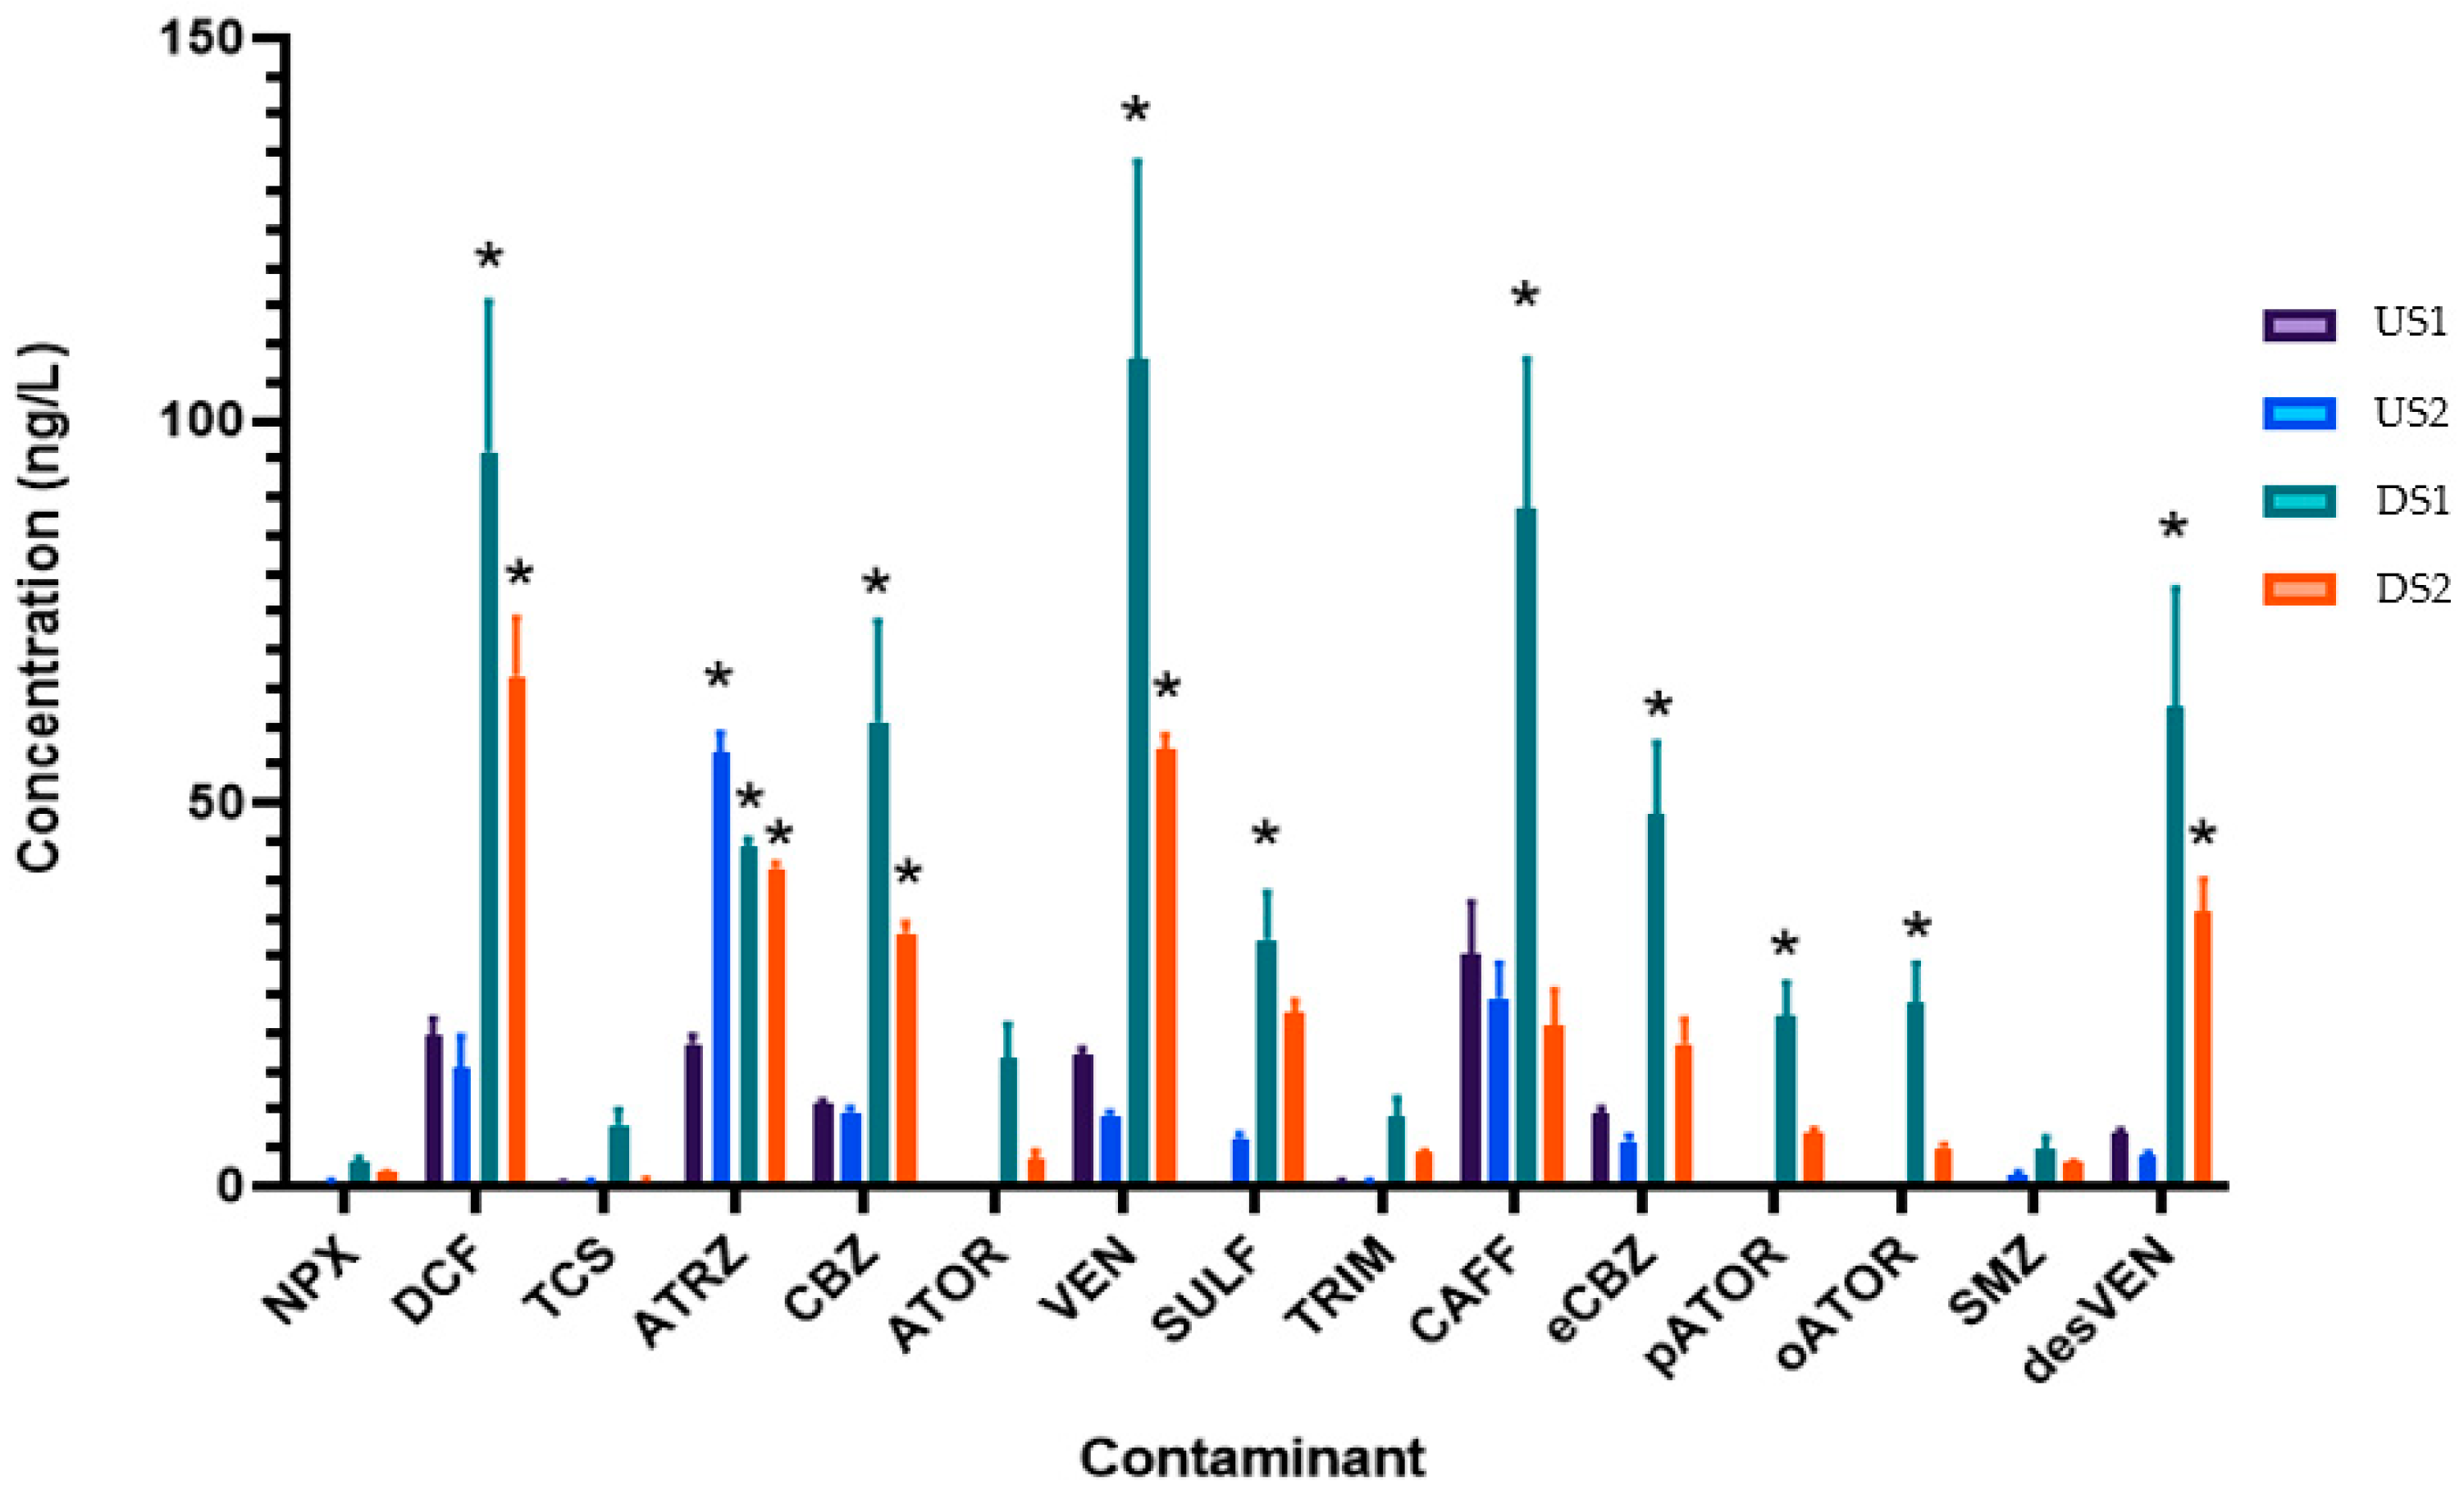
3.2. Contaminant Profile
3.3. Body Condition
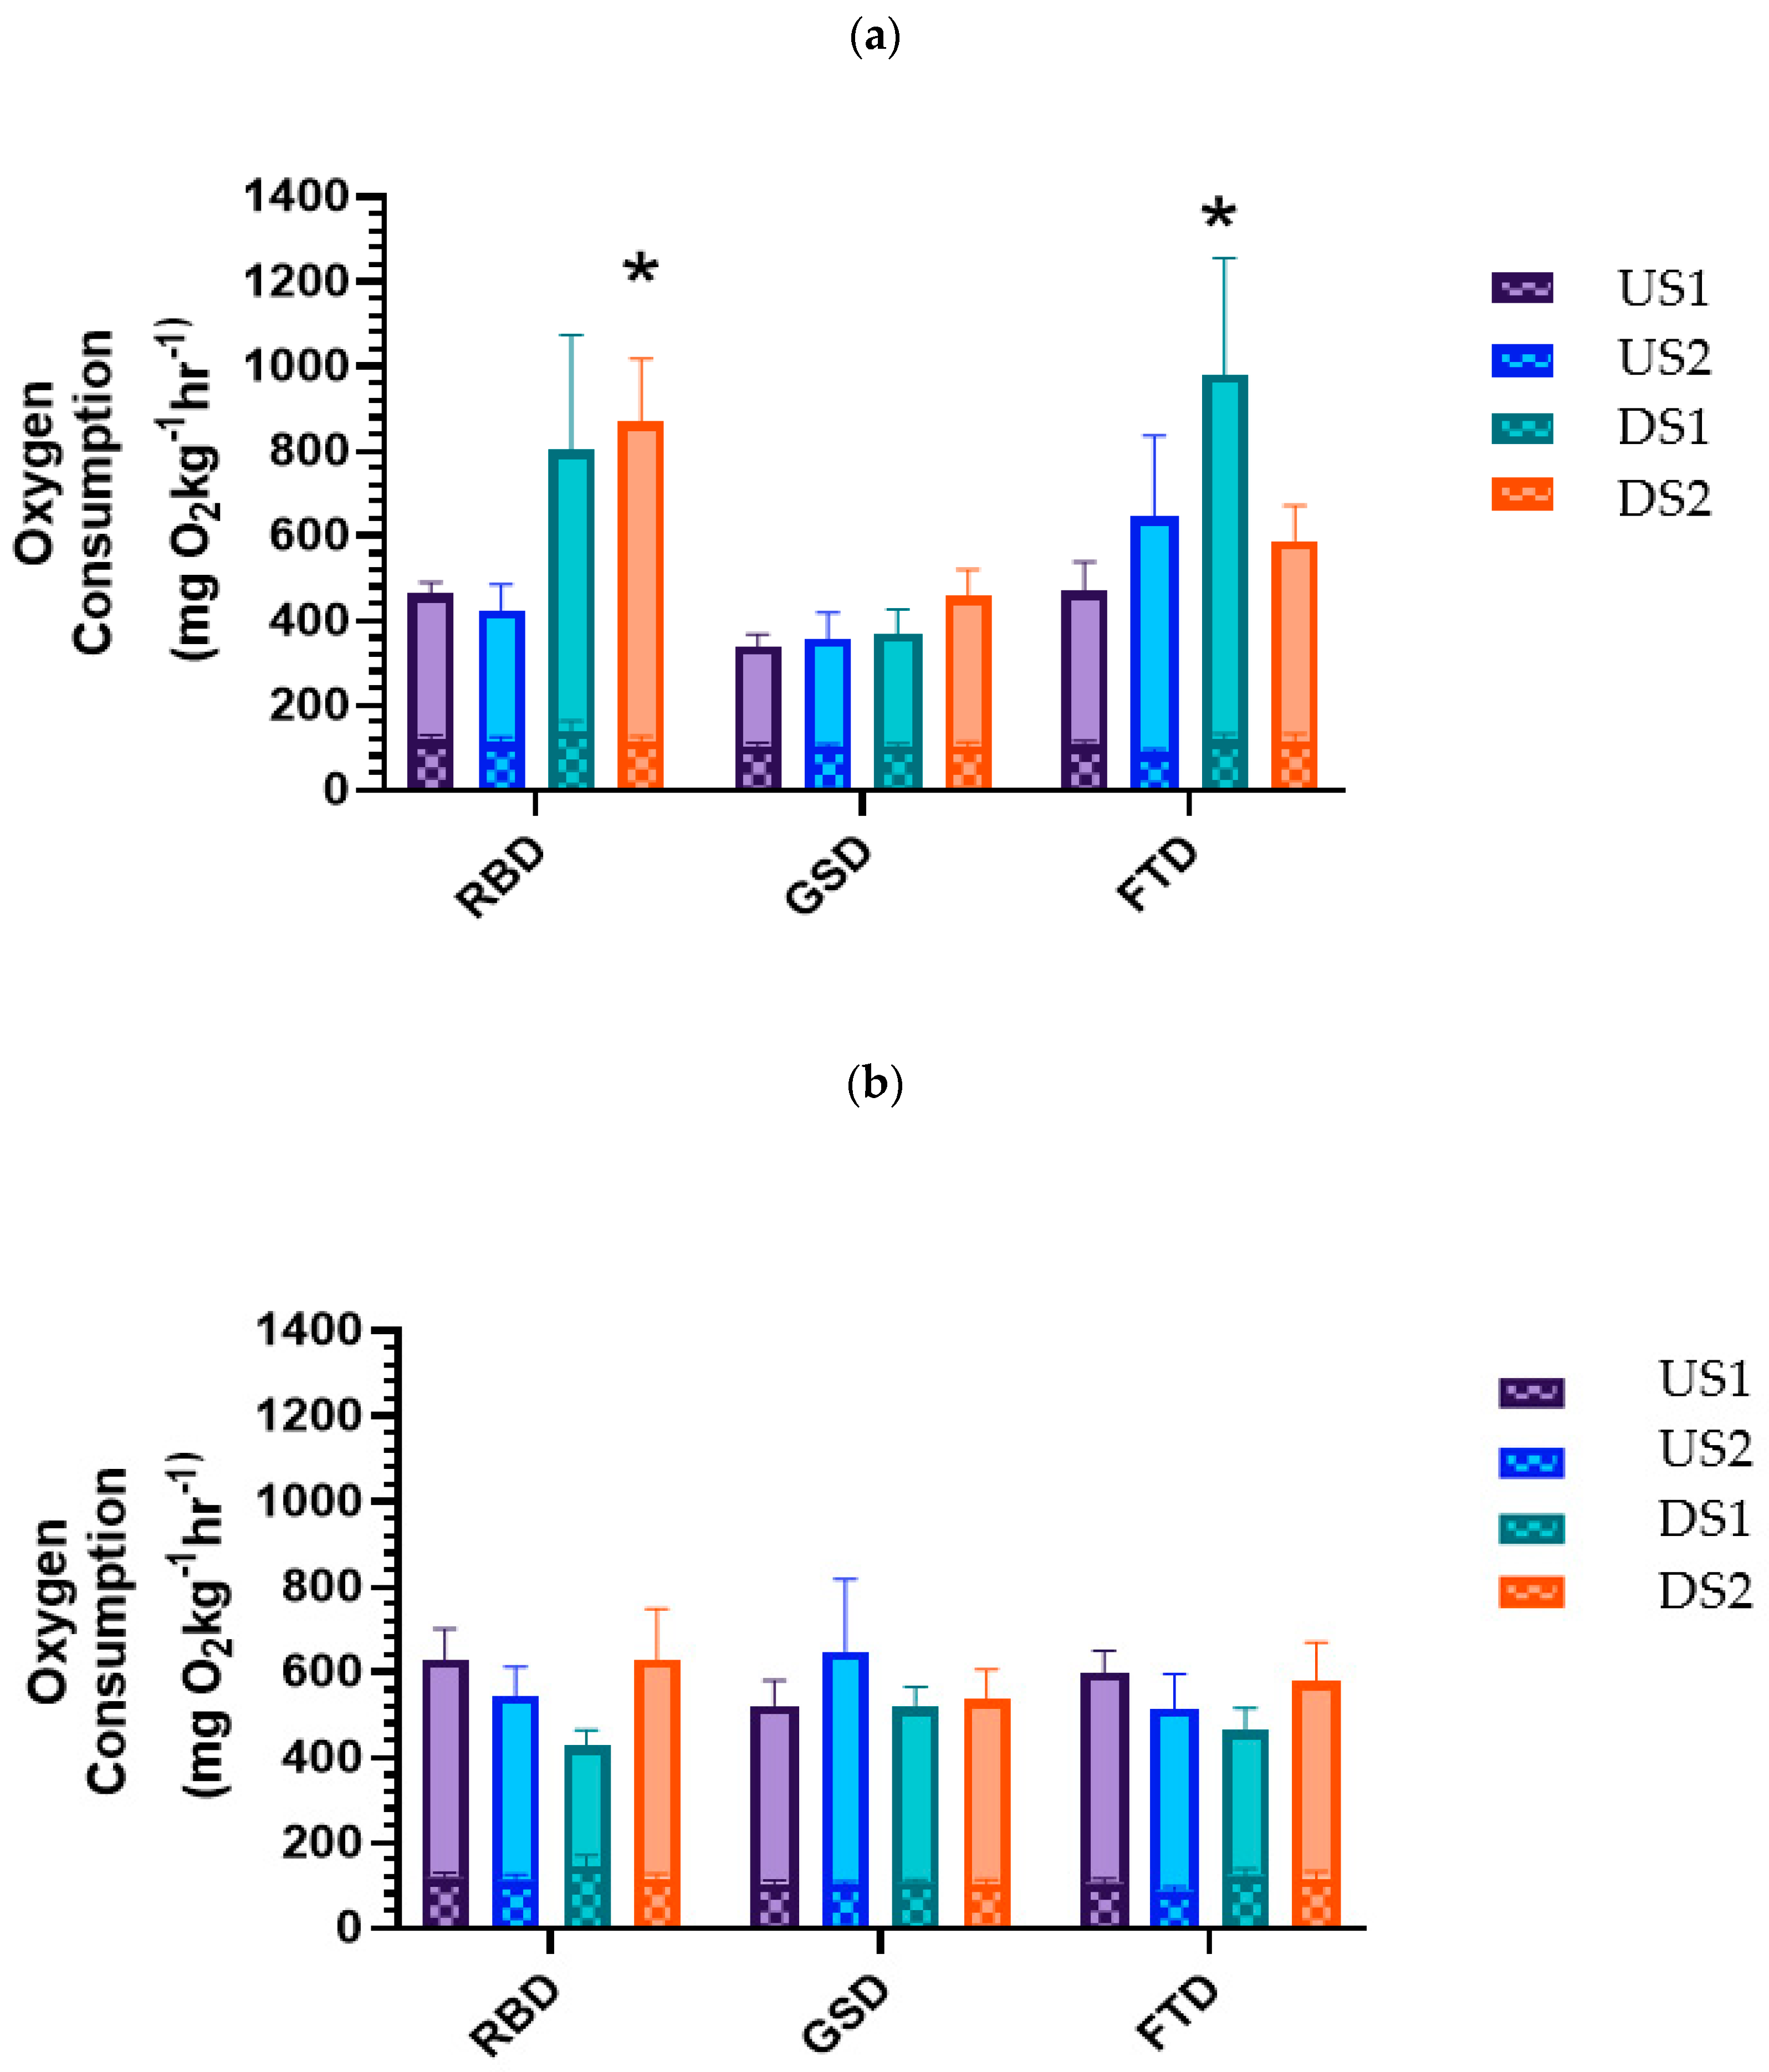
3.4. Metabolic Rate
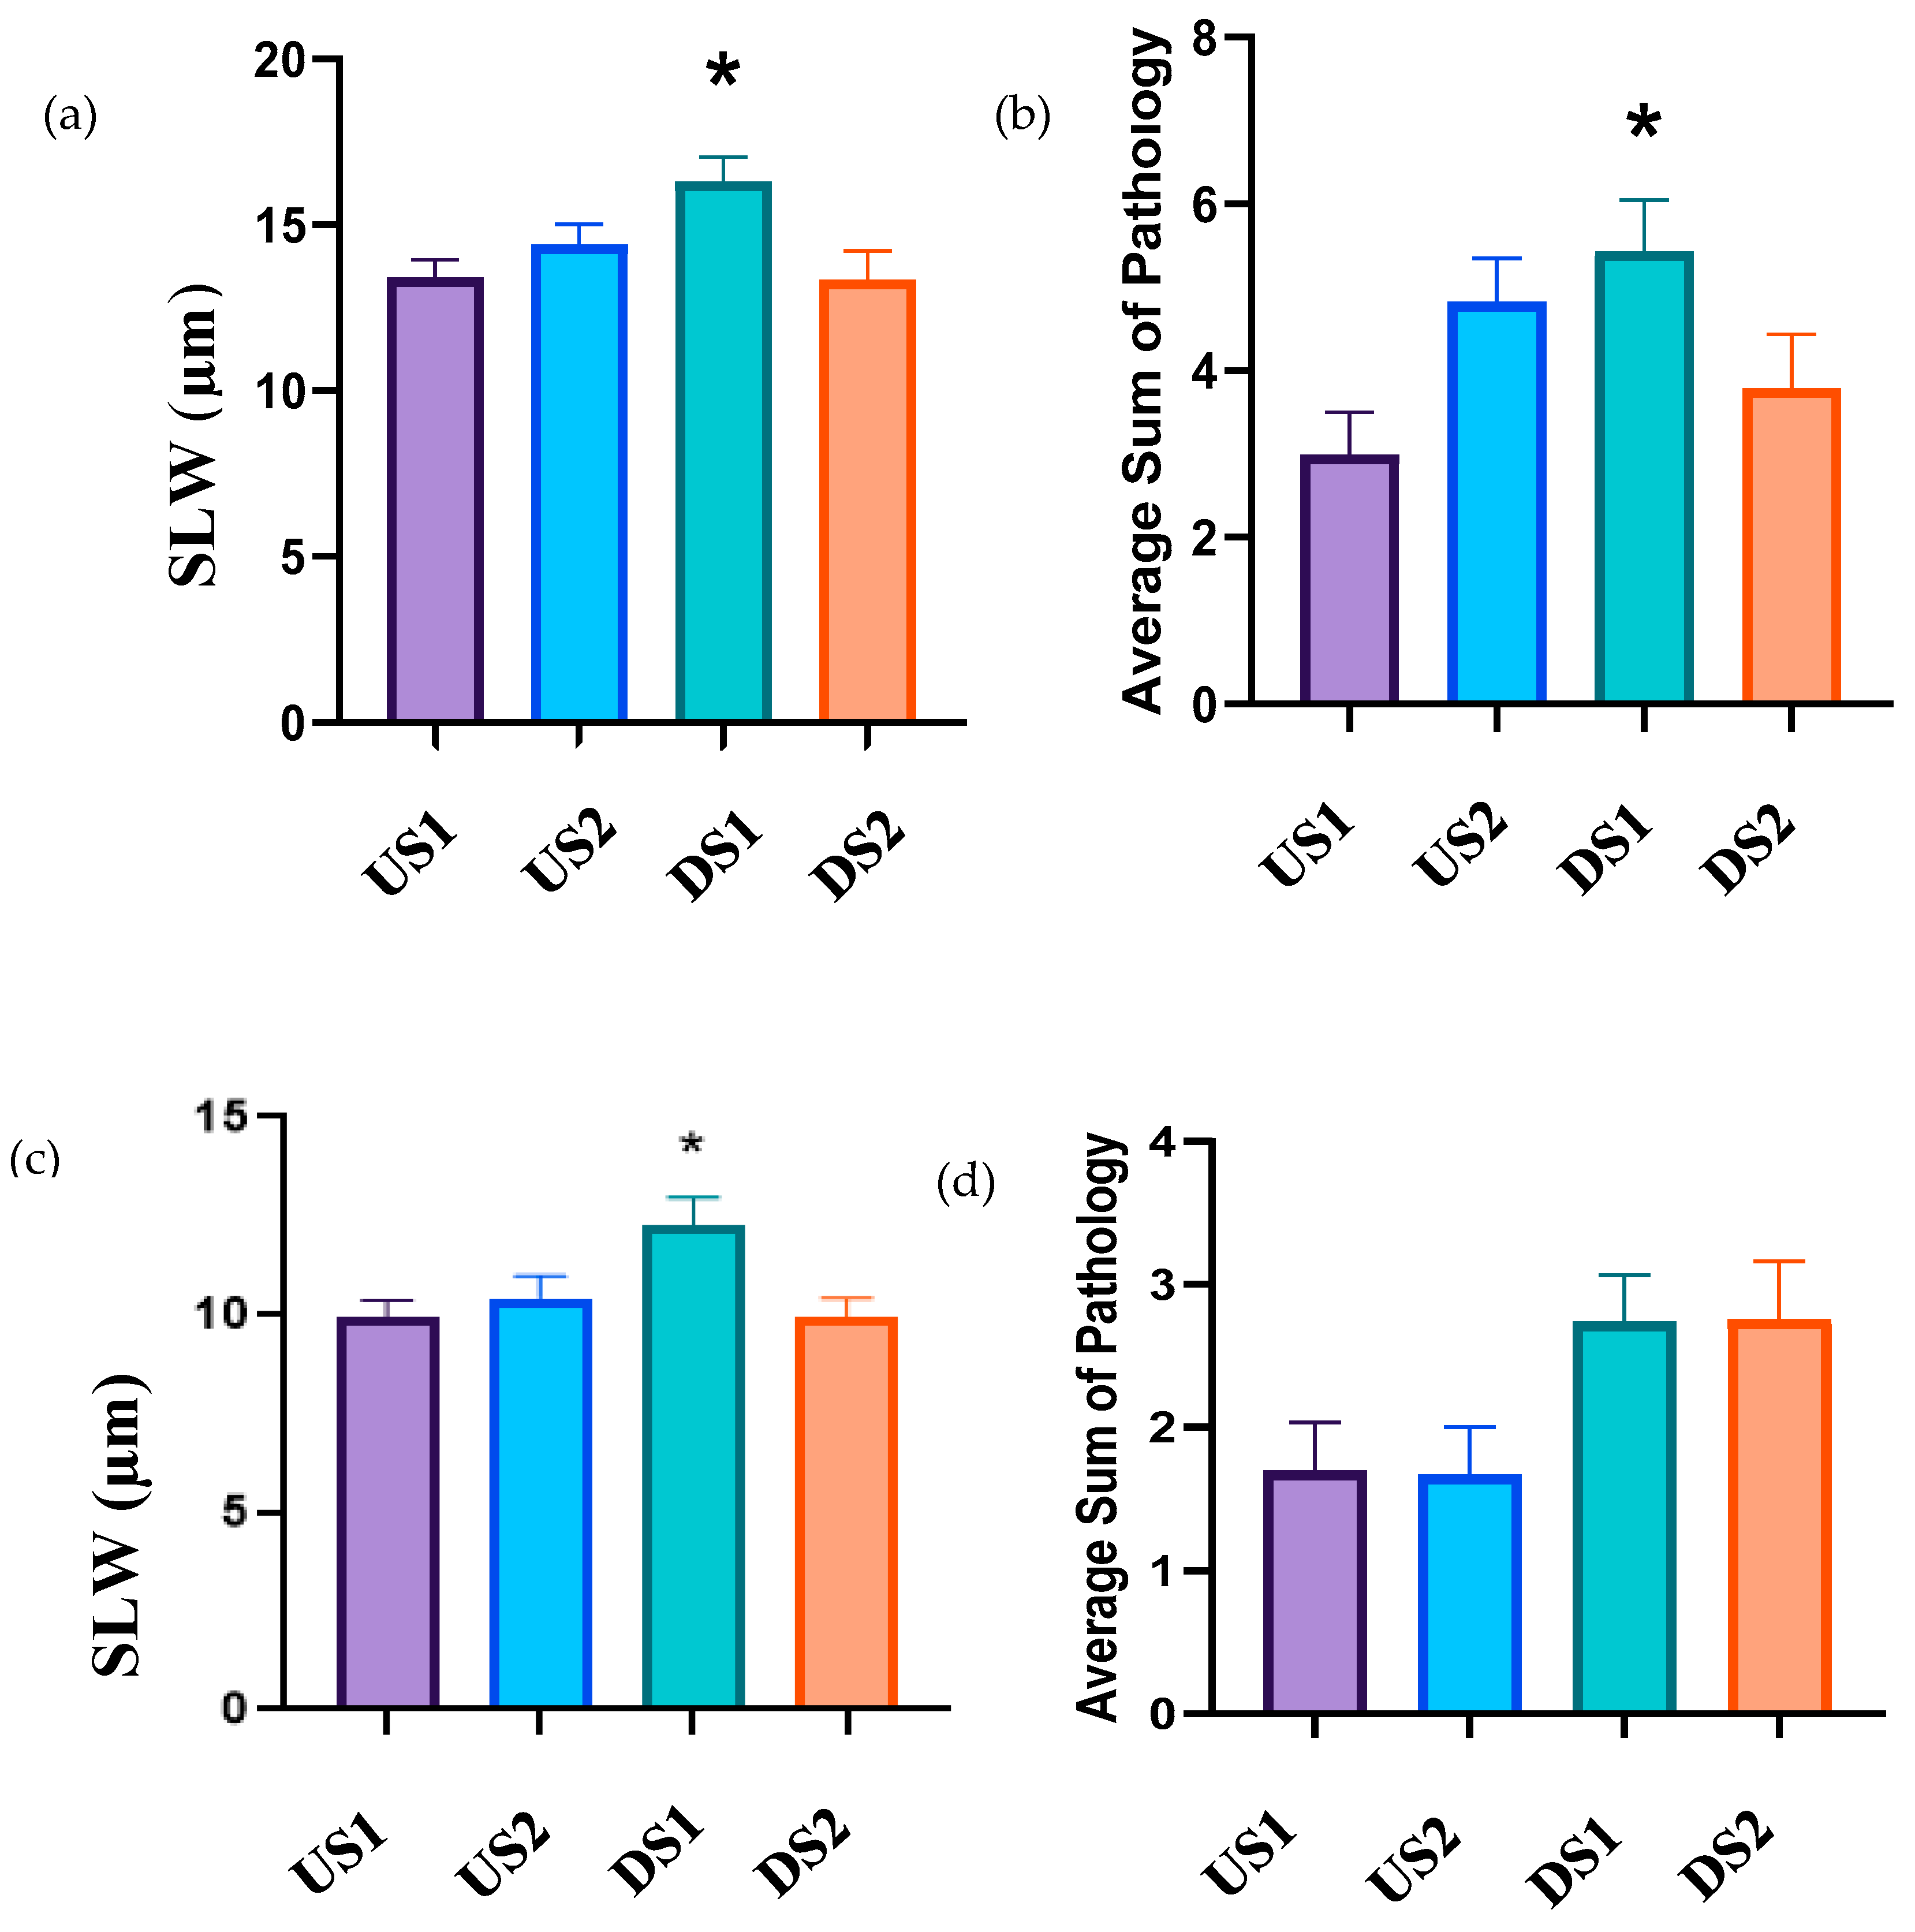
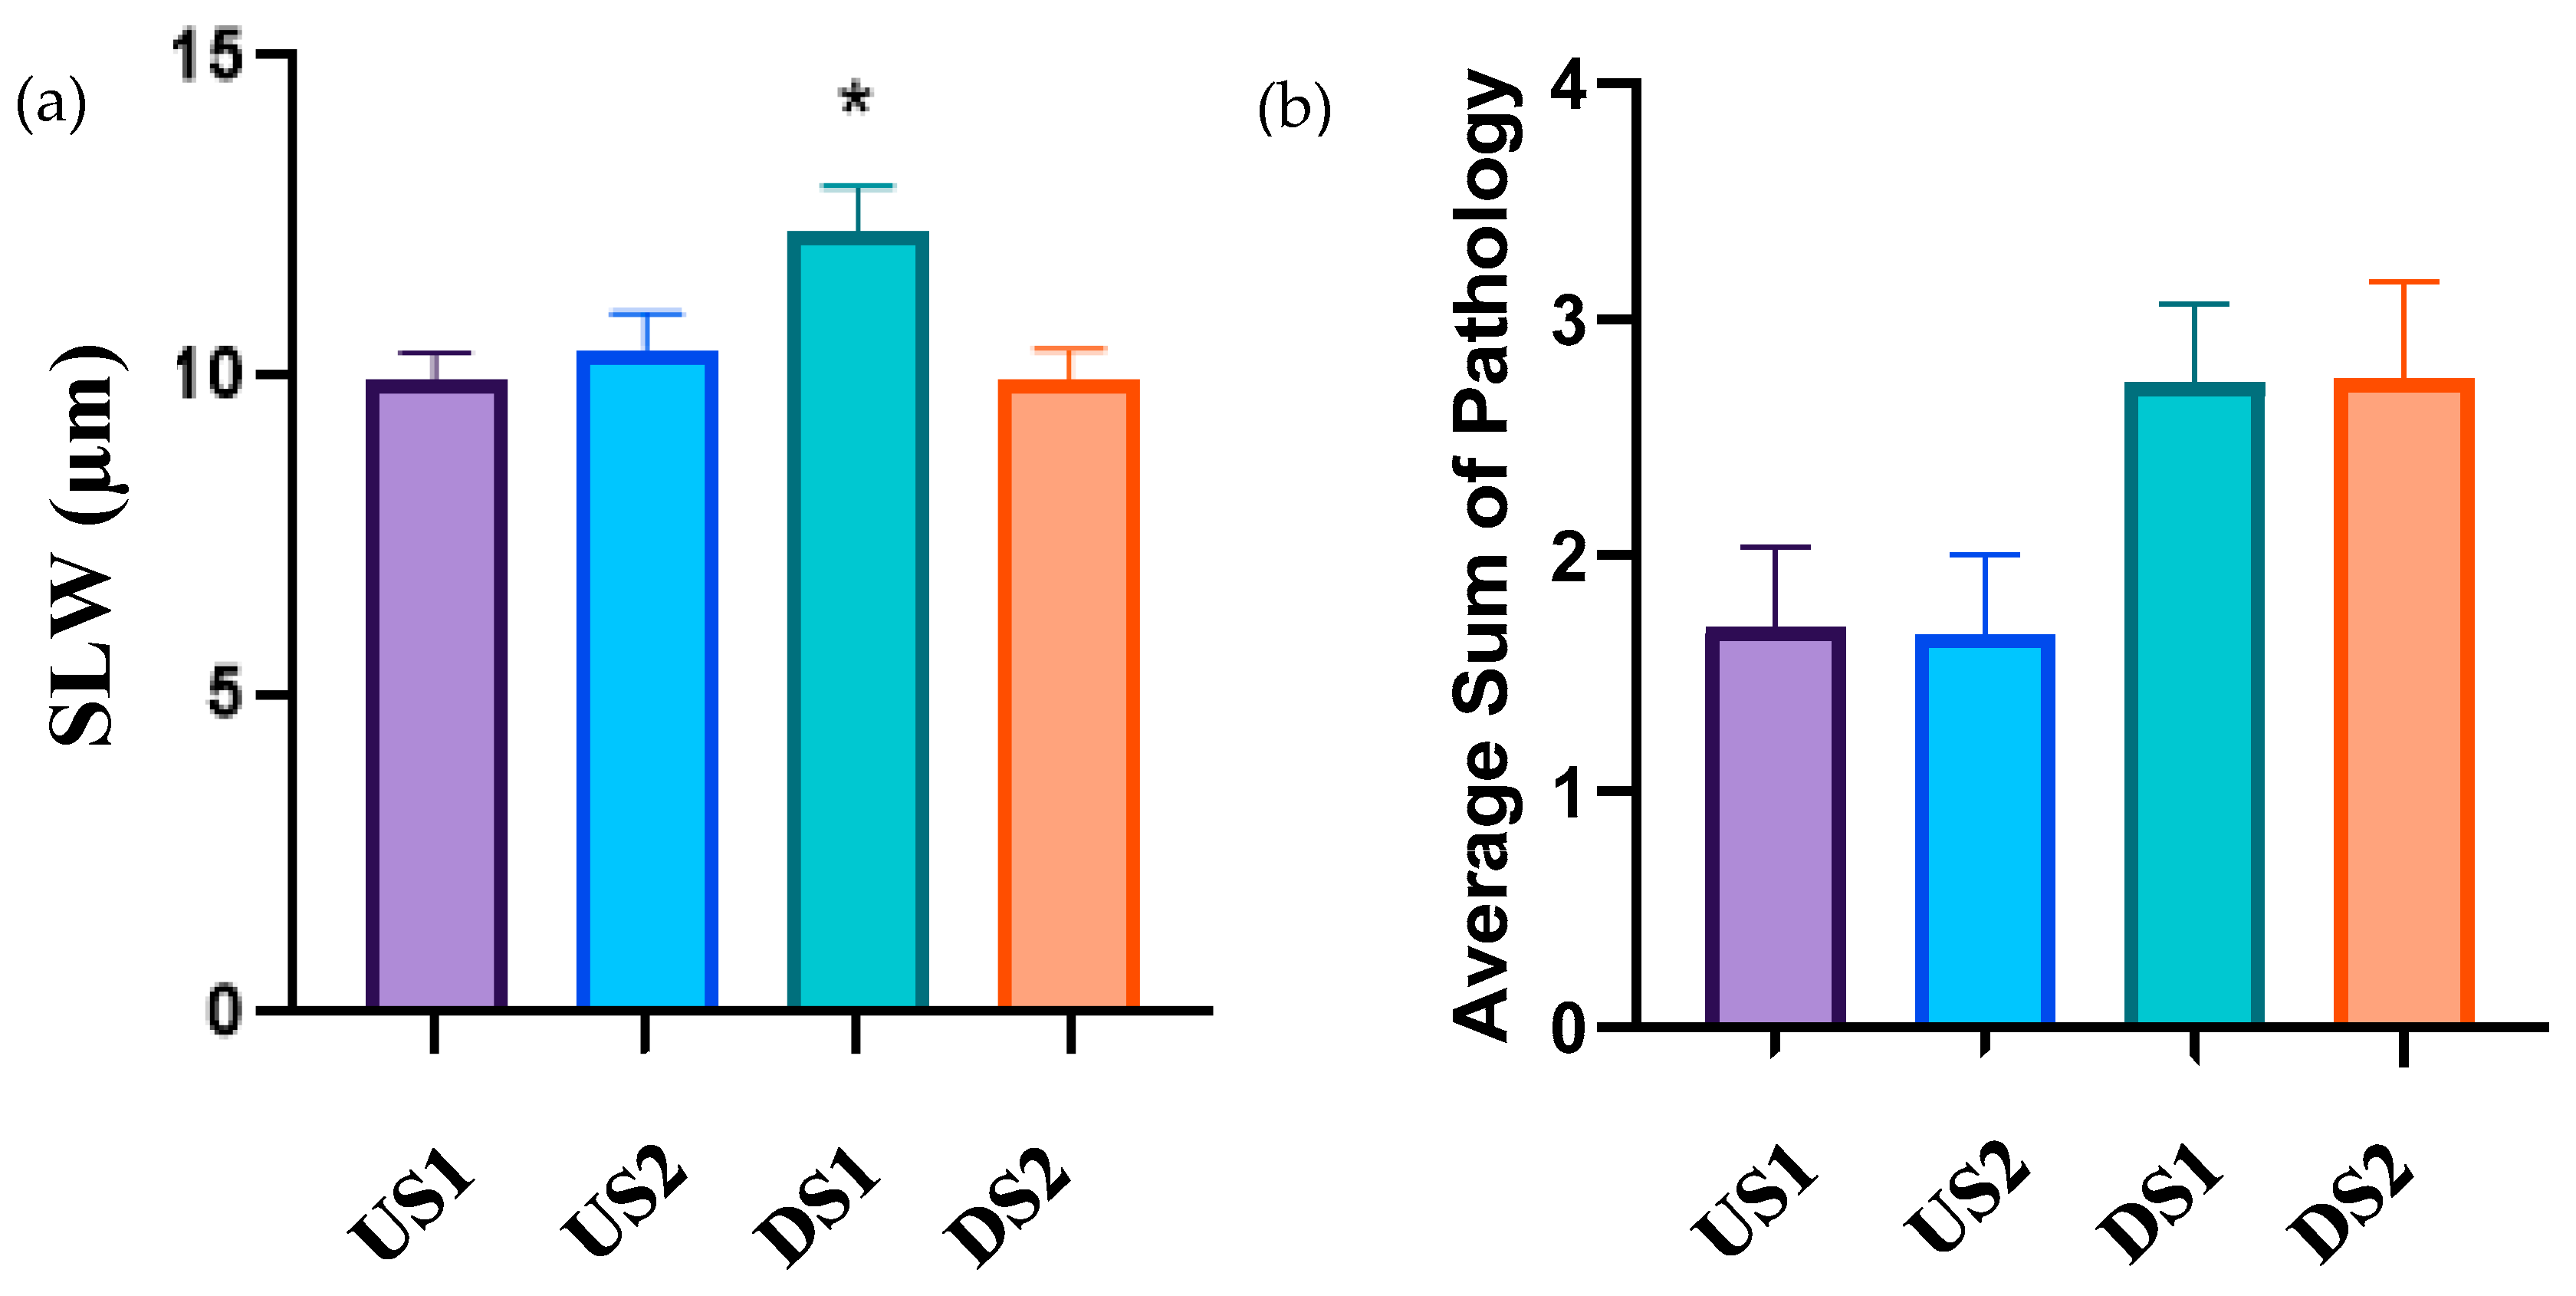
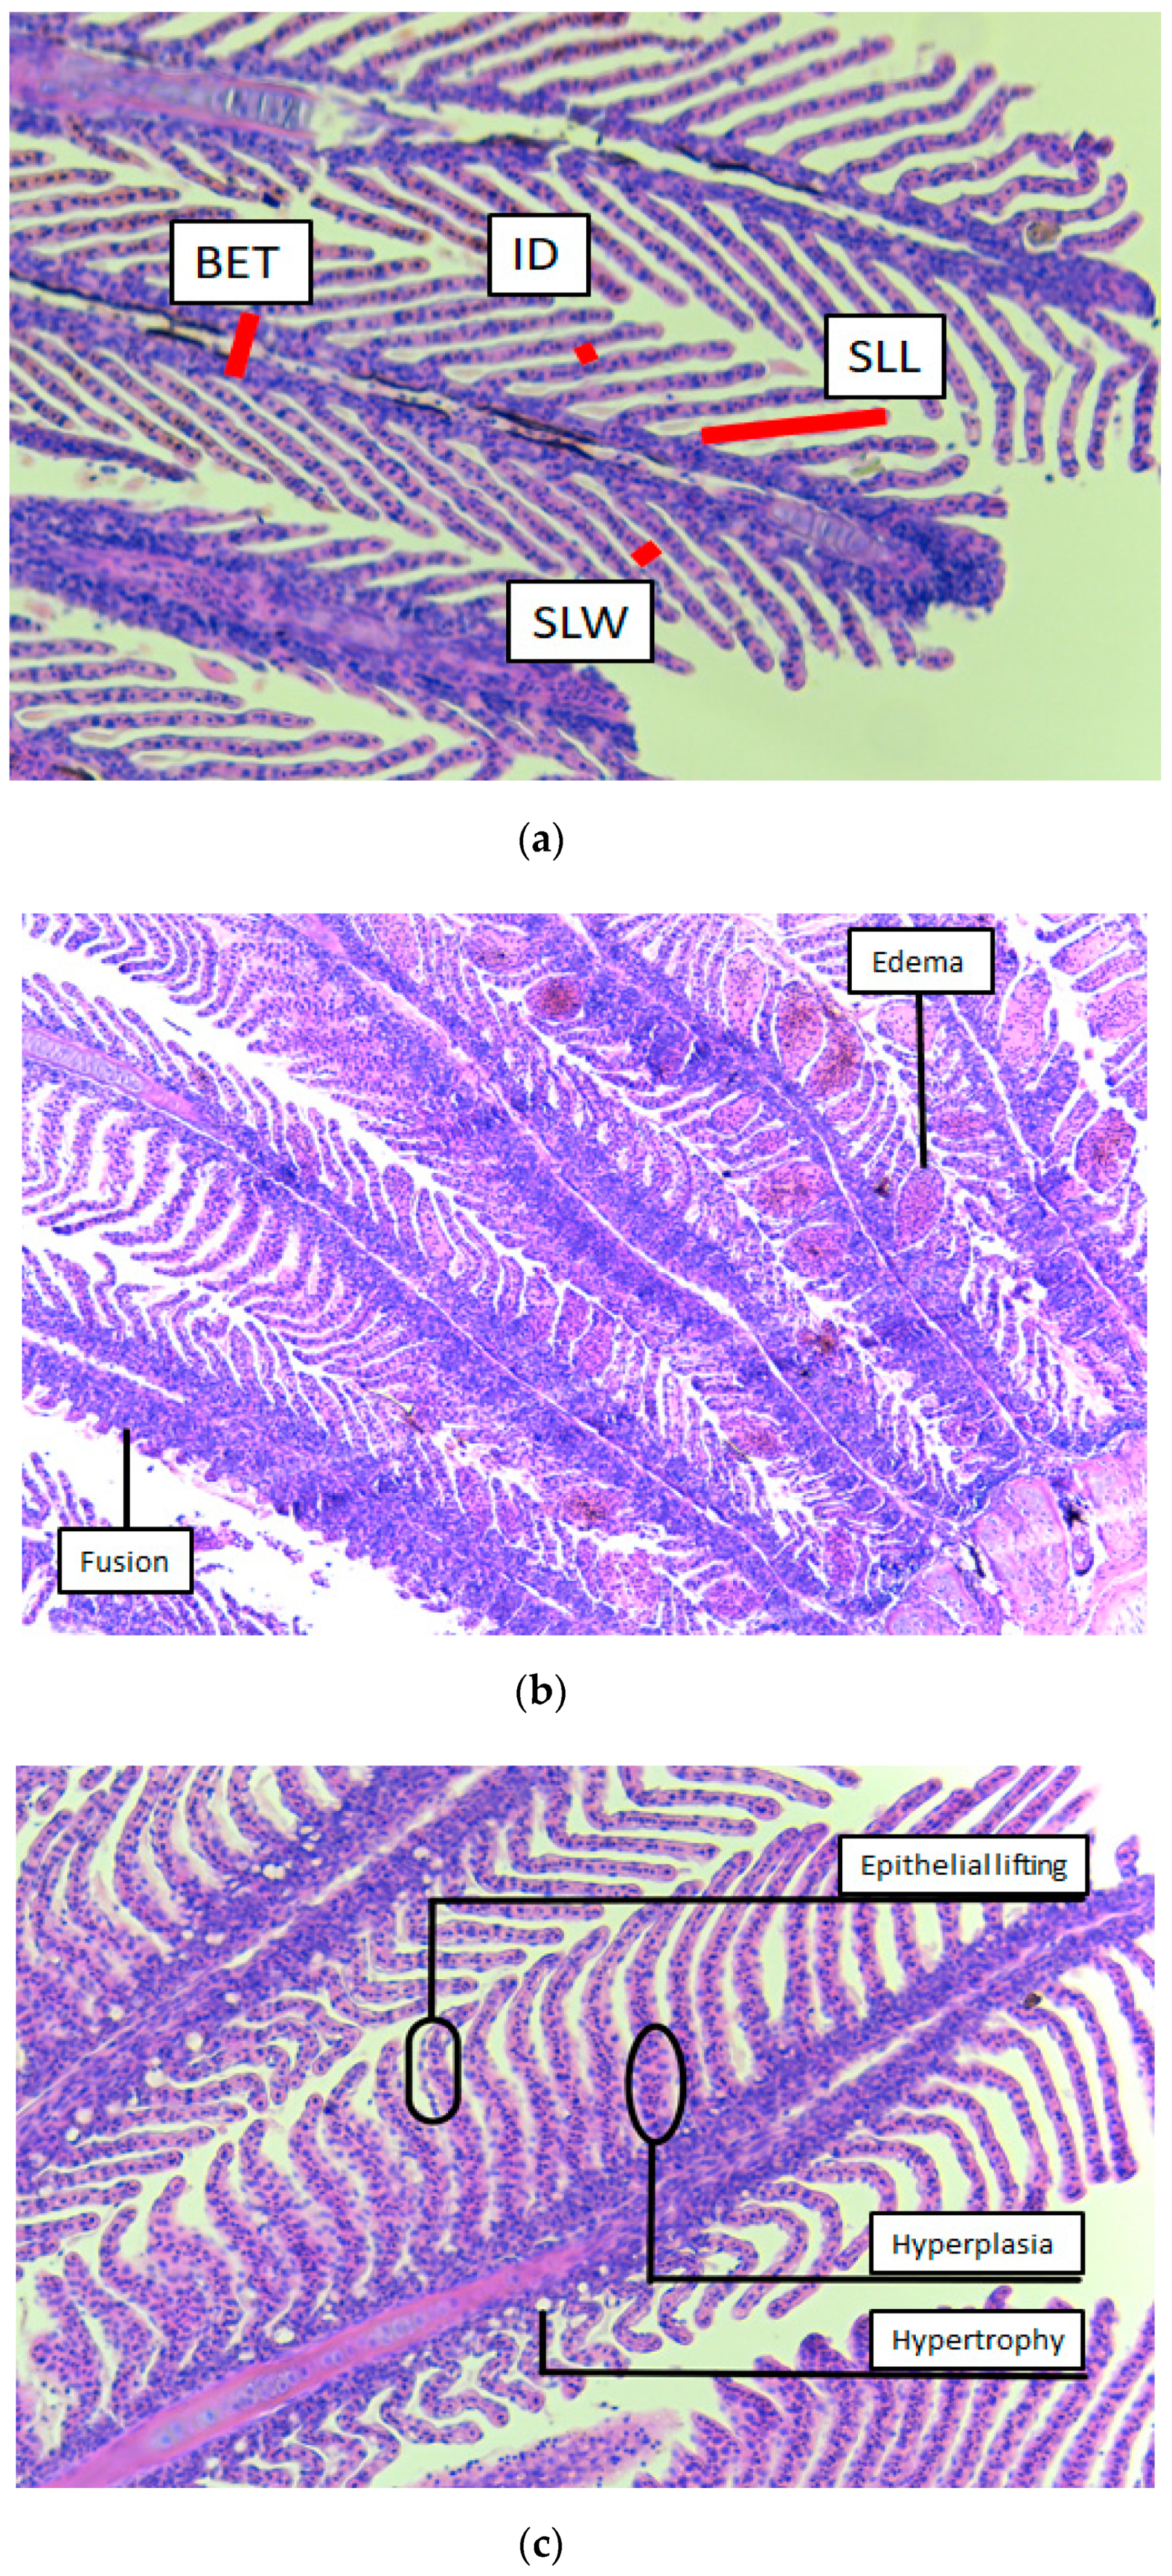
3.5. Histology
4. Discussion
5. Conclusions
Author Contributions
Funding
Conflicts of Interest
Appendix A


| Pathology | Score | Description |
|---|---|---|
| Hypertrophy | 1 | 1–2 cells swollen |
| 2 | Swollen cells on multiple lamellae | |
| 3 | Multiple affected cells on many lamellae | |
| 4 | Most lamellae have many affected cells | |
| Hyperplasia | 1 | Some lamellae (1–5) show hyperplasia |
| 2 | Most lamellae have some hyperplasia | |
| 3 | All lamellae show hyperplasia, beginning to fuse | |
| 4 | Lamellae are indistinguishable and all have severe hyperplasia | |
| Epithelial Lifting | 1 | Mild lifting at the base of the lamellae on 1–2 |
| 2 | 3–5 lamellae showing minor lifting | |
| 3 | Many lamellae have lifted epithelium moving to the tip | |
| 4 | Lamellae are lifted on the entirety of the lamellae and on most to all | |
| Lamellar fusion | 1 | 1–2 lamellae are fused/overlapping |
| 2 | Fusion of the many tips of lamellae | |
| 3 | Most of the lamellae are completely fused, otherwise tips fused | |
| 4 | There are no distinguishable parts of lamellae, all fused | |
| Edema | 1 | One or two lamellae are mildly swollen |
| 2 | 1–4 lamellae are more severely swollen, very blown up | |
| 3 | 4+ lamellae are affected, 1–2 are severe | |
| 4 | Many lamellae are completely swollen to the filament base. At least 3+ are severe |

References
- Park, M.; Park, M.-H. Evaluation of Watershed Susceptibility to Contaminants of Emerging Concern. J. Am. Water Works Assoc. 2015, 107, E174–E186. [Google Scholar] [CrossRef]
- Overturf, M.D.; Anderson, J.C.; Pandelides, Z.; Beyger, L.; Holdway, D.A. Pharmaceuticals and personal care products: A critical review of the impacts on fish reproduction. Crit. Rev. Toxicol. 2015, 45, 469–491. [Google Scholar] [CrossRef] [PubMed]
- Bahamonde, P.A.; Fuzzen, M.L.; Bennett, C.J.; Tetreault, G.R.; McMaster, M.E.; Servos, M.R.; Martyniuk, C.J.; Munkittrick, K.R. Whole organism responses and intersex severity in rainbow darter (Etheostoma caeruleum) following exposures to municipal wastewater in the Grand River basin, ON, Canada. Part A. Aquat. Toxicol. 2015, 159, 290–301. [Google Scholar] [CrossRef] [PubMed]
- Mehdi, H.; Dickson, F.H.; Bragg, L.M.; Servos, M.R.; Craig, P.M. Impacts of wastewater treatment plant effluent on energetics and stress response of rainbow darter (Etheostoma caeruleum) in the Grand River watershed. Comp. Biochem. Physiol. Part B Biochem. Mol. Biol. 2018, 224, 270–279. [Google Scholar] [CrossRef] [PubMed] [Green Version]
- Fuzzen, M.L.M.; Bragg, L.M.; Tetreault, G.R.; Bahamonde, P.A.; Tanna, R.N.; Bennett, C.J.; McMaster, M.E.; Servos, M.R. An assessment of the spatial and temporal variability of biological responses to municipal wastewater effluent in rainbow darter (Etheostoma caeruleum) collected along an urban gradient. PLoS ONE 2016, 11, e0164879. [Google Scholar] [CrossRef] [Green Version]
- Hicks, K.A.; Fuzzen, M.L.M.; McCann, E.K.; Arlos, M.J.; Bragg, L.M.; Kleywegt, S.; Tetreault, G.R.; McMaster, M.E.; Servos, M.R. Reduction of Intersex in a Wild Fish Population in Response to Major Municipal Wastewater Treatment Plant Upgrades. Environ. Sci. Technol. 2017, 51, 1811–1819. [Google Scholar] [CrossRef]
- Arlos, M.J.; Parker, W.J.; Bicudo, J.R.; Law, P.; Hicks, K.A.; Fuzzen, M.L.M.; Andrews, S.A.; Servos, M.R. Modeling the exposure of wild fish to endocrine active chemicals: Potential linkages of total estrogenicity to field-observed intersex. Water Res. 2018, 139, 187–197. [Google Scholar] [CrossRef]
- Chambers, P.A.; Allard, M.; Walker, S.L.; Marsalek, J.; Lawrence, J.; Servos, M.; Busnarda, J.; Munger, K.S.; Adare, K.; Jefferson, C.; et al. Impacts of municipal wastewater effluents on Canadian waters: A review. Water Qual. Res. J. Canada 1997, 32, 659–713. [Google Scholar] [CrossRef]
- Cooke, S. Water Quality in the Grand River: A Summary of Current Conditions (2000–2004) and Long Term Trends. Grand River Conservation Authority. 2006. Volume 17. Available online: https://www.grandriver.ca/en/our-watershed/resources/Documents/Water_Quality_Conditions_2006.pdf (accessed on 25 November 2020).
- CCME. Canada-Wide Strategy for the Management of Municipal Wastewater Effluent—2014 Progress Report; Canadian Council of Ministers of the Environment: Victoria, BC, Canada, 2014. [Google Scholar]
- Government of Canada Wastewater Systems Effluent Regulations: SOR/2012-139. Government Canada Justice Laws Website. 2016. Volume 66. Available online: https://laws-lois.justice.gc.ca/eng/regulations/sor-2012-139/fulltext.html (accessed on 25 November 2020).
- Srikanthan, N. Analysis of Temporal Changes in Estrogenic Compounds Released from Municipal Wastewater Treatment Plants. Master’s Thesis, University of Waterloo, Waterloo, ON, Canada, 2019; p. 122. [Google Scholar]
- Carey, R.O.; Migliaccio, K.W. Contribution of wastewater treatment plant effluents to nutrient dynamics in aquatic systems. Environ. Manag. 2009, 44, 205–217. [Google Scholar] [CrossRef]
- Tsai, C.-F. Water Quality and Fish Life below Sewage Outfalls. Trans. Am. Fish. Soc. 1973, 102, 281–292. [Google Scholar] [CrossRef]
- Water Quality Working Group. Grand River Water Management Plan 2013 Update Sources of Nutrients and Sediments in the Grand River Watershed; Water Quality Working Group: Cambridge, ON, Canada, 2013.
- Camargo, M.M.P.; Martinez, C.B.R. Histopathology of gills, kidney and liver of a Neotropical fish caged in an urban stream. Neotrop. Ichthyol. 2007, 5, 327–336. [Google Scholar] [CrossRef] [Green Version]
- Gomez Isaza, D.F.; Cramp, R.L.; Franklin, C.E. Living in polluted waters: A meta-analysis of the effects of nitrate and interactions with other environmental stressors on freshwater taxa. Environ. Pollut. 2020, 261, 114091. [Google Scholar] [CrossRef] [PubMed]
- Brooks, B.W.; Riley, T.M.; Taylor, R.D. Water quality of effluent-dominated ecosystems: Ecotoxicological, hydrological, and management considerations. Hydrobiologia 2006, 556, 365–379. [Google Scholar] [CrossRef]
- Adams, S.M.; Greeley, M.S. Ecotoxicological indicators of water quality: Using multi-response indicators to assess the health of aquatic ecosystems. Water. Air. Soil Pollut. 2000, 123, 103–115. [Google Scholar] [CrossRef]
- Diamond, S.R.; Sultana, T.; Servos, M.R.; Metcalfe, C.D. Biological responses to contaminants in darters (Etheostoma spp.) collected from rural and urban regions of the Grand River, ON, Canada. Comp. Biochem. Physiol. Part - B Biochem. Mol. Biol. 2016, 199, 126–135. [Google Scholar] [CrossRef] [PubMed]
- Barton, B.A.; Iwama, G.K. Physiological changes in fish from stress in aquaculture with emphasis on the response and effects of corticosteroids. Annu. Rev. Fish Dis. 1991, 1, 3–26. [Google Scholar] [CrossRef]
- Vijayan, M.M.; Aluru, N.; Leatherland, J.F. Stress Response and the Role of Cortisol. Fish Dis. Disord. 2010, 2, 182–201. [Google Scholar]
- Tetreault, G.R.; Bennett, C.J.; Shires, K.; Knight, B.; Servos, M.R.; McMaster, M.E. Intersex and reproductive impairment of wild fish exposed to multiple municipal wastewater discharges. Aquat. Toxicol. 2011, 104, 278–290. [Google Scholar] [CrossRef]
- McCallum, E.S.; Nikel, K.E.; Mehdi, H.; Du, S.N.N.; Bowman, J.E.; Midwood, J.D.; Kidd, K.A.; Scott, G.R.; Balshine, S. Municipal wastewater effluent affects fish communities: A multi-year study involving two wastewater treatment plants. Environ. Pollut. 2019, 252, 1730–1741. [Google Scholar] [CrossRef]
- Beyers, D.W.; Rice, J.A.; Clements, W.H.; Henry, C.J. Estimating physiological cost of chemical exposure: Integrating energetics and stress to quantify toxic effects in fish. Can. J. Fish. Aquat. Sci. 1999, 56, 814–822. [Google Scholar] [CrossRef]
- Claireaux, G.; Lefrançois, C. Linking environmental variability and fish performance: Integration through the concept of scope for activity. Philos. Trans. R. Soc. B Biol. Sci. 2007, 362, 2031–2041. [Google Scholar] [CrossRef] [Green Version]
- Treberg, J.R.; Killen, S.S.; MacCormack, T.J.; Lamarre, S.G.; Enders, E.C. Estimates of metabolic rate and major constituents of metabolic demand in fishes under field conditions: Methods, proxies, and new perspectives. Comp. Biochem. Physiol. Part A Mol. Integr. Physiol. 2016, 202, 10–22. [Google Scholar] [CrossRef] [PubMed] [Green Version]
- Evans, D.H.; Piermarini, P.M.; Choe, K.P. The multifunctional fish gill: Dominant site of gas exchange, osmoregulation, acid-base regulation, and excretion of nitrogenous waste. Physiol. Rev. 2005, 85, 97–177. [Google Scholar] [CrossRef] [PubMed]
- Wendelaar Bonga, S.E.; Lock, R.A.C. Toxicants and osmoregulation in fish. Netherlands J. Zool. 1991, 42, 478–493. [Google Scholar] [CrossRef] [Green Version]
- Evans, D.H. The fish gill: Site of action and model for toxic effects of environmental pollutants. Environ. Health Perspect. 1987, 71, 47–58. [Google Scholar] [CrossRef] [PubMed]
- Reis-Santos, P.; McCormick, S.D.; Wilson, J.M. Ionoregulatory changes during metamorphosis and salinity exposure of juvenile sea lamprey (Petromyzon marinus L.). J. Exp. Biol. 2008, 211, 978–988. [Google Scholar] [CrossRef] [Green Version]
- Bernet, D.; Schmidt-Posthaus, H.; Wahli, T.; Burkhardt-Holm, P. Effects of wastewater on fish health: An integrated approach to biomarker responses in brown trout (Salmo trutta L.). J. Aquat. Ecosyst. Stress Recover. 2000, 8, 143–151. [Google Scholar] [CrossRef]
- Liney, K.E.; Hagger, J.A.; Tyler, C.R.; Depledge, M.H.; Galloway, T.S.; Jobling, S. Health effects in fish of long-term exposure to effluents from wastewater treatment works. Environ. Health Perspect. 2006, 114, 81–89. [Google Scholar] [CrossRef] [Green Version]
- Du, S.N.N.; McCallum, E.S.; Vaseghi-Shanjani, M.; Choi, J.A.; Warriner, T.R.; Balshine, S.; Scott, G.R. Metabolic Costs of Exposure to Wastewater Effluent Lead to Compensatory Adjustments in Respiratory Physiology in Bluegill Sunfish. Environ. Sci. Technol. 2018, 52, 801–811. [Google Scholar] [CrossRef]
- Farrell, A.P.; Kennedy, C.J.; Kolok, A. Effects of wastewater from an oil-sand-refining operation on survival, hematology, gill histology, and swimming of fathead minnows. Can. J. Zool. 2004, 82, 1519–1527. [Google Scholar] [CrossRef]
- Corbett, P.A.; King, C.K.; Stark, J.S.; Mondon, J.A. Direct evidence of histopathological impacts of wastewater discharge on resident Antarctic fish (Trematomus bernacchii) at Davis Station, East Antarctica. Mar. Pollut. Bull. 2014, 87, 48–56. [Google Scholar] [CrossRef] [PubMed]
- Hicks, K.A.; Servos, M.R. Site fidelity and movement of a small-bodied fish species, the rainbow darter (Etheostoma caeruleum): Implications for environmental effects assessment. River Res. Appl. 2017, 33, 1016–1025. [Google Scholar] [CrossRef]
- Mochnacz, N.J.; Kissinger, B.C.; Deslauriers, D.; Guzzo, M.M.; Enders, E.C.; Anderson, W.G.; Docker, M.F.; Isaak, D.J.; Durhack, T.C.; Treberg, J.R. Development and testing of a simple field-based intermittent-flow respirometry system for riverine fishes. Conserv. Physiol. 2017, 5. [Google Scholar] [CrossRef] [PubMed] [Green Version]
- Roche, D.G.; Binning, S.A.; Bosiger, Y.; Johansen, J.L.; Rummer, J.L. Finding the best estimates of metabolic rates in a coral reef fish. J. Exp. Biol. 2013, 216, 2103–2110. [Google Scholar] [CrossRef] [PubMed] [Green Version]
- Gillooly, J.F.; Brown, J.H.; West, G.B.; Savage, V.M.; Charnov, E.L. Effects of size and temperature on metabolic rate. Science 2001, 293, 2248–2251. [Google Scholar] [CrossRef] [Green Version]
- Tetreault, G.R.; Bennett, C.J.; Cheng, C.; Servos, M.R.; McMaster, M.E. Reproductive and histopathological effects in wild fish inhabiting an effluent-dominated stream, Wascana Creek, SK, Canada. Aquat. Toxicol. 2012, 110–111, 149–161. [Google Scholar] [CrossRef]
- Schindelin, J.; Arganda-Carreras, I.; Frise, E.; Kaynig, V.; Longair, M.; Pietzsch, T.; Preibisch, S.; Rueden, C.; Saalfeld, S.; Schmid, B.; et al. Fiji: An open-source platform for biological-image analysis. Nat. Methods 2012, 9, 676–682. [Google Scholar] [CrossRef] [Green Version]
- Poleksic, V.; Mitrovic-Tutundzic, V. Fish gills as a monitor of sublethal and chronic effects of pollution. Sublethal Chronic Eff. Pollut. Freshw. Fish 1994, 339–352. [Google Scholar]
- Tran, N.H.; Gin, K.Y.H. Occurrence and removal of pharmaceuticals, hormones, personal care products, and endocrine disrupters in a full-scale water reclamation plant. Sci. Total Environ. 2017, 599–600, 1503–1516. [Google Scholar] [CrossRef]
- Vieno, N.; Sillanpää, M. Fate of diclofenac in municipal wastewater treatment plant—A review. Environ. Int. 2014, 69, 28–39. [Google Scholar] [CrossRef]
- Coors, A.; De Meester, L. Synergistic, antagonistic and additive effects of multiple stressors: Predation threat, parasitism and pesticide exposure in Daphnia magna. J. Appl. Ecol. 2008, 45, 1820–1828. [Google Scholar] [CrossRef]
- Metcalfe, C.D.; Chu, S.; Judt, C.; Li, H.; Oakes, K.D.; Servos, M.R.; Andrews, D.M. Antidepressants and their metabolites in municipal wastewater, and downstream exposure in an urban watershed. Environ. Toxicol. Chem. 2010, 29, 79–89. [Google Scholar] [CrossRef] [PubMed]
- Marjan, P.; Martyniuk, C.J.; Fuzzen, M.L.M.; MacLatchy, D.L.; McMaster, M.E.; Servos, M.R. Returning to normal? Assessing transcriptome recovery over time in male rainbow darter (Etheostoma caeruleum) liver in response to wastewater-treatment plant upgrades. Environ. Toxicol. Chem. 2017, 36, 2108–2122. [Google Scholar] [CrossRef] [PubMed]
- Anderson, M. ; GRWMP Assimilative Capacity Working Group. Assessment of Future Water Quality Conditions in the Grand and Speed Rivers; GRWMP Assimilative Capacity Working Group: Cambridge, ON, Canada, 2012. [Google Scholar]
- Gonzalez, R.J.; Mcdonald, D.G. The Relationship Between Oxygen Uptake And Ion Loss In Fish From Diverse Habitats. J. Exp. Biol. 1994, 190, 95–108. [Google Scholar]
- McCallum, E.S.; Du, S.N.N.; Vaseghi-Shanjani, M.; Choi, J.A.; Warriner, T.R.; Sultana, T.; Scott, G.R.; Balshine, S. In situ exposure to wastewater effluent reduces survival but has little effect on the behaviour or physiology of an invasive Great Lakes fish. Aquat. Toxicol. 2017, 184, 37–48. [Google Scholar] [CrossRef]
- Du, S.N.N.; Choi, J.A.; McCallum, E.S.; McLean, A.R.; Borowiec, B.G.; Balshine, S.; Scott, G.R. Metabolic implications of exposure to wastewater effluent in bluegill sunfish. Comp. Biochem. Physiol. Part C Toxicol. Pharmacol. 2019, 224, 108562. [Google Scholar] [CrossRef]
- Martin, J.M.; Saaristo, M.; Tan, H.; Bertram, M.G.; Nagarajan-Radha, V.; Dowling, D.K.; Wong, B.B.M. Field-realistic antidepressant exposure disrupts group foraging dynamics in mosquitofish. Biol. Lett. 2019, 15, 20190615. [Google Scholar] [CrossRef] [Green Version]
- Handy, R.D.; Sims, D.W.; Giles, A.; Campbell, H.A.; Musonda, M.M. Metabolic trade-off between locomotion and detoxification for maintenance of blood chemistry and growth parameters by rainbow trout (Oncorhynchus mykiss) during chronic dietary exposure to copper. Aquat. Toxicol. 1999, 47, 23–41. [Google Scholar] [CrossRef]
- Campbell, H.A.; Handy, R.D.; Sims, D.W. Increased metabolic cost of swimming and consequent alterations to circadian activity in rainbow trout (Oncorhynchus mykiss) exposed to dietary copper. Can. J. Fish. Aquat. Sci. 2002, 59, 768–777. [Google Scholar] [CrossRef]
- Melvin, S.D. Short-term exposure to municipal wastewater influences energy, growth, and swimming performance in juvenile Empire Gudgeons (Hypseleotris compressa). Aquat. Toxicol. 2016, 170, 271–278. [Google Scholar] [CrossRef]
- Hlohowskyj, I.; Wissing, T.E. Seasonal changes in low oxygen tolerance of fantail, Etheostoma flabellare, rainbow, E. caeruleum, and greenside, E. blennioides, darters. Environ. Biol. Fishes 1987, 18, 277–283. [Google Scholar] [CrossRef]
- Claireaux, G.; Webber, D.M.; Lagardère, J.P.; Kerr, S.R. Influence of water temperature and oxygenation on the aerobic metabolic scope of Atlantic cod (Gadus morhua). J. Sea Res. 2000, 44, 257–265. [Google Scholar] [CrossRef] [Green Version]
- Rummer, J.L.; Stecyk, J.A.W.; Couturier, C.S.; Watson, S.-A.; Nilsson, G.E.; Munday, P.L. Elevated CO2 enhances aerobic scope of a coral reef fish. Conserv. Physiol. 2013, 1. [Google Scholar] [CrossRef] [PubMed] [Green Version]
- Borowiec, B.G.; Crans, K.D.; Khajali, F.; Pranckevicius, N.A.; Young, A.; Scott, G.R. Interspecific and environment-induced variation in hypoxia tolerance in sunfish. Comp. Biochem. Physiol. Part A Mol. Integr. Physiol. 2016, 198, 59–71. [Google Scholar] [CrossRef] [PubMed]
- Ingersoll, C.G.; Claussen, D.L. Temperature selection and critical thermal maxima of the fantail darter, Etheostoma flabellare, and johnny darter, E. nigrum, related to habitat and season. Environ. Biol. Fishes 1984, 11, 131–138. [Google Scholar] [CrossRef]
- Hlohowskyj, I.; Wissing, T. Substrate Selection by Fantail (Etheostoma flabellare), Greenside (E. blennioides), and Rainbow (E. caeruleum) Darters. Ohio J. Sci. 1986, 86, 124–129. [Google Scholar]
- Schlosser, I.J.; Toth, L.A. Niche Relationships and Population Ecology of Rainbow (Etheostoma Caeruleum) and Fantail (E. Flabellare) Darters in a Temporally Variable Environment. Oikos 1984, 42, 229. [Google Scholar] [CrossRef]
- Hlohowskyj, I.; Wissing, T.E. Seasonal changes in the critical thermal maxima of fantail (Etheostoma flabellare), greenside (Etheostoma blennioides), and rainbow (Etheostoma caeruleum) darters. Can. J. Zool. 1985, 63, 1629–1633. [Google Scholar] [CrossRef]
- Nascimento, A.A.; Araújo, F.G.; Gomes, I.D.; Mendes, R.M.M.; Sales, A. Fish Gills Alterations as Potential Biomarkers of Environmental Quality in a Eutrophized Tropical River in South-Eastern Brazil. Anat. Histol. Embryol. 2012, 41, 209–216. [Google Scholar] [CrossRef]
- Mallatt, J. Fish gill structural changes induced by toxicants and other irritants: A statistical review. Can. J. Fish. Aquat. Sci. 1985, 42, 630–648. [Google Scholar] [CrossRef]
- Flores-Lopes, F.; Thomaz, A.T. Histopathologic alterations observed in fish gills as a tool in environmental monitoring (Alterações histopatológicas observadas nas brânquias de peixes como instrumento no monitoramento ambiental). Brazilian J. Biol. 2011, 71, 179–188. [Google Scholar] [CrossRef] [PubMed]
- Mckim, J.M.; Erickson, R.J. Environmental Impacts on the Physiological Mechanisms Controlling Xenobiotic Transfer across Fish Gills. Source Physiol. Zool. 1991, 64, 39–67. [Google Scholar] [CrossRef]
- Schwaiger, J.; Wanke, R.; Adam, S.; Pawert, M.; Hönnen, W.; Triebskorn, R. The use of histopathological indicators to evaluate contaminant-related stress in fish. J. Aquat. Ecosyst. Stress Recover. 1997, 6, 75–86. [Google Scholar] [CrossRef]
- Gilmour, K.M. Gas Exchange. Physiol. Fishes 1997, 101–128. [Google Scholar]
- Wright, P.A.; Wood, C.M. Seven things fish know about ammonia and we don’t. Respir. Physiol. Neurobiol. 2012, 184, 231–240. [Google Scholar] [CrossRef]
- Claiborne, J.B.; Edwards, S.L.; Morrison-Shetlar, A.I. Gill circulation: Regulation of perfusion distribution and metabolism of regulatory molecules. J. Exp. Zool. 2002, 293, 320–335. [Google Scholar] [CrossRef]
- Cumming, H.; Herbert, N.A. Gill structural change in response to turbidity has no effect on the oxygen uptake of a juvenile sparid fish. Conserv. Physiol. 2016, 4. [Google Scholar] [CrossRef] [Green Version]
- Dussault, È.B.; Playle, R.C.; Dixon, D.G.; McKinley, R.S. Effects of sublethal, acidic aluminum exposure on blood ions and metabolites, cardiac output, heart rate, and stroke volume of rainbow trout, Oncorhynchus mykiss. Fish Physiol. Biochem. 2001, 25, 347–357. [Google Scholar] [CrossRef]
- Nilsson, G.E. Gill remodeling in fish—A new fashion or an ancient secret? J. Exp. Biol. 2007, 210, 2403–2409. [Google Scholar] [CrossRef] [Green Version]
- Holbert, P.W.; Boland, E.J.; Olson, K.R. The Effect of Epinephrine and Acetylcholine on the Distribution of Red Cells Within the Gills of the Channel Catfish (Ictalurus Punctatus). J. Exp. Biol. 1979, 79, 135–146. [Google Scholar]
- Nikel, K.E. Wild Fish Responses to Wastewater Treatment Plant Upgrades in the Grand River, Ontario. Master’s Thesis, University of Waterloo, Waterloo, ON, Canada, 2020; pp. 1–93. [Google Scholar]


| Season | Site | Temp (°C) | DO (mg/L) | Avg. Conductivity (μS/cm) | TDS (ppm) | pH | Turbidity (NTUs) |
|---|---|---|---|---|---|---|---|
| Summer 2019 | US1 | 23.47 ± 0.03 | 7.39 ± 0.03 | 384.70 ± 0.26 | 275.60 ± 0.00 | 8.37 ± 0.03 | 5.07 ± 0.28 |
| US2 | 23.035 ± 0.03 | * 8.43 ± 0.09 | 422.83 ± 0.41 | - | - | 4.75 ± 0.66 | |
| DS1 | 24.52 ± 0.03 | * 12.86 ± 0.20 | * 627.33 ± 27.88 | * 416.00 ± 18.39 | 8.39 ± 0.00 | 4.68 ± 0.56 | |
| DS2 | 25.27 ± 0.07 | * 10.10 ± 0.18 | * 512.33 ± 4.84 | * 346.67 ± 3.54 | 8.56 ± 0.04 | 4.35 ± 0.21 | |
| Fall 2019 | US1 | 9.10 ± 0.19 | - | 268.10 ± 1.08 | 251.02 ± 0.49 | 8.5 ± 0.0 | 3.34 ± 0.48 |
| US2 | * 11.53 ± 0.07 | - | * 373.07 ± 0.40 | * 326.52 ± 0.47 | 8.46 ± 0.0 | 6.90 ± 0.76 | |
| DS1 | 9.20 ± 0.05 | - | * 479.57 ± 7.17 | * 446.12 ± 6.80 | * 7.48 ± 0.1 | 5.43 ± 0.23 | |
| DS2 | 9.07 ± 0.05 | - | * 351.77 ± 2.03 | 295.45 ± 27.23 | 8.33 ± 0.0 | 3.50 ± 0.14 |
| Site Fall 2019 | Ammonia (mg/L) | Nitrite (mg/L) | Nitrate (mg/L) | Chloride (mg/L) |
|---|---|---|---|---|
| US1 | 0.00 ± 0.00 | 0.01 ± 0.00 | 1.56 ± 0.10 | 27.66 ± 1.30 |
| US2 | 0.00 ± 0.00 | 0.03 ± 0.00 | * 3.94 ± 0.00 | 54.01 ± 0.30 |
| DS1 | * 0.10 ± 0.00 | * 0.08 ± 0.00 | * 6.50 ± 1.10 | * 77.66 ± 3.60 |
| DS2 | * 0.10 ± 0.00 | * 0.07 ± 0.00 | * 3.69 ± 1.00 | 46.29 ± 3.60 |
| Season | Species | Sex (n) | Length (cm) | Mass (g) | Body Condition (k) | |||||||||
|---|---|---|---|---|---|---|---|---|---|---|---|---|---|---|
| US1 | US2 | DS1 | DS2 | US1 | US2 | DS1 | DS2 | US1 | US2 | DS1 | DS2 | |||
| Summer 2019 | RBD | F (7,7,8,8) | 5.9 ± 2.2 | 5.6 ± 2.1 | 5.4 ± 1.7 | 5.1 ± 2.1 | 2.52 ± 0.89 | 2.47 ± 0.87 | 2.04 ± 0.64 | 1.77 ± 0.72 | 1.21 ± 0.46 | 1.32 ± 0.49 | 1.26 ± 0.40 | 1.23 ± 0.50 |
| M (7,7,10,6) | 5.96 ± 2.3 | 5.99 ± 2.2 | 5.79 ± 2.05 | 5.44 ± 1.9 | 3.03 ± 1.07 | 2.97 ± 1.05 | 2.75 ± 0.97 | 2.14 ± 0.76 | 1.40 ± 0.53 | 1.33 ± 0.50 | 1.40 ± 0.50 | 1.27 ± 0.45 | ||
| FTD | F (11,9,8,4) | 5.7 ± 2.8 | 5.7 ± 2.5 | 5.7 ± 1.5 | 5.3 ± 1.6 | 1.80 ± 0.80 | 2.02 ± 0.82 | 2.20 ± 0.59 | 1.61 ± 0.51 | 0.98 ± 0.49 | 1.08 ± 0.48 | 1.22 ± 0.33 | 1.09 ± 0.33 | |
| M (4,5,14,11) | 5.9 ± 1.8 | 5.5 ± 1.8 | 5.8 ± 2.1 | 6.1 ± 3.1 | 1.92 ± 0.58 | 1.82 ± 0.57 | 2.04 ± 0.72 | 2.45 ± 1.23 | 0.95 ± 0.29 | 1.07 ± 0.36 | 1.01 ± 0.36 | 1.07 ± 0.54 | ||
| GSD | F (6,6,12,9) | 6.9 ± 2.4 | 7.0 ± 2.9 | * 8.0 ± 2.2 | 7.3 ± 3.3 | 4.16 ± 1.38 | 4.00 ± 1.41 | * 5.89 ± 1.70 | 4.68 ± 2.09 | 1.14 ± 0.40 | 1.12 ± 0.46 | 1.14 ± 0.33 | 1.19 ± 0.53 | |
| M (8,6,13,5) | 7.7 ± 3.1 | 7.3 ± 3.0 | 7.6 ± 2.2 | 8.1 ± 2.69 | 5.47 ± 2.07 | 4.57 ± 1.62 | 5.05 ± 1.52 | 4.68 ± 2.12 | 1.20 ± 0.5 | 1.1 ± 0.46 | 1.13 ± 0.33 | 1.21 ± 0.40 | ||
| Fall 2019 | RBD | F (6,9,6,7) | 5.2 ± 2.1 | 5.1 ± 1.7 | 5.2 ± 2.1 | 5.08 ± 1.9 | 1.54 ± 0.63 | 1.67 ± 0.56 | 1.93 ± 0.79 | 1.73 ± 0.65 | 1.08 ± 0.44 | 1.17 ± 0.39 | * 1.27 ± 0.52 | 1.17 ± 0.44 |
| M (8,5,8,7) | 5.25 ± 1.9 | 5.12 ± 2.29 | * 6.26 ± 2.2 | 6.01 ± 2.3 | 1.83 ± 0.65 | 1.69 ± 0.75 | 3.32 ± 1.17 | 2.98 ± 1.12 | 1.25 ± 0.44 | 1.17 ± 0.53 | 1.32 ± 0.47 | 1.33 ± 0.50 | ||
| FTD | F (5,4,7,6) | 5.02 ± 2.2 | 4.63 ± 2.3 | 4.96 ± 1.9 | 4.95 ± 2.0 | 1.34 ± 0.60 | 0.96 ± 0.48 | 1.23 ± 0.47 | 1.21 ± 0.50 | 1.04 ± 0.47 | 0.92 ± 0.46 | 0.95 ± 0.36 | 0.97 ± 0.39 | |
| M (9,10,7,8) | 5.64 ± 1.9 | 5.84 ± 1.9 | 5.70 ± 2.2 | 5.46 ± 1.9 | 1.69 ± 0.56 | 1.79 ± 0.57 | 2.06 ± 0.78 | 1.81 ± 0.64 | 0.93 ± 0.31 | 0.87 ± 0.27 | 0.98 ± 0.37 | 1.05 ± 0.37 | ||
| GSD | F (8,3,N/A,2) | 6.75 ± 2.4 | 5.43 ± 3.14 | N/A | 5.65 ± 4.0 | 3.57 ± 1.26 | * 1.58 ± 0.91 | N/A | 1.73 ± 1.23 | 1.12 ± 0.40 | 0.98 ± 0.56 | N/A | 0.94 ± 0.67 | |
| M (6,11,14,12) | 6.05 ± 2.5 | 5.98 ± 1.8 | 5.81 ± 1.6 | 6.16 ± 1.8 | 2.57 ± 1.05 | 1.95 ± 0.59 | 2.18 ± 0.58 | 2.56 ± 0.74 | 1.03 ± 0.42 | 0.93 ± 0.28 | 1.06 ± 0.28 | 1.03 ± 0.30 | ||
Publisher’s Note: MDPI stays neutral with regard to jurisdictional claims in published maps and institutional affiliations. |
© 2020 by the authors. Licensee MDPI, Basel, Switzerland. This article is an open access article distributed under the terms and conditions of the Creative Commons Attribution (CC BY) license (http://creativecommons.org/licenses/by/4.0/).
Share and Cite
Hodgson, R.; Bragg, L.; Dhiyebi, H.A.; Servos, M.R.; Craig, P.M. Impacts on Metabolism and Gill Physiology of Darter Species (Etheostoma spp.) That Are Attributed to Wastewater Effluent in the Grand River. Appl. Sci. 2020, 10, 8364. https://doi.org/10.3390/app10238364
Hodgson R, Bragg L, Dhiyebi HA, Servos MR, Craig PM. Impacts on Metabolism and Gill Physiology of Darter Species (Etheostoma spp.) That Are Attributed to Wastewater Effluent in the Grand River. Applied Sciences. 2020; 10(23):8364. https://doi.org/10.3390/app10238364
Chicago/Turabian StyleHodgson, Rhiannon, Leslie Bragg, Hadi A. Dhiyebi, Mark R. Servos, and Paul M. Craig. 2020. "Impacts on Metabolism and Gill Physiology of Darter Species (Etheostoma spp.) That Are Attributed to Wastewater Effluent in the Grand River" Applied Sciences 10, no. 23: 8364. https://doi.org/10.3390/app10238364