

Health Impact Related to Ambient Particulate Matter Exposure as a Spatial Health Risk Map Case Study in Chiang Mai, Thailand


1
Program in Industrial Engineering, Department of Industrial Engineering, Faculty of Engineering, Chiang Mai University, Chiang Mai 50200, Thailand
2
The Joint Graduate School of Energy and Environment, King Mongkut’s University of Technology Thonburi, Bangkok 10140, Thailand
3
Centre of Excellence on Energy Technology and Environment (CEE), Ministry of Higher Education, Science, Research and Innovation, Bangkok 10140, Thailand
4
Department of Industrial Engineering, Faculty of Engineering, Chiang Mai University, Chiang Mai 50200, Thailand
5
Research Unit for Energy, Economic and Ecological Management, Science and Technology Research Institute, Chiang Mai University, Chiang Mai 50200, Thailand
*
Author to whom correspondence should be addressed.
Atmosphere 2023, 14(2), 261; https://doi.org/10.3390/atmos14020261
Submission received: 28 December 2022
/
Revised: 20 January 2023
/
Accepted: 26 January 2023
/
Published: 28 January 2023
(This article belongs to the Special Issue Sources, Spatio-Temporal Distribution and Health Effects of Atmospheric Compositions)
Abstract
:Chiang Mai has been one of the most polluted cities globally, exceeding the PM2.5 quality standards for decades and facing hazardous air pollution on an annual basis. As ambient PM2.5 strongly affects human health, this study aims to investigate the hotspots of PM2.5 and health impact areas due to exposure to PM2.5 by illustrating a spatial distribution via a Chiang Mai health risk map. The association between PM2.5 concentration and human health impact were assessed using Pearson’s correlation, focused on the peak period from January to April 2021 in Chiang Mai. The primary data on PM2.5 concentration were collected using low-cost sensors. The health impact is based on the number of hospital admissions in all incidences of diseases due to PM2.5 exposure following the ICD-10. The results showed that the highest polluted and health-risk areas were located in the center of Chiang Mai, especially in the Mueang district. PM2.5 concentration was highly correlated with the incidence of dermatitis (R = 0.84), conjunctivitis (R = 0.81), stroke (R = 0.74), and lung cancer (R = 0.73). Thus, the increased PM2.5 concentration resulted in heightened hospital admissions. The results provide insightful information for policymakers and local public health organizations regarding priority areas in resource management.
1. Introduction
In recent years, ambient particulate matter (PM2.5) has been a serious pollution problem worldwide that has adverse effects on human health. The reason for that, on the one hand, relates to its aerodynamic diameter, which is less than or equal to 2.5 µm, and on the other hand, its ability to enter the human respiratory system through the nasal passages. With particle size influencing the deposition in the respiratory system, the PM2.5 particles will be in contact with fluids and epithelia and thus be able to be dissolved in the bloodstream causing damage to human health [1]. Exposure to PM2.5 can lead to significant dangers to health both in the short and long term. Furthermore, a high PM2.5 concentration heightens the risk of total morbidity [2] and mortality [3], including cardiorespiratory diseases such as asthma, bronchitis, chronic obstructive pulmonary disease (COPD) [4], ischemic heart disease, cerebrovascular disease, and lung cancer [5]. In addition, exposure to PM2.5 can lead to premature death and increased morbidity [6].
In Thailand, the air pollution problem associated with fine particulate matter occurs on a seasonal basis, which is different for each area of the country. For instance, Bangkok, the capital of Thailand, has a high concentration of PM2.5 between November to February [7]. The significant pollution in Bangkok is from cars on the road. In Chiang Mai, the biggest city in northern Thailand, the period of haze starts at the beginning of January and ends in April [8]. There are many driving factors related to a variety of different PM2.5 concentration levels in Chiang Mai, such as topography, which includes being surrounded by high mountains, wind speed, transboundary air pollution from nearby countries, and open biomass burning from agriculture [9,10,11].
Furthermore, Chiang Mai has been ranked the most air-polluted province in Thailand, exposed to levels exceeding the daily standard of the air quality index (15 µg/m3 as per the World Health Organization; WHO and 50 µg/m3 as per the Thai Pollution Control Department; PCD). The high concentrations of PM2.5 are associated with human health effects, especially in the sensitive group [12]. In 2019, the highest PM2.5 concentration recorded in Chiang Mai by the Thai Pollution Control Department reached 241 µg/m3 and, in 2020, 276 µg/m3, which is considered a hazardous air quality level for human health.
For decades, studies on the health impact of exposure to ambient particulate matter (PM2.5) have been getting more attention in many countries. Pozzer et al. [13] computed the total deaths from respiratory and cardiovascular diseases due to long-term exposure to PM2.5 in the Verona province, Italy. Stowell et al. [4] estimated the acute cardiorespiratory diseases from PM2.5 in Colorado during the wildfire seasons. Kihal-Talantikite et al. [14] analyzed the number of deaths attributed to the different levels of PM10, PM2.5, and NO2 in Paris. Zhu et al. [6] and Song et al. [15] estimated the relationship between PM2.5 pollution and health impacts across 129 cities in China. Balakrishnan et al. [16] focused on the number of deaths and life expectancy from exposure to the exceeded standard level of pollution in India. Janssen et al. [17] investigated the association of PM2.5 and PM10 on all-cause mortality rates such as cardiovascular disease, respiratory diseases, pneumonia, COPD, and influenza in the Netherlands.
There has been increasing concern in Thailand about the health impact of PM2.5. The studies of Fold et al. [18] concentrated on the consequences of particulate matter on Bangkok’s annual cardiopulmonary and lung cancer mortalities. Pothirat et al. [19] determined the increase of PM2.5 and the risk of death rate caused by COPD, cardiovascular disease, death, and sepsis in Chiang Mai, Thailand. Chavanaves et al. [20] researched the health effect of PM2.5 from vehicle emissions in Bangkok. Mueller et al. [21] calculated the overall cost in Thailand from long-term exposure to PM2.5’s impact on health, including lower respiratory infections (LRIs), stroke, COPD, lung cancer, and IHD diseases. The empirical epidemiological studies of Johnston et al. [22] reviewed the health impact of level of exposure to PM sources from biomass burning, such as cooking, agriculture burning, and wildfire, and identified the toxicity of pollution from different sources. Moreover, Ruchiraset and Tantrakarnapa [23] predicted the health impact in the case of the number of pneumonia admissions related to pollution in Chiang Mai by using the ARIMA model.
Previous studies investigated PM2.5 pollution and its effect on health with respect to some diseases. However, this is the first study on the analysis of the relationship between PM2.5 and health impact covering all diseases caused by exposure to particulate matter following the 10th revision of the International Statistical Classification of Diseases (ICD-10) in the Chiang Mai area. The diseases caused by exposure to particulate matter following ICD-10 include asthma, bronchitis, chronic obstructive pulmonary disease, acute pharyngitis, acute ischemic heart disease (AIHD), cerebrovascular disease (stroke), chronic rhinitis, conjunctivitis, dermatitis, influenza, pneumonia, and lung cancer. Such overall coverage has not been found in other similar studies in the literature.
Moreover, there is an urgent need to respond to the public concerns over the health effects of exposure to PM2.5 pollution in a specific area, especially in Chiang Mai, Thailand, which has been affected by air pollution for many years. This study analyzed the health effects of exposure to PM2.5 in a variety of locations and determined the hotspots in the Chiang Mai province from January to April; moreover, the association of exposure to particulate matter and health impact from hospital admissions for serious diseases were assessed. The results have also been presented in a spatial pattern as a health risk map.
2. Materials and Methods
2.1. Study Area and Data Sources
The Chiang Mai province was chosen as the focus area. It is the largest province in the north of Thailand, covering 20,107 km2. The geographical location of the Chiang Mai province is shown in Figure 1. The Chiang Mai province has 25 districts; based on the Department of Provincial Administration of Thailand in 2020, the overall number of residents is roughly 1.78 million.
According to the observations, the peak period of PM2.5 pollution in Chiang Mai starts at the beginning of January and ends in April [8]. The quantitative data in this study included PM2.5 concentrations, hospitalization due to PM2.5 exposure, population, temperature, and rainfall, which were collected from January to April 2021.
Monitoring PM2.5 concentration is an initial step in assessing the sources and levels of PM2.5. However, there is a limitation on the extent of available traditional ground monitoring [24]. Thus, low-cost sensors were widely used to monitor the pollution level, which allowed access to real-time data. Further, the advantage of small-size sensors being less expensive than traditional sensors may contribute to the ease of carrying and installation, even in remote areas.
Some countries have applied low-cost sensors to detect PM2.5 concentration, such as the AEROCET 531S sensor in Dhaka (Bangladesh), Edimax Airbox and Alphasense OPC-N2 sensor in Indonesia, Pocket PM2.5 sensor and AS-LUNG-O sensor in Myanmar and Taiwan, and Plantower sensor in Thailand and Vietnam. However, in Thailand, the Plantower sensors measure PM2.5 in specific areas only in the Tak and Nan provinces [25].
The DustBoy low-cost sensor is a project established by the National Research Council of Thailand (NRCT) in collaboration with the Ministry of Higher Education, Science, Research and Innovation. The DustBoy sensor detects fine particles in the air through light scattering methods using the commercial sensor PMS5003. For calibration purposes, the data based on the DustBoy were co-located with the Pollution Control Department’s (PCD) standard sensor with a percent precision error of less than 15 to ensure acceptable air pollution measurements, guided by the U.S. Environmental Protection Agency (The U.S. EPA). DustBoy monitoring stations with low-cost sensors are located at 105 site stations across the Chiang Mai province; PM2.5 concentration data in real-time are available at https://www.cmuccdc.org, accessed on 30 May 2021.
PM2.5 concentrations were gathered from the 105 DustBoy monitoring sites. The PM2.5 concentration of each district was from processing the daily PM2.5 concentrations, which were averaged monthly and grouped by district. Then, the average concentration of PM2.5 in each district was calculated using the population-weighted mean method.
In addition, the human health impact was measured through the number of hospital admissions related to diseases linked to exposure to particulate matter. The hospital admission data were obtained from the Chiang Mai Provincial Public Health Office. The data are available at the website: https://www.moph.go.th (accessed on 15 November 2022). The hospitalization of one admitted patient was counted as one case, and return patients were also similarly counted. All-cause morbidity by exposure to particulate matter used for the analysis in this study was classified by the International Statistical Classification of Diseases (ICD-10) to include acute pharyngitis, acute ischemic heart disease (AIHD), asthma, bronchitis, cerebrovascular disease (stroke), COPD, chronic rhinitis, conjunctivitis, dermatitis, influenza, pneumonia, and lung cancer.
The temperature data were collected from the Ministry of Energy of Thailand’s report, which is published on their website. The rainfall data were collected from the Thai Meteorological Department. The data utilized in this study and relevant sources are summarized in Table 1.
2.2. Estimation of Population Exposure
A recent study has considered the distribution of PM2.5 concentration and the morbidity of each disease in individual sub-city areas such as a district. There are 105 ground-based stations across the 25 districts in Chiang Mai. The spatial values in each district area are calculated using the mean weighted by population. The population-weighted mean denoted by can be calculated by Equation (1) [9].
where P0 is the overall population in the domain area (unit: case), Pi is the population in the i th sub-area, where i denotes each sub-area in the domain area, Ci is the ambient particulate matter concentration (unit: µg/m3) in i th sub-area, and n is the overall number of sub-areas in the focus area.
2.3. Estimation of Correlation Coefficient
The relation between PM2.5 concentration and the variety of diseases was estimated by Pearson’s correlation coefficient. The correlation coefficient value, represented by R, measures the correlation between two variables, can be calculated by Equation (2) [9], and provides the R-value between −1 and 1. A positive correlation coefficient value indicates that as one variable increases, the other one does the same, and an R-value closer to 1 means a greater correlation. A negative correlation coefficient value indicates that two variables are related but in an opposite trend, and R-value closer to −1 means a strong correlation in negative way. A value equal to zero means there is no correlation between the two variables.
where, xi and yi are the values of the variables x and y at the i th location. The means of variables x and y are represented as and , and n is the total number of locations.
3. Results and discussion
3.1. Spatial Distribution of PM2.5 Concentration
The monthly average distribution of the PM2.5 concentration across Chiang Mai is shown in Figure 2. The spatial analysis presents the variation of PM2.5 pollution levels in each district; the red color in the map indicates the highest concentration of PM2.5, followed by orange, yellow, light green, and dark green, respectively.
The haze pollution time in 2021 started in January with a monthly average PM2.5 concentration across the Chiang Mai province of 44.97 µg/m3. The PM2.5 concentration ranged between 18.30 µg/m3 and 71.86 µg/m3. The spatial distribution of PM2.5 concentration in January is displayed in Figure 2a. It shows that the highest polluted areas were the San Kamphaeng and Samoeng districts. In February, the monthly average PM2.5 concentration level increased to 61.23 µg/m3. The highest polluted areas were the Fang, Chiang Dao, and San Kamphaeng districts, with an average PM2.5 concentration of 98.33 µg/m3, 94.70 µg/m3, and 86.42 µg/m3, respectively. The lowest polluted area was the Hot district, with 21.53 µg/m3. The PM2.5 spatial distribution of February is displayed in Figure 2b. March was the highest haze smog period in Chiang Mai, for which the monthly average PM2.5 concentration increased from February, reaching 98.56 µg/m3 (Figure 2c). The highest PM2.5 concentration was 187.6 µg/m3 in the Chiang Dao district, followed by the Chai Prakan district with 167.87 µg/m3, and the Phrao district with 158.86 µg/m3. The lowest pollution areas were the Hot and Doi Tao districts, with 37.88 µg/m3 and 46.52 µg/m3, respectively, PM2.5 concentrations. Even the lowest level in March is far above the recommended new WHO air quality guidelines in 2021 (The WHO’s recommended long- and short-term AQG for PM2.5 are 15 µg/m3 and 5 µg/m3 on a daily and annual basis, respectively) and at a dangerous level to humans.
The PM2.5 pollution decreased in April, but the monthly average PM2.5 concentration remained at serious pollution levels. In April (Figure 2d), the monthly average PM2.5 concentration was 42.69 µg/m3, and the PM2.5 level ranged from 14.16 µg/m3 to 92.73 µg/m3. The highest polluted areas were the Mae Taeng, Chiang Dao, and Fang districts, with a monthly average PM2.5 concentration of 92.73, 74.9, and 72.27 µg/m3, respectively. The lowest polluted areas were the Doi Tao, Hot, Doi Lo, and Saraphi districts, with a monthly average PM2.5 concentration of 14.16, 18.58, 21.17, and 22.08 µg/m3, respectively.
In terms of the spatial distribution of the pollution map, the highest level of PM2.5 pollution occurred in similar areas between January and April in the north of the Chiang Mai province, and the concentration decreased from the north to south areas. Based on the spatial maps, the most PM2.5-polluted district was Chiang Dao; this is consistent with the study of Supasri et al. [10], who also observed that Chiang Dao is a pollution hotspot, having the highest PM2.5 concentration as a result of open burning from maize cultivation during February and March. Moreover, the monthly average PM2.5 concentration from January to March was much higher than the WHO-recommended long- and short-term air quality guideline (15 µg/m3 in daily and 5 µg/m3 in annual) in all areas, indicating that everyone in Chiang Mai lived with bad air quality hazardous to human health. While the air quality was better in April, only 4.2 percent of the population lived in acceptable air conditions as per the WHO guideline.
3.2. Health Impact Due to PM2.5 Exposure
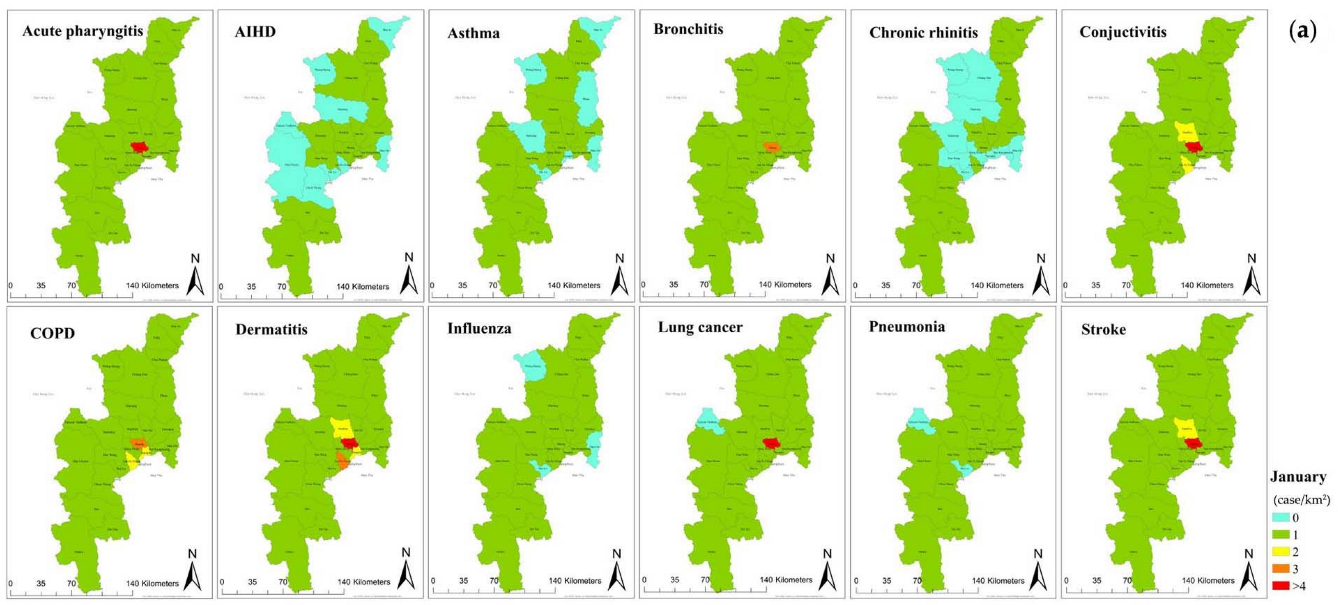
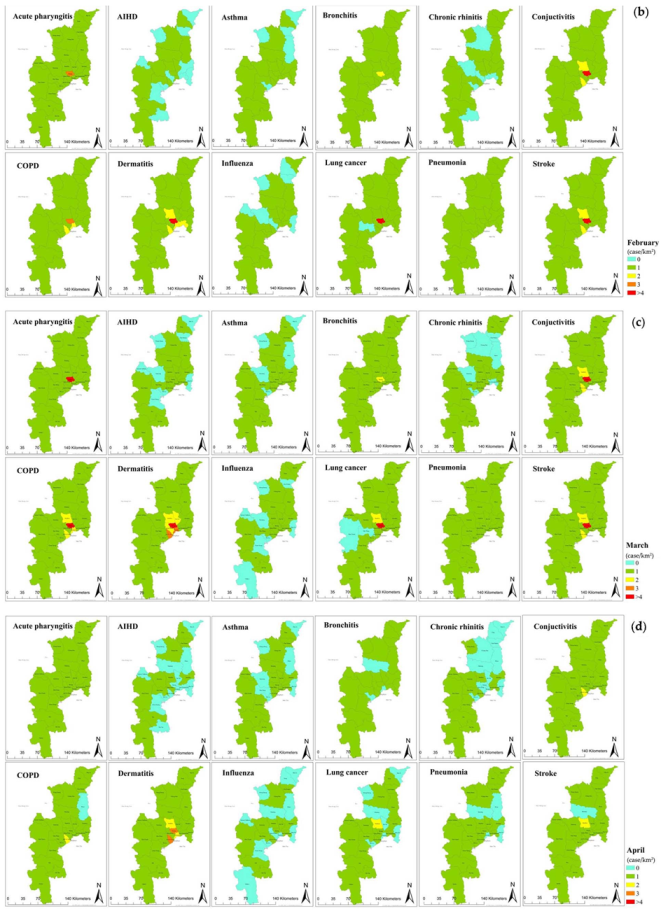
The distribution of health impact caused by exposure to fine particulate matter from January to April in the Chiang Mai area is shown in Figure 3 as spatial health risk maps. The health risk maps reveal the hospital admissions related to 12 diseases due to exposure to PM2.5, categorized by the ICD-10, including acute pharyngitis, acute ischemic heart disease (AIHD), asthma, bronchitis, cerebrovascular disease (stroke), chronic obstructive pulmonary disease (COPD), chronic rhinitis, conjunctivitis, dermatitis, influenza, pneumonia, and lung cancer. The colors on the maps differentiate the hazard level of the PM2.5 impact on population health. The most affected areas with over four cases per square kilometer admitted to the hospital are displayed in red color, followed by lower risk areas indicated by orange, yellow, green, and the least affected, blue, which means no hospitalization. The case per area of the health risk map would be an insight into the information guide for local public health organizations to manage and prepare the resources to respond to the patient demand, which is expected to increase rapidly in the peak period of haze; for example, the patient beds, medicines, and physicians.
In January, the total number of hospital admissions caused by PM2.5 in Chiang Mai was 26,495 patients; the highest risk area had 5877 hospitalizations, with approximately 38 hospitalizations per square kilometer in the Mueang district. Figure 3a shows the spatial distribution of all incidence diseases due to PM2.5 exposure in January; the all-cause hospital admission rate was high in the center of Chiang Mai. Most people admitted to the hospital in this month were admitted due to acute pharyngitis, bronchitis, conjunctivitis, COPD, dermatitis, and cerebrovascular disease. In addition, the map shows that no hospitalization was caused by AIHD or chronic rhinitis disease in the northeast and suburban areas of the province. Regarding the number of hospitalizations for each disease, the Mueang district had the highest number in January, with 11 hospitalizations per square kilometer due to dermatitis, followed by conjunctivitis and cerebrovascular disease, with 8 and 7 hospitalizations per square kilometer, respectively.
In February, the total hospital admissions in all-causes morbidity were 23,485 patients; the Mueang district was the highest risk area with 5210 patients and approximately 35 hospitalizations per square kilometer. Furthermore, the numbers of some disease cases, such as asthma, dermatitis, pneumonia, and cerebrovascular disease, were increasing in February. The spatial distribution of health risk in Figure 3b shows that the highest risk is still clustered in the center and spreading to the suburban areas. In addition, the hospitalization for each disease was high in the case of dermatitis, conjunctivitis, and cerebrovascular diseases in the Mueang district, with 10, 6, and 7 hospitalizations per square kilometer, respectively.
In March, the spatial maps displayed decreasing blue areas and colors changing into higher levels in some districts (Figure 3c), which means that the number of all-cause incident hospitalizations was more elevated than in January and February. The total hospital admissions in Chiang Mai reached 30,581 patients. The Mueang district was ranked the highest risk area, with 6600 people admitted to the hospital or about 44 hospitalizations per square kilometer. In view of each disease, the highest hospitalization rate was due to the same diseases as in January and February, and still high in the Mueang district. Nevertheless, the number was raised to 13 hospitalizations per square kilometer due to dermatitis diseases, nine hospitalizations per square kilometer due to cerebrovascular diseases, and eight hospitalizations per square kilometer due to conjunctivitis diseases.
In contrast, the blue areas increased in April, and there was no red spot on the spatial risk map, implying a decrease in human health impact. The overall hospitalizations were down to 16,241 patients, and the highest impact area was the San Pa Thong district, with 2694 hospitalizations and only eight hospitalizations per square kilometer. While the overall hospitalization decreased, with the hospital admission rate dropping to three patients per square kilometer, the disease cases for dermatitis were still high in the center of Chiang Mai, especially in the Mueang district.
The highest health impact areas show similarities across the January to April period and were highest in the center of Chiang Mai, especially in the Mueang and San Pa Tong districts; moreover, the incidence of health impact decreased from the center to the suburban districts. In addition, the overall spatial health risk maps revealed that exposure to PM2.5 causes high incidence disease rates of conjunctivitis, COPD, dermatitis, and cerebrovascular disease but a low hospitalization rate in cases of AIHD, asthma, chronic rhinitis, and influenza. Moreover, the high number of cases of morbidity related to bronchitis existed only in the Mueang district. However, there were exceptional cases, including areas with a high monthly average PM2.5 concentration but lower population density, such as suburban districts located in the high mountains, which had lower population exposure to PM2.5 pollution and, thus, a lower incident morbidity rate. These cases were consistent with Shen and Yao’s [9] study in China that showed a lower population exposure to PM2.5 in the high pollution areas, such as industrial parks with fewer employees.
3.3. The Spatial Area of All-Cause Morbidity from PM2.5 Exposure
The spatial area of all-cause morbidity due to PM2.5 in Chiang Mai is shown in Figure 4. The different color areas on the maps illustrate the PM2.5 concentration and its impact on human health, as indicated by the Thailand Pollution Control Department (PCD). The blue spatial area indicates clean air quality and no risk to health, with a PM2.5 concentration between 0–25 µg/m3, followed by the green spatial area with a PM2.5 concentration of 26–37 µg/m3. This air quality level is considered satisfactory, posing little or no risk to health; however, sensitive groups should be careful. The yellow spatial area indicates acceptable air quality (38–50 µg/m3). This level of PM2.5 may lead to negative health effects in sensitive groups. The orange spatial area shows a PM2.5 concentration between 51–90 µg/m3, indicating an air quality level considered dangerous to the health of the general public. The spatial area with a PM2.5 concentration over 90 µg/m3 is illustrated in red color. It is considered a dangerous air quality level with severe health effects for the general public.
Figure 4 shows that the number of hospitalizations caused by exposure to PM2.5 was high in the central areas of Chiang Mai, as noticed from the heights of the stacked bar charts. Although the average PM2.5 concentration in Chiang Mai between January and April was different, the number of hospitalizations due to exposure to PM2.5 was still higher in the central areas than in border areas. Furthermore, March demonstrates a severe level of PM2.5 concentration that highly affects human health in all diseases, as shown by the yellow, orange, and red colors around Chiang Mai. The total number of hospital admissions due to exposure to PM2.5 was also the highest in March compared to January, February, and April.
Moreover, the number of hospitalizations in all-cause diseases is presented as stacked bar charts. From January to April, the Mueang district had the highest number of hospital admissions caused by exposure to PM2.5 compared with other districts, as shown in the stacked bar chart in Figure 4. The major causes of hospital admission were dermatitis, stroke, conjunctivitis, COPD, and acute pharyngitis, as seen in the stack length on the maps. In addition, hospitalization caused by lung cancer was most prevalent in the Mueang, Mae Rim, and San Pa Thong districts, as illustrated by the dark green portion of the stacked bar chart.
3.4. Correlation Coefficient between PM2.5 Concentration and Health Impact
The correlation between PM2.5 concentration and hospital admission caused by PM2.5 is presented in Figure 5. The correlation coefficient (denoted by R) showed a positive value in all disease cases, indicating that the increase in PM2.5 concentration is positively correlated with the increase in the incidence of diseases.
Table 2 shows the association of PM2.5 concentration, rainfall, temperature, population, and hospital admissions due to PM2.5 exposure. As can be anticipated, the correlation coefficient between PM2.5 concentration and rainfall was negative (R = −0.57), indicating that PM2.5 concentration decreased when there was an episode of rain due to the washout of PM2.5 by the rainfall. This was consistent with the observation of Fold et al. [18]. On the contrary, the correlation coefficient between the population and the population exposure to PM2.5 was 0.51, which means the population and the population exposure to PM2.5, as the number of hospital admissions was related; this signifies a high number of hospitalizations in the area with a large population. For example, the Mueang district has a high population density and high population exposure to PM2.5. Vice versa, areas with low population density, such as the mountain or parks, also have fewer hospital admissions, even in polluted areas. Furthermore, the PM2.5 concentration was highly associated with population exposure to PM2.5 with a correlation value was 0.74, indicating the increase of PM2.5 concentration contributing to the rise of the population exposure to PM2.5, which was derived from the hospital admission data in all-cause morbidity. In addition, the correlation between temperature and PM2.5 concentration was associated with a positive value equal to 0.49. This assured that the temperature level was associated with the PM2.5 concentration.
4. Conclusions
Chiang Mai experienced a high PM2.5 concentration exceeding the air quality standard (15 µg/m3 and 5 µg/m3 are the WHO recommended values for daily and annual bases updated in 2021) from January to April, with the highest average PM2.5 concentration level in March. PM2.5 was highest in the north of Chiang Mai, including the San Kamphaeng, Fang, and Chiang Dao districts. The PM2.5 concentration decreased from the north to the south, and the lowest polluted area was the Hot district. This study demonstrated that exposure to PM2.5 is associated with human health in all-cause morbidity following the ICD-10. The human health effects attributable to exposure to PM2.5 pollution were presented in a spatial pattern as health risk maps highlighted the different levels of health impact for each district in the Chiang Mai province.
As shown by the spatial health risk maps, the population in the center of Chiang Mai, especially in the Mueang District, was highly affected by exposure to PM2.5 though there were lower health impacts in the suburban districts. Moreover, most hospital admissions related PM2.5 in Chiang Mai were due to dermatitis, conjunctivitis, cerebrovascular disease (stroke), and chronic obstructive pulmonary disease (COPD). Notably, dermatitis was the first-ranked disease for hospital admissions from January to April, with the number of hospitalizations per square kilometer equal to 11, 10, 13, and 3, respectively. The number of cases of dermatitis was higher than other diseases because dermatitis symptoms usually occur within a few hours after exposure to an irritant such as PM2.5, and the symptoms, such as inflammation of the eyes and skin, are easily noticeable.
The findings of this study show the effects of PM2.5 and distinguish the high health risk areas of each morbidity. It suggests priority areas to the policymakers to make suitable environmental regulations for the province. In addition, it provides decision information for the provincial control department, for example, in planning to locate dust-free rooms in areas that have high risk from PM2.5 to avoid increasing the number of population exposure and hospitalizations due to exposure to PM2.5. Therefore, the management of this data could be significant for preparing and handling the rapid increase in adverse health effects and associated problems, such as inadequate numbers of beds or insufficient hospital services, including medicine and medical equipment. As seen from the results, when the PM2.5 increased, the highest number of cases was of dermatitis; this information can guide the local public health department to organize the expert staff and medicines for satisfactory treatment service in each area. Additionally, the results support better decision-making for future economic planning of each area, including the prevention and reduction of costs associated with PM2.5, such as surgical masks and air purifiers, treatment costs due to diseases, and hospital service costs. The data collection are limited to a short period because the hospital admission data due to PM2.5 were only available in 2021. The impact of age and gender are not considered in this study but will be analyzed in the future. Furthermore, the economic impact will be examined in more detail and proposed in the spatial distribution pattern.
Author Contributions
Conceptualization, K.J. and S.S.; methodology, K.J.; software, K.J.; validation, K.J., S.H.G. and S.S.; formal analysis, K.J.; investigation, K.J., S.H.G. and S.S.; resources, K.J.; data curation, K.J.; writing—original draft preparation, K.J.; writing—review and editing, S.H.G.; visualization, K.J.; supervision, S.S.; project administration, K.J.; funding acquisition, S.S. All authors have read and agreed to the published version of the manuscript.
Funding
This research received no external funding.
Institutional Review Board Statement
Not applicable.
Informed Consent Statement
Not applicable.
Data Availability Statement
The data presented in this study are available on request from the corresponding author.
Acknowledgments
The authors would like to thank the Graduate School, Chiang Mai University, and Department of Industrial Engineering, Faculty of Engineering, Chiang Mai University, and the Research Unit for Energy Economic & Ecological Management, Science and Technology Research Institute, Chiang Mai University for providing a platform to accomplish this study.
Conflicts of Interest
The authors declare no conflict of interest.
References
- Yu, G.; Wang, F.; Hu, J.; Liao, Y.; Liu, X. Value Assessment of Health Losses Caused by PM2.5 in Changsha City, China. Int. J. Environ. Res. Public Health 2019, 16, 2063. [Google Scholar] [CrossRef] [PubMed] [Green Version]
- Mueller, W.; Loh, M.; Vardoulakis, S.; Johnston, H.J.; Steinle, S.; Precha, N.; Kliengchuay, W.; Tantrakarnapa, K.; Cherrie, J.W. Ambient particulate matter and biomass burning: An ecological time series study of respiratory and cardiovascular hospital visits in northern Thailand. Environ. Health 2020, 19, 77. [Google Scholar] [CrossRef] [PubMed]
- Xiang, J.; Seto, E.; Mo, J.; Jim Zhang, J.; Zhang, Y. Impacts of implementing Healthy Building guidelines for daily PM2.5 limit on premature deaths and economic losses in urban China: A population-based modeling study. Environ. Int. 2021, 147, 106342. [Google Scholar] [CrossRef] [PubMed]
- Stowell, J.D.; Geng, G.; Saikawa, E.; Chang, H.H.; Fu, J.; Yang, C.E.; Zhu, Q.; Liu, Y.; Strickland, M.J. Associations of wildfire smoke PM2.5 exposure with cardiorespiratory events in Colorado 2011–2014. Environ. Int. 2019, 133, 105151. [Google Scholar] [CrossRef] [PubMed]
- Squizzato, S.; Masiol, M.; Rich, D.Q.; Hopke, P.K. A long-term source apportionment of PM2.5 in New York State during 2005–2016. Atmos. Environ. 2018, 192, 35–47. [Google Scholar] [CrossRef]
- Zhu, G.; Hu, W.; Liu, Y.; Cao, J.; Ma, Z.; Deng, Y.; Sabel, C.E.; Wang, H. Health burdens of ambient PM2.5 pollution across Chinese cities during 2006–2015. J. Environ. Manag. 2019, 243, 250–256. [Google Scholar] [CrossRef]
- Wimolwattanapun, W.; Hopke, P.K.; Pongkiatkul, P. Source apportionment and potential source locations of PM2.5 and PM2.5–10 at residential sites in metropolitan Bangkok. Atmos. Pollut. Res. 2011, 2, 172–181. [Google Scholar] [CrossRef] [Green Version]
- Sereenonchai, S.; Arunrat, N.; Kamnoonwatana, D. Risk Perception on Haze Pollution and Willingness to Pay for Self-Protection and Haze Management in Chiang Mai Province, Northern Thailand. Atmosphere 2020, 11, 600. [Google Scholar] [CrossRef]
- Shen, Y.; Yao, L. PM2.5, Population Exposure and Economic Effects in Urban Agglomerations of China Using Ground-Based Monitoring Data. Int. J. Environ. Res. Public Health 2017, 14, 716. [Google Scholar] [CrossRef] [Green Version]
- Supasri, T.; Itsubo, N.; Gheewala, S.H.; Sampattagul, S. Life cycle assessment of maize cultivation and biomass utilization in northern Thailand. Sci. Rep. 2020, 10, 3516. [Google Scholar] [CrossRef] [Green Version]
- Zhang, P.; Yu, M.; Tian, Y.; Yang, Y.; Shi, M.; Li, W. Spatial-temporal Change of PM2.5 in Z City and Influencing Factors Analysis. Chem. Eng. Trans. 2018, 66, 547–552. [Google Scholar] [CrossRef]
- Hassan, A.; Ilyas, S.Z.; Agathopoulos, S.; Hussain, S.M.; Jalil, A.; Ahmed, S.; Baqir, Y. Evaluation of adverse effects of particulate matter on human life. Heliyon 2021, 7, e05968. [Google Scholar] [CrossRef] [PubMed]
- Pozzer, A.; Bacer, S.; Sappadina, S.D.Z.; Predicatori, F.; Caleffi, A. Long-term concentrations of fine particulate matter and impact on human health in Verona, Italy. Atmos. Pollut. Res. 2019, 10, 731–738. [Google Scholar] [CrossRef]
- Kihal-Talantikite, W.; Legendre, P.; Le Nouveau, P.; Deguen, S. Premature Adult Death and Equity Impact of a Reduction of NO2, PM10, and PM2.5 Levels in Paris-A Health Impact Assessment Study Conducted at the Census Block Level. Int. J. Environ. Res. Public Health 2018, 16, 38. [Google Scholar] [CrossRef] [Green Version]
- Song, C.; He, J.; Wu, L.; Jin, T.; Chen, X.; Li, R.; Ren, P.; Zhang, L.; Mao, H. Health burden attributable to ambient PM2.5 in China. Environ. Pollut. 2017, 223, 575–586. [Google Scholar] [CrossRef]
- Balakrishnan, K.; Dey, S.; Gupta, T.; Dhaliwal, R.S.; Brauer, M.; Cohen, A.J.; Stanaway, J.D.; Beig, G.; Joshi, T.K.; Aggarwal, A.N.; et al. The impact of air pollution on deaths, disease burden, and life expectancy across the states of India: The Global Burden of Disease Study 2017. Lancet Planet. Health 2019, 3, e26–e39. [Google Scholar] [CrossRef] [Green Version]
- Janssen, N.A.; Fischer, P.; Marra, M.; Ameling, C.; Cassee, F.R. Short-term effects of PM2.5, PM10 and PM2.5–10 on daily mortality in The Netherlands. Sci. Total Environ. 2013, 463–464, 20–26. [Google Scholar] [CrossRef] [Green Version]
- Fold, N.R.; Allison, M.R.; Wood, B.C.; Thao, P.T.B.; Bonnet, S.; Garivait, S.; Kamens, R.; Pengjan, S. An Assessment of Annual Mortality Attributable to Ambient PM2.5 in Bangkok, Thailand. Int. J. Environ. Res. Public Health 2020, 17, 7298. [Google Scholar] [CrossRef] [PubMed]
- Pothirat, C.; Chaiwong, W.; Liwsrisakun, C.; Bumroongkit, C.; Deesomchok, A.; Theerakittikul, T.; Limsukon, A.; Tajarernmuang, P.; Phetsuk, N. The short-term associations of particular matters on non-accidental mortality and causes of death in Chiang Mai, Thailand: A time series analysis study between 2016–2018. Int. J. Environ. Health Res. 2021, 31, 538–547. [Google Scholar] [CrossRef]
- Chavanaves, S.; Fantke, P.; Limpaseni, W.; Attavanich, W.; Panyametheekul, S.; Gheewala, S.H.; Prapaspongsa, T. Health impacts and costs of fine particulate matter formation from road transport in Bangkok Metropolitan Region. Atmos. Pollut. Res. 2021, 12, 101191. [Google Scholar] [CrossRef]
- Mueller, W.; Vardoulakis, S.; Steinle, S.; Loh, M.; Johnston, H.J.; Precha, N.; Kliengchuay, W.; Sahanavin, N.; Nakhapakorn, K.; Sillaparassamee, R.; et al. A health impact assessment of long-term exposure to particulate air pollution in Thailand. Environ. Res. Lett. 2021, 16, 055018. [Google Scholar] [CrossRef]
- Johnston, H.J.; Mueller, W.; Steinle, S.; Vardoulakis, S.; Tantrakarnapa, K.; Loh, M.; Cherrie, J.W. How Harmful Is Particulate Matter Emitted from Biomass Burning? A Thailand Perspective. Curr. Pollut. Rep. 2019, 5, 353–377. [Google Scholar] [CrossRef] [Green Version]
- Ruchiraset, A.; Tantrakarnapa, K. Time series modeling of pneumonia admissions and its association with air pollution and climate variables in Chiang Mai Province, Thailand. Environ. Sci. Pollut. Res. Int. 2018, 25, 33277–33285. [Google Scholar] [CrossRef] [PubMed] [Green Version]
- Zhao, R.; Zhan, L.; Yao, M.; Yang, L. A geographically weighted regression model augmented by Geodetector analysis and principal component analysis for the spatial distribution of PM2.5. Sustain. Cities Soc. 2020, 56, 102106. [Google Scholar] [CrossRef]
- Lung, S.C.; Thi Hien, T.; Cambaliza, M.O.L.; Hlaing, O.M.T.; Oanh, N.T.K.; Latif, M.T.; Lestari, P.; Salam, A.; Lee, S.Y.; Wang, W.V.; et al. Research Priorities of Applying Low-Cost PM2.5 Sensors in Southeast Asian Countries. Int. J. Environ. Res. Public Health 2022, 19, 1522. [Google Scholar] [CrossRef]
Figure 1.
A geographic of the Chiang Mai province of northern Thailand.

Figure 2.
The spatial distribution of PM2.5 across Chiang Mai during January-April 2021 (a) January, (b) February, (c) March, and (d) April.
Figure 2.
The spatial distribution of PM2.5 across Chiang Mai during January-April 2021 (a) January, (b) February, (c) March, and (d) April.

Figure 3.
The spatial distribution of health risk map in all-cause morbidity in Chiang Mai from January to April 2021 (a) in January, (b) in February, (c) in March, and (d) in April.
Figure 3.
The spatial distribution of health risk map in all-cause morbidity in Chiang Mai from January to April 2021 (a) in January, (b) in February, (c) in March, and (d) in April.


Figure 4.
The distribution of PM2.5 and its health impact in Chiang Mai from January to April 2021 (a) in January, (b) in February, (c) in March, and (d) in April.
Figure 4.
The distribution of PM2.5 and its health impact in Chiang Mai from January to April 2021 (a) in January, (b) in February, (c) in March, and (d) in April.

Figure 5.
Correlation of PM2.5 concentration and hospital admissions due to PM2.5 in each morbidity.
Figure 5.
Correlation of PM2.5 concentration and hospital admissions due to PM2.5 in each morbidity.


Table 1.
Details of data and sources.
| Data Collection | Data Source | Unit | Location | Frequency |
|---|---|---|---|---|
| Population | Provincial Administration of Thailand (Online data: https://www.dopa.go.th, accessed on 30 May 2021) | person | Chiang Mai | Annual |
| Particulate matter (PM2.5 concentration) | Ground-based monitoring; DustBoy (Online data: https://www.cmuccdc.org, accessed on 30 May 2021) | µg/m3 | 105 stations in Chiang Mai | Daily |
| Hospital admission due to particulate matter | Chiang Mai Provincial Public Health (Online data: https://www.moph.go.th, accessed on 30 May 2021) | case | 25 districts | Monthly |
| Temperature | Ministry of Energy of Thailand (Online data: http://www.energy.go.th, accessed on 30 May 2021) | degree Celsius | Chiang Mai | Monthly |
| Rainfall Intensity | Thai Meteorological Department (Online data: https://www.tmd.go.th/, accessed on 30 May 2021) | 10−3 m | Chiang Mai | Monthly |
Table 2.
The correlation coefficient values.
| PM2.5 Concentration | Rainfall | Temperature | Population | |
|---|---|---|---|---|
| PM2.5 concentration | N/A | −0.57 | 0.49 | N/A |
| Population exposure to PM2.5 | 0.74 | N/A | N/A | 0.51 |
Disclaimer/Publisher’s Note: The statements, opinions and data contained in all publications are solely those of the individual author(s) and contributor(s) and not of MDPI and/or the editor(s). MDPI and/or the editor(s) disclaim responsibility for any injury to people or property resulting from any ideas, methods, instructions or products referred to in the content. |
© 2023 by the authors. Licensee MDPI, Basel, Switzerland. This article is an open access article distributed under the terms and conditions of the Creative Commons Attribution (CC BY) license (https://creativecommons.org/licenses/by/4.0/).
Share and Cite
MDPI and ACS Style
Jarernwong, K.; Gheewala, S.H.; Sampattagul, S. Health Impact Related to Ambient Particulate Matter Exposure as a Spatial Health Risk Map Case Study in Chiang Mai, Thailand. Atmosphere 2023, 14, 261. https://doi.org/10.3390/atmos14020261
AMA Style
Jarernwong K, Gheewala SH, Sampattagul S. Health Impact Related to Ambient Particulate Matter Exposure as a Spatial Health Risk Map Case Study in Chiang Mai, Thailand. Atmosphere. 2023; 14(2):261. https://doi.org/10.3390/atmos14020261
Chicago/Turabian StyleJarernwong, Kannika, Shabbir H. Gheewala, and Sate Sampattagul. 2023. "Health Impact Related to Ambient Particulate Matter Exposure as a Spatial Health Risk Map Case Study in Chiang Mai, Thailand" Atmosphere 14, no. 2: 261. https://doi.org/10.3390/atmos14020261
Note that from the first issue of 2016, this journal uses article numbers instead of page numbers. See further details here.