BIO_BOT 2.0

EMERGENT TECHNOLOGIES AND DESIGN

2021-2023
MARCH. DISSERTATION
COURSE DIRECTOR
Dr. Elif Erdine
STUDIO MASTER
Dr. Milad Showkatbakhsh
STUDIO TUTORS
Felipe Oeyen, Eleana Polychronaki, Lorenzo Santelli
Paris Nikitidis
SUBMISSION DATE
January 13th, 2023
SUBMISSION TITLE
BIO_BOT 2.0
TEAM
Anna Maria Oldakowski (MArch candidate)
Manya Singhal (MArch candidate)
DECLARATION
“I certify that this piece work is entirely my own and that any quotation or paraphrase from the published or unpublished work of others is duly acknowledged”
SIGNATURES
Anna Maria Oldakowski
Manya Singhal
DATE
January 13th, 2023
ACKNOWLEDGEMENTS
Our sincerest gratitude to Course Director Dr. Elif Erdine, Studio Master Dr. Milad Showkatbakhsh and Founding Director Dr. Michael Weinstock for your insightful and thought-provoking discussions; the tangential offshoots of which spun into equally, if not more intriquing metaphorical conversations- encompassing much more than just the subject at hand. To Paris Nikitidis for helping us envisage alternate possibility and to our studio tutors and colleagues, for your unwavering confidence in the ethos of this dissertation.
To Krzysztof and Arthur for teaching me the importance in lightness of being; to Joanna and Kika for your unhesitating belief which allowed me to think beyond.
Grateful to my allies in this process of becoming to my mom and dad.
A
M
ABSTRACT
“An increasingly homogeneous biosphere, with silent forests, empty seas, a world with less diversity of sound, layers, textures, living colours, and perceptible differences, could be the landscape of the future.”1
The fragmentation of the natural landscape, pollution caused by anthropogenic activity and overexploitation of resources have accelerated the degradation of precariously balanced ecosystems. Society is at the technosphere’s precipice, disassociating from the ecological plight in the biosphere. Catapulting towards energy crises, thermal dysregulation, historically high carbon emissions and species endangerment, the purpose of the project is to create a new green network as a mitigating solution that links existing green tissue and reconnects back to London’s Green Belt. This reinvigoration’s contribution to climate change resilience employs self-sustainable energy generation as architectural developments operating within the threshold of interstitial spaces to fortify underutilised spaces into augmented public spaces. Composed of spatially adaptive “biobot” modules or ecological machine hybrids, they can be implemented in different site contexts, thresholds and environmental scenarios; foretelling necessary participatory intervention in urban nodes of environmental deterioration. These architectural interventions focus on the thresholds between biofuel and energy production to tie back into existing power infrastructure, filtration of airborne pollutants alongside harvesting and purification of rain and grey water. Moreover, simultaneously cultivating and protecting flora connectivity for synanthropic species habitation. In this scenario, technology becomes the reparative system to define new psycho-ecological engagements between human participants, non-human species, local environmental conditions and their projections across temporal time frames. The real-time monitoring of data will allow for variability within the formal organisations of the eco-machines to become new adaptive ecologies rather than infill strategies in situ. The architectural feedback cycle within this intervention raises ethical responsibility in the manufacturing, production and participatory care-taking of the biobots throughout the time frame of their environmental arbitration and material life cycle.
6 7 DOMAIN CHAPTER DOMAIN CHAPTER BIO_BOT 2.0 BIO_BOT 2.0
INTRODUCTION
In the post Anthropocene era, as human awareness that their domination of the planet has led to destructive environmental distress, technology will play a fundamental reparative role in the coexistence with nature. “The environmental adage that technological solutions breed new technological problems has proven true. The converse can be true of ecological solutions. Thoughtful application of ecological design for problem solving can set in motion regeneration of soil, watersheds and local ecosystems that in turn help heal regional and global environments. It is easy to forget that everything is connected.”2
In the architectural field, while many proposals operate under the guise of implementing landscape strategies for the purpose of rewilding, they fail to acknowledge or consider the urban context. Therefore, the project positions itself as environmentally adaptive to its context; identifying needs for purification of the existing urban environment. The filtration of airborne pollution, collection and purification of rain, grey and storm water run-off, as well as the transplanting of green tissue in order to connect back previously fragmented landscape. In order to anticipate species interaction, a prioritisation is placed on integrating habitats for conservation within the green tissue. These key points emphasise the reestablishment of the first cyclical loop to rebalance the relationship between the current built environment and the degraded natural green space. The second cyclical loop is then introduced with a self-sustainable bio-fuel and energy production. The first mitigates degradation over time, while the second ensures thrival of continual growth, respectively.
In acknowledging the cyclical and temporal nature of a multi-level problem unaddressable through a single instalment, a crucial focus is place on feedback into the existing environment.
8 9 DOMAIN CHAPTER DOMAIN CHAPTER BIO_BOT 2.0 BIO_BOT 2.0
INTRODUCTION
One of the critical questions from the preliminary MSc phase was the possibility of stitching back patches of disassociated land in order to provide continuity for species- if a requirement for the proof of system effectivity is in harbouring ecological habitat, then it must be designed as such. What is the performative aspect of the bio-bot within the third space; as functional purification machines, how does it transform the spatial interaction of humans with them on a daily, weekly, monthly, or seasonal basis? And subsequently, if there is to be a corresponding functional performance outside of care-taking, can they satisfy modern needs while allowing natural growth to peacefully coexist?
In further developing the MArch phase of the project, there is a focus into the detailing of bio-materials which are designed for species mutualism but integrated into contemporary construction such that they can be easily maintained, fabricated to reduce existing carbon footprint and balance existing energy wastage. Kant’s ‘ought implies can’ principle becomes a jumping off point in setting up feedback energy generation for the bio-bots. If participants are imparted the real-time information on the severity of biosphere degradation, the appropriate strategies and kit-of-parts system in order to facilitate the rebalancing via powerhouses as the mitochondria of the city, or intervention point, should they not? If its not the users of society, there will certainly not be any species around to maintain our ecosystem; as biologist Gould punctuates, “We have become, by the power of a glorious evolutionary accident called intelligence, the stewards of life’s continuity on earth. We did not ask for this role, but we cannot abjure it. We may not be suited to it, but here we are.”4
10 11 DOMAIN CHAPTER DOMAIN CHAPTER BIO_BOT 2.0 BIO_BOT 2.0
•
•
•
•
•
•
DIFFERENTIAL GROWTH SIMULATION
ALGA_TERRA_BOT
EVOLUTIONARY OPTIMISATION
ALGA_TERRA_BOT DETAILS
ALGA_BOT | DETAILS
HYDRO_TERRA_BOT
EVOLUTIONARY OPTIMISATION
HYDRO_TERRA_BOT DETAILS
HYDRO_BOT DETAILS
OSMO_BOT
PARTICLE SIMULATION
OSMO_BOT | DETAILS
TERRA_BOT
TERRA_BOT | DETAILS
TERRA_BOT 2.0
TERRA_BOT 2.0 | DETAILS
BIO-BOT MATERIAL CALCULATIONS
FUNCTIONAL CATEGORISATION
CONCLUSION
• ROBOTIC EXTRUSION
• MOULDING
• URBAN PARTICIPATORY SCHEME
• SITE MAPPING PARAMETERS
• FUNCTIONAL DISTRIBUTION
• AREA QUANTIFICATION
• DLA NETWORK FORMULATION
• BIO_BOT DISTRIBUTION
• STRUCTURAL ANALYSIS
• ARCHITECTURAL RATIONALISATION
• MORPHOLOGICAL NETWORK DEVELOPNENT
• DLA MORPHOLOGY
• PRODUCTION POD_ZONE A
• PRODUCTION POD 2
• COLLECTION POD
• ZONE B_SITE MORPHOLOGY MAPPING
• DLA MORPHOLOGY
• FILTRATION FACADE_ZONE B
• DETAILING
• ARCHITECTURAL FACADE CONSTRAINTS
• REAL-TIME ENVIRONMENTAL ADAPTATION
• GREEN BELT
• SPECIES HABITATION PODS
• SPECIES HABITATION DETAILS
INTRODUCTION 7
DOMAIN 15
•
BELT
• GREEN
ECOLOGICAL DEGRADATION
URBAN REPURCUSSIONS
HEAT-ISLAND EFFECT
ENERGY CRISIS
•
PUBLIC AND INTERSTITIAL SPACES
SYNANTHROPES
A NEW GREEN NETWORK
MATERIAL EXPLORATION
SAW DUST
•
•
•
•
LIVING TISSUE DEVELOPMENT
ENVIRONMENTAL COMPUTATION
DIFFUSION LIMITED AGGREGATION
EVOLUTIONARY OPTIMISATION
DIFFERENTIAL GROWTH
FABRICATION METHODS
CONCLUSION
GLOBAL CONTEXT ANALYSIS
AREA OF INVESTIGATION • SOHO ANALYSIS • MATERIAL MAPPING • CFD 18 19 20 21 22 23 24 25 26 27 29 54 56 57 58 60 62 70 71 74 75 76 • GLOBAL SCALE - NETWORK • MATERIAL SCALE • LOCAL SCALE • ARCHITECTURAL SCALE • INFERENCES • RESEARCH QUESTIONS • DOMAIN CONCLUSION 34 36 38 40 43 44 45 • CASE STUDIES 33 • METHODOLOGY 51 67 • RESEARCH DEVELOPMENT
• MATERIAL RESEARCH • MORPHOLOGICAL DEVELOPMENT 81 107
MATERIAL INTRODUCTION
PRELIMINARY PHYSICAL EXPERIMENT
EXPERIMENTAL SCOPE
THREE POINT BENDING TEST
ROBOTIC EXTRUSION TEST
STRUCTURE
VECTOR ABSTRACTION • FLORA_BOT • EVOLUTIONARY OPTIMISATION • FLORA_BOT | DETAILS 82 85 86 92 99 112 113 115 116 118
MORPHOLOGICAL DEVELOPMENT CTND 124 131 132 134 136 139 140 142 144 147 148 150 153 154 156 157 158 161 163
MATERIAL IMPLEMENTATION 165
•
•
•
•
•
•
•
•
CONTENTS
•
•
•
•
•
•
•
•
•
166 173 182 184 187 190 191 197 198 201 203 205 221 237 247 255 260 273 276 279 283 286 288 290
GREEN NETWORK DEVELOPMENT 179 300 304 311
CONCLUSION
BIBLIOGRAPHY
APENDIX
•
•
•
•
14 15 DOMAIN CHAPTER DOMAIN CHAPTER BIO_BOT 2.0 BIO_BOT 2.0
DOMAIN
DOMAIN
“The fact that a cloud from a minor volcanic eruption in Iceland—a small disturbance in the complex mechanism of life on the Earth—can bring to a standstill the aerial traffic over an entire continent is a reminder of how, with all its power to transform nature, humankind remains just another species on the planet Earth.”5
The domain chapter outlines parallel issues and their compounding effects in order to demarcate the scope for intervention; ecological degradation which directly affects the most infinitesimal species of insects begins to build up momentum into the isolation of natural landscapes. And while far in distance from the heavily wooded and vegetated tissue, the climatic disbalance seeps atmospherically towards urban centers; curbing their ability to thermoregulate heat islands, temperature fluxes, human comfort,
It is only when humans begin to see disruption in daily life- oppressive heat, looming energy crisis bills, ominous barometric shifts, scavenging species encroachment into their rubbish bins, is the acknowledgement made that climate change is both inevitable and noticed too late. The tracking of these hierarchical and interconnected changes from London’s Metropolitan Green Belt tissue to public interstitial spaces as underutilised spaces to intervene energy-sustainable tissue development will define the new ethical methodology: bio-mechanic rewilding as architectural eco-pedagogy.
16 17 DOMAIN CHAPTER DOMAIN CHAPTER BIO_BOT 2.0 BIO_BOT 2.0
GREEN BELT

The Metropolitan Green Belt was devised as an urban planning strategy to manage the sprawl of urbanisation during the 19th century as a response to rampant health problems which were arising. These protected areas served as the “green lungs” for the city and additionally became protected areas from urban development.7 However, as of August, 2022 councils in Outer London have approved the development of 19,400 hectares of protected green land.8 Moreover, the number of proposed homes within London’s Green Belt has doubled in the last two years to more than 200,000. This infrastructural land take, urban sprawl and economic over development has led to the physical disintegration of continuous ecosystems, habitats and landscape-10 ultimately resulting in the compounding effect on the extinction of existing plants and living species. While today, “health issues are no longer the primary argument for preserving the Green Belt, rather, its benefits in promoting sustainable or environmentally friendly development are foregrounded (...)”11 there is still evidence to 9,400 premature deaths attributed to poor air quality annually in London12- statistics that could be remediated if there were stricter regulations surrounding diesel vehicles, exacerbated carbon emissions and pollution reduction, resulting in damaging effects on both ecological sustainability and biodiversity levels.
Greater London has lost 53 hectares of tree cover between 2001 and 202113 thus, magnifying fragmentation of landscape in the advent of urbanisation. This decline in spatial physical noise buffers, carbon emissions, reckless synthetic building material usage and overpopulation have increased the urban heat island phenomenon while mean annual city temperatures have increased 10 per cent. Measurable rising pollution levels of NO2 NOx and Particulate Matter foreground London’s Air Quality Index.14
Therefore, to address the repercussions of forestry depletion in the urban built environment, the design research outlines the reestablishment of a resilient green network. Emerging from the identified most affected regions in order to rebalance the relationship between the current built environment and nature. The project relinks back to the existing Green Belt while the new network proposed operates within the threshold of interstitial spaces: enhancing environmental conditions while revitalising underutilised spaces into new green public space. This becomes the introduction to Soho, Central London as a research case study for the project; a medium density, highly polluted area with little green spaces and many areas of underutilised interstitial spaces.
ECOLOGICAL DEGRADATION
As Homo sapiens expand in population and our resource footprint proliferates around the globe, most other species are being obliterated, diminishing the biodiversity on the planet and paving the way for a series of quiet extinction events. 16 This over consumption of resources has led to strains on the environment and the production cycles. The strategies induced for urban planning are driven by political and economic ambitions. While it has been observed that, “the natural world is not very homogeneous over space, as well, but consists of a mosaic of spatial elements with distinct biological, physical, and chemical characteristics that are linked by mechanisms of biological and physical transport, 17 it has self-organised and evolved with its own internal system. It is here that these expansive infrastructural road networks are haphazardly imposed over existing green networks and come to evolve into Haff’s technosphere. Encompassing all interactions with technology- social, political, institutional- from the agricultural to the communicative to infrastructural.18
The rapid growth of the synthetic built environment has led to reckless impurification and de-rooting of forests and ecosystems.The ecological balance, preexisted human activity, has been created as a consequence of metabolic feedback loops generated between ecosystems within ecosystems comprised of biological communities of interacting organisms and their physical exchanges of matter and energy to create unique equilibrium. Largely unnoticed and therefore of little consequence to humans due to its micro scale, “this balance of nature depends on the activities of parasites and predators, the majority of which are species of insects.19 However, when examined through the lens that around 80% of UK plants are pollinated by insects, including a large number of food crops,20 it frames the importance of a symbiotic exchange of energy between microbial organisms, minuscule insects and organic matter in a much more comprehensive way.21 Evolutionary biologist E.O. Wilson pointed, “If all mankind were to disappear, the world would regenerate back to the rich state of equilibrium that existed ten thousand years ago. If insects were to vanish, the environment would collapse into chaos.”22
18 19 DOMAIN CHAPTER DOMAIN CHAPTER BIO_BOT 2.0 BIO_BOT 2.0
Fig. 1. New houses on the site of an old orchard in Crediton, Devon. ‘Sometimes the green belt is picturesque, but often it is not … fields of nettles, or a wooded clearing full of discarded, stinking cans’
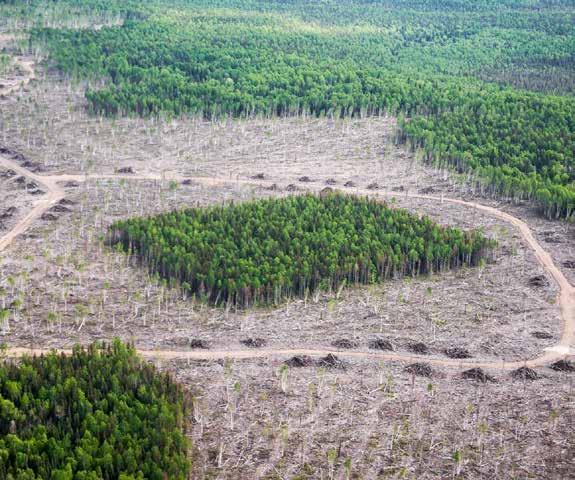
Fig. 2. In parts of Ontario’s southern boreal forest, companies have experimented with logging in a variety of special configurations to avoid clearcuts. The forest, which hosts a wide variety of birds and their insect prey, is threatened by fragmentation15
URBAN REPURCUSSIONS
The concept of “novel ecosystems” is defined by Richard Hobbs as “a system of abiotic, biotic, and social components, that, by virtue of human influence, differ from those that prevailed historically, having a tendency to self-organise and manifest novel qualities without intensive human management.”24 And while it is possible for these ecosystems to exist without drastic human intervention, they can only self-maintain in the right balance. Thus, as the imbalance between unbuilt and built environments grows, this fragmentation of natural landscapes echo repercussions to different levels of urban and natural development. Exacerbated by human activity, loss of biodiversity has led to drastic decreases in thermoregulation of the urban context and carbon capture. However, it is crucial to revive this continuous exchange of matter and energy facilitated through the spatial relationship between the built and unbuilt- as Jorgensen and Tylecote identify as ‘urban interstices.’


“Forest loss greatly decreased the amount of carbon-dioxide that is absorbed and contributed 20% to the total carbon-dioxide increase. Though 20% is a relatively small percentage, compared with that caused by industrial emissions, this carbon emission illustrates the fact that plants are vital in controlling the green-house effect because they are one of the most important parts of the earth that transfers carbon-dioxide into organisms. Forest loss creates a greater gap between the production and the absorption of carbon-dioxide.”25
Perhaps none more visually obvious than the accelerated loss in global green cover each year, these changes to landscape configuration disrupt ecosystem services, fragment habitat connectivity, and further hinder carbon sequestration previously provided by the flora.
Particulate solution
Urban Heat emissions
Isolated green patch


Infrastructural Built Up
Land with public access
Metropolitan Green Belt 1

Metropolitan Green Belt 2
HEAT ISLAND EFFECT
As fragmentation becomes a catalyst for more built land availability, cities replace natural land cover with dense concentrations of pavement, buildings and other surfaces that both absorb and retain heat at which the “urban heat islands” effect occurs. This effect increases energy consumption costs, air pollution levels and heat-related illness and mortality. The production cycles and instalment strategies of synthetic building materials become a large contributor to greenhouse gas emissions (GHG). “Global climate change is the impact which usually dominates analysis of the environmental impacts of urban metabolisms; it represents the total contribution of all GHG emissions weighted according to their Greenhouse Warming Potential (GWP) relative to carbon dioxide over some specified period following emission, conventionally 100 years.”30
However, there is a clear disparity between identifying amounts of carbon emissions of new construction and enabling a methodology which would directly reduce carbon production. This is the difference between designing ‘low carbon footprints’ and a reparative system that purifies the environment it is situated in. While climate change sceptics argue that the Milankovitch cycles,31 or orbital movements of the Earth, play a role in the long-term glacial periods and therefore the atmosphere is not warming as quickly as speculated, it is evident that urbanisation and selection of heat-trapping materials such as asphalt, the modern heat island effect and chemical pollutants in changes in land-use practices are rapidly deteriorating the environment.32 As of January 2023, the current atmospheric carbon dioxide measurement is 420 ppm (parts per million).33 For this reason, formulation and research of a material technology that can intervene through the interstices between the built and the unbuilt environment, has lower embodied energy, encourages qualities of filtration while inducing thermoregulation and adaptability to the existing ecosystems becomes extremely crucial.
20 21 DOMAIN CHAPTER DOMAIN CHAPTER BIO_BOT 2.0 BIO_BOT 2.0
Fig. 3. Landscape fragmentation: Mapping green cover 1940
Fig. 4. Landscape fragmentation: Mapping green cover 2000
Fig. 5. Landscape fragmentation: Mapping green cover 2016
Fig. 6. Landscape fragmentation: Mapping green cover 201823
Fig. 7. Fragmentation of the landscapes: 201826
Fig. 8. London Air Pollution 202027
Fig. 9. Urban Heat Island Mapping 202028
Fig. 10. Fragmentation of the landscapes; 202029
ENERGY CRISIS
heat fluctuations and overconsumption of grid resources has turned into an unprecedented energy crisis exacerbating the cost of living. In 2022, 4.5 million UK households were in fuel poverty which is now estimated to be 6.7 million by the Now National Energy Acton (NEA) and rising to 8.4 million in the upcoming months; needing immediate infrastructural intervention. Thus, the NEA have reconsidered policy options to providing additional support for low-income households in winter, social tariff to reflect low-income customers, debt repayment plans with energy suppliers and setting minimum energy efficiency standards for rented properties; this sector being under-maintained and a source of energy wastage. 35 It is clear that the energy shortage, well before the influence of international politics and pandemic economy that the price of gas and electricity has steadily been on the rise.
It is estimated that 85% of households use gas boilers to heat their homes, and around 40% of electricity is generated in gas fired power stations. Houses in the UK are poorly insulated compared to elsewhere on the continent. Recent analysis from the IMF showed that UK households have been the worst hit in Western Europe in terms of the impacts on spending power.36
For this reason, a self-generating and sustainable solution to collect and return energy back into the grid is a necessary intervention for the project. However, many types of renewables have their own production wastage associated with them or harmful to the environment in other ways. For example, standard solar panels, while commercially acceptable, contain cadmium and lead which seeps into the environment from landfills. Biofuel alternatives with fatty-acid esters require flushing of contaminants in order to be used; creating a 1:1 wastewater to finished biofuel gallon. And while the U.k. has eased off coal consumption since 1970, in 2018 it still consumed 12.9 million metric tonnes of which every tonne burned produces 4,172 carbon is released. Further more, the feedstock industry and 84% of U.K. homes still use natural gas to heat adding up to 33 gigatons of CO2 emissions.37
For all aforementioned reasons, green bio-fuels and other renewable fuels can aid in the decarbonisation scenario and the importance of the collection for reintroduction back into the existing power grid could offset the costs of prices; an important motivating factor for residents to participate in.
Costs of supplier failure
April price cap increase
Current price cap
Share of expenditure (winter 2021)

Share of expenditure (spring 2022)
PUBLIC AND INTERSTITIAL SPACE
‘Public space’ has traditionally been understood as ‘accessible’ space. However, the categorisation of spatial types falling within this domain have larger implications- frequently with varied levels of management and transparency. According to OMAI classification the “positive public spaces are Natural / semi-natural urban spaces, Civic spaces and Public open spaces.39 The traditional types of urban space, known as civic space, are accessible to anyone and can be used for a wide range of purposes.40 However, Civic spaces that are technically “open to all,” multipurpose and play an active part in society are no longer in existence. These spaces were replaced with commercial spaces, advertisements, anything that will encourage overconsumption. Is it possible to still refer to a place as “public” if the surrounding environment has been significantly disrupted and no longer provides a comfortable atmosphere for all human and non-human species groups? Or does it semantically in definition cease to be “public?” And what role do interstitial spaces play in facilitating the new exchange between public spaces separated by programmatic function?
At the smallest scale, Vidal (2002) uses the term ‘interstitial space’ to describe dynamic spaces delimited by physical elements such as buildings, walls and others.41

‘Urban interstices’ exist in cities as spaces for wildlife. So, woodlands, abandoned allotments, river corridors, brownfield sites and others emerge as proper sites for spontaneous growth of vegetation in contrast with those planned spaces with nature ‘under control’. They indicate that these spaces have significant contributions in facilitating direct contact of urban dwellers with wild nature at different scales, and open new possibilities for landscape planning and urban design.42
These ‘in between’ spaces from within the urban tissue need to play a fundamental role in the reciprocity of the natural landscape to continue its existence while the city, as an artefact, adapts within the preexisting landscape. Thus, designing for mutualism would mean recognising and foresting the links between environment, organisms, and land-use practices- both human and animal- and identifying the complex cycles that tie together different species and systems.43
22 23 DOMAIN CHAPTER DOMAIN CHAPTER BIO_BOT 2.0 BIO_BOT 2.0
Fig. 11. Current and forecast annual household expenditure and proportion of equivalised expenditure on energy bills by equivalised income decile34
Fig. 12. Interstitial space or residual space38
A NEW GREEN NETWORK SYNANTHROPES


“How do you caution a fawn about a cigarette a motorist has just flipped from his car window into a patch of yellow grass, or tell a sparrow that winged creatures eventually plummet to earth?”45 This point, epitomised by Burke, describes the human relationship with the environment. For as many people making sustainable choices, there will be just as many who decide it is someone else’s prerogative. Species have been forced to make series of adaptations to the urbanisation of the city. The most visual example of which is species encroachment in London; the spreading of wild foxes into the urban interstices. The nocturnal scavengers normally can live up to 15 years but in urban areas can survive for only three years.46 And in actuality, it is human expansion which encroaches on their habitable space.
The etymology of synanthropic was introduced by botanist von Heldreich to acknowledge the plants or species having adapted to places frequented by humans.47 Synanthropes as species between domestic and wild benefit from the proximity of urban space. “These animals have evolved to the patterns of transformation, consumption and production exhibited by human civilizations.” Furthermore, the ‘ecological vacuums’48 caused by urbanisation creates its own interstitiality for the species to establish, defined by Luniak synurbization, or the adjustment of wild animal populations to specific conditions of the urban environment. This can certainly facilitate cross-pollination in urban swathes, foraging changes and reframing defunct urban chunks as safe habitat; in the case of bees and insects and small mammals. But advancing construction and technology means that the synurbic species might have to readapt once more- certainly in the case of glass-skin facade bird collisions. Design for Biodiversity: A Technical Guide for New and Existing Buildings has been published in 2019 by the Royal Institute of British Architects (RIBA) to provide insight into how new construction can implement biodiversity in order to maintain synurbic thought into practice.49
The domain outlines substantive proof that the repercussions to ecological degradation facilitate disruptive implications in the exchange of metabolic cycles; non-deterministic from any notion of spatial distances understood by humans. This fragmentation seeps by way of atmosphere and climatic shifts to disrupt daily urban life. There is no single solution to stop it in its tracks, but must be considered as small interventions at each branch; from the roots upward to become reparative.
A network development with gradual ecological transitions from the Green Belt to the worst-case urban center scenario terminates (and begins cyclically) in the gaps of the urban fabric known as interstitial spaces. The transformations of the underutilised remnants of the interstitial, by Lovera’s definition where informal, unregulated, or unplanned situations take place, or as a descriptor of residual spaces left as a result of less controlled processes in planning51 becomes reconstituted in this scenario as the mitochondria energy powerhouses of the network branches being developed. Self-sustaining and emanating energy and regeneration back into the unbuilt environment. In this threshold from the built to the unbuilt environment, architecture facilitates the constructive role by which we can reconsider materials not as consumables, but as outputs of valuable and increasingly scarce ecological niches.52 Designers can reharmonize biodiversity with new ecological services of habitation, conservation and continuity and simultaneously abade damage and pollution caused by the anthropogenic treads. This can only be explored through the lens of a material development; a carbon and atmospheric deposit absorbing, species beneficial new green composite that will not obstruct urban development.
24 25 DOMAIN CHAPTER DOMAIN CHAPTER BIO_BOT 2.0 BIO_BOT 2.0
Fig. 14. Deep Green project by EcologicStudio; Green network development concept.50
Fig.13. Synanthropic species relationship with humans44
MATERIAL EXPLORATION
“Soft living architecture does not stop at the limits of synthesis but reconnects the realms of life and death in decomposition processes through soils. The composts that enable these linkages are not simple products; they are highly heterogeneous and metabolically active – being neither fully alive or inert. Such transformational fabrics are selectively permeable to environmental processes.”54
“While the period of the first industrial revolution, in the 18th and 19th century has resulted in a conversion from regenerative (agrarian) to non-regenerative material sources (mines), our time might experience the reverse: a shift towards cultivating, breeding, raising, farming, or growing future resources going hand in hand with a reorientation of biological production methods and goals.”55 The material development of bio-bot is catalysed by this investigation into the production of bio-receptive material. By Crus and Beckett’s definition, in order for a material to be bio-receptive it has to be biocompatible with particular types of species that will colonise it in a specific environment.56 If this is true, it is to be developed at three simultaneous scales.
At the first stage the material’s molecular behaviour inherently informs its physical growth process, setting up the framework for the computational simulation which informs the second stage, setting up the limitations for habitation. The formulation and research on the material composition to harbour natural growth of living species for microorganisms and their role in socio-thermo regulation informs the third stage which takes into consideration the mitigation of environmental impacts. By developing the material having taken into consideration the natural evolutionary processes required to control programmed life cycles, the sequestration of CO2, thermal regulation to combat heat island fluctuations and a re-growable material database become the environmental impact of the bio-bot. For this reason, sustainable building material development is a crucial parameter of this research in order to induce the growth of green living tissue, capture carbon and particulate matter from the atmosphere to filtrate the environment.
“The values of these life-giving materials exceed established conventions of design and invite a robust choreography between synthesis and dissipation, where the process of decay is recognized as an organisational system in which adaptation and even (re)embodiment becomes possible.”58 The timber industry has a highly established understanding of its own material’s life cycle as well as its by-products: saw dust being one such fibrous example that retains the material properties of its timber parent. Therefore, it becomes extremely crucial to utilise timber during its ultimate stage of use. Sawdust is produced as a “by-product or waste product of woodworking operations such as sawing, sanding, milling, planning and routing- composed of small chippings of wood. These operations both shatter lignified wood cells and break out whole cells and groups of cells. The more cell-shattering that occurs, the finer the dust particles that are produced.”59

The saw dust particles have dynamic hygroscopic behaviour due to their surface adsorption properties.60 When water film surrounds the saw dust particles, surface bonds are created between particles due to cohesive forces. However these bonds are not structural.61 Hence, it can be concluded that saw dust particles have a tendency to aggregate in clusters through the formation of surface bonds. Therefore, further research can be conducted to determine coupling materials that can induce stronger surface bonds amongst saw dust particles in order to develop a structural bio composite from timber sawdust. Furthermore, the phenomenon of surface activation of saw dust particles through pyrolysis was studied which resulted in increased surface area and porosity in sawdust composites, allowing the formation of surface bonds between saw dust particles and particulate matter in the air leading to decontamination of air. The methodology to generate adequate porosity can be explored based on varying the pyrolysis temperature. Pyrolysis is the process of decomposition of organic material under heat in the absence of oxygen into biochar.62

26 27 DOMAIN CHAPTER DOMAIN CHAPTER BIO_BOT 2.0 BIO_BOT 2.0
Fig. 16. Scanning electron microscopic (SEM) picture of a single disintegrated beech fibre57
Fig. 15. Newly developed bamboo composite material at the SEC/FCL Advanced Fibre Composite Laboratory53
SAW
DUST
DUST
Research has been conducted stating pyrolysis temperature has an influence on physicochemical properties of biochar synthesised from spruce wood (Picea abies) sawdust which results in varying porosity levels.64 Surface morphological features like porosity aid gas adsorption, growth of clusters of microorganisms, displaying excellent water retention capacity.65
Despite the relatively recent introduction of the term “biochar,” versatile applications of charred materials have been identified for further research due to their unique physicochemical properties such as high surface area, porosities, surface functional groups and absorption capacities.66 The carbon absorption due to slow pyrolysis and fast pyrolysis of sawdust particles with different gasing composites at different temperatures helps in achieving varied porosity as confirmed in experiments conducted by Zaira Z. Chowdhury.67 Porous composites from biochar have increased surface area that can capture particulate carbon- helping filtration of air. Fuertes identified that, ‘this type of carbonaceous material gives rise to an activated carbon that possesses textural properties that are appropriate for CO2 capture.’68
Therefore in order to take the research in this field further, the bonding behaviours in the hygroscopic and thermodynamic properties of sawdust particles at their molecular level can be extracted in order to create a new bio-material which has structural performativity, creates a scaffold for the growth of living tissue and can decompose at the end of its life cycle.

To understand the complex interactions between urban and natural processes it is crucial to identify behaviours at the microscale, the biological level of reproduction to anticipate their behaviours within larger natural scales in heavily polluted urban city centres. Holling identifies that designers face a larger problem- having to develop new systemic challenges of the petrochemical era - which are ubiquitous yet nearly invisible; nitrogen pollution, hypoxia, estrogenic compounds in our water system, carbon dioxide atmospheric pollution, and gradual sea level rise.”70 The presence of No2, No3, NoX, carbon and Particulate Matter (PM) create an opportunity to test if the implementation of living tissue, as Holling points out, can be utilised to create biofilters for PM which outperform those using non-bio, traditional filtering techniques at the urban scale- generating a Single pass removal efficiency (SPRE) in which PM was generated inside a Perspex chamber with active mechanical airflow to test polluted air dispersed across the green wall biofilter.71 This challenge of urbanisation with environmental awareness can actually be used to improve surrounding environmental qualities. One such example is Pleurocarpous moss; abundant and part of the flora vernacular of London.
Moss has been used as a bioindicator of pollution72 and air quality and has a high tolerance for growing on various substrates without maintenance and low water needs- making it suitable for development as a living tissue. Atmospheric element depositions of (H₂O), carbon dioxide (CO₂), nitrogen gas (N₂) are absorbed by moss, as are metal elements such as lead (Pb), magnesium (Mg), uranium (U) and sources that come from anthropogenic factor.73 Additionally, the sustainability performance of implementing moss into green construction systems have shown effective stormwater management, decrease of surface temperatures and mitigations to the urban heat island effect as opposed to vascular plants.74 While its growth rate varies across the propagation medium, growth substrate, and environmental conditions, it has been successfully implemented as a low-cost botanical biofilter in greening systems such as MosSkin75 to improve environmental conditions. Furthermore, conclusive evidence has been shown in Moss Voltaics76 that bio-photovoltaics (BPV) use the process of photosynthesis to generate electrical energy. As moss photosynthesises, it consumes atmospheric carbon which gets transformed into glucose when sitting atop a substrate of hydrogel. Within this, there is a plate of anode cathodes, conductive carbon fibers that crystalise the hydrogel during photosynthesis.

28 29 DOMAIN CHAPTER DOMAIN CHAPTER BIO_BOT 2.0 BIO_BOT 2.0
Fig. 17. The production of wood foam involves several process steps to specifically activate the internal bonding capacity, using existing technologies from the wood product and paper industry63
SAW
Fig. 18.. Moss attaching to the urban environment69
LIVING TISSUE DEVELOPMENT | MOSS | ALGAE
LIVING TISSUE DEVELOPMENT | MOSS | ALGAE LIVING TISSUE DEVELOPMENT | MOSS | ALGAE
While moss was the test vegetation, they have speculated that this system “can work with other species of plants and algae.” Moreover, the experiment is summarised in Fig. 19. Which equates the energy generated by per square metre of the moss voltaics system; a concise calculation which can be made within further development of the bio-bot proposal.

Plant structure, varying from rhizomatous to rooted, becomes significant not only to re-green degraded land areas within urban settings, but its secondary performance as a biofilter- the root structure which spreads along its substrate to create density to block particulate matter from entering completely. Furthermore, different species of plant roots can affect how much PM can pass through the substrate on which they are planted- rhizomatous species spread horizontally across a surface while rooted plants act as a filtration medium if given enough time to grow into a more ‘efficient system.’77
The identification of the root in behaving as bio-filtration allows for further categorisation of plant taxonomy of species which can serve the purpose of air purification in highly polluted areas as well as metal toxins and PM. Rhizomatous species can act as stabilising agents of a system by spreading laterally across mediums and substrates along the surface to immobilise the spread of sediment. While conducive to methods of atmospheric filtration, by incorporating rhizomatous species of plants which are unique to London and also conservationally endangered such as the Clinopodium Menthifolium, of which there is estimated to be only 10 km2 of in Great Britain78 the proposal is sensitive to the larger role it plays in propagating imperilled flora and fauna (further identified in plant taxonomy Figure 78.
The Intergovernmental Panel on Climate Change (IPCC) published a climate assessment report roughly estimating that planting one trillion healthy, mature trees in efforts of reforestation “could remove “twothirds of all the emissions from human activities that remain in the atmosphere today.” However, Cooley’s critical question still remains: where does one find land equivalent in size to the United States of America and Canada combined to plant them?79
One recent line of research into alternative space that has gained momentum is investigating algae as a source of carbon absorption to then be used as a biofuel. Algae bodies are capable of “producing an equal amount of bioenergy to terrestrial plants using only 1/10th of the land area,”81 and a one acre (4000m2) area of algae can capture up to 2.7 tons of carbon per day.82 Presently in London, direct air capture is used for the net removal of CO2 released into the environment from the transportation sector 83 in designated emission zones. It is therefore appropriate to consider how proximity within highly polluted zones could benefit from the CO2 removal that algal photosynthesis has been confirmed to absorb and transform into environmentally sustainable biofuels. Furthermore, if one scrutinises the spatial proportions of ‘one trillion trees’, then comparatively there is a parallel potential in researching how the increase of algal surface area in polluted areas can be used to maximise its exposure to sun; measuring volumetric containment rather than lateral area.

30 31 DOMAIN CHAPTER DOMAIN CHAPTER BIO_BOT 2.0 BIO_BOT 2.0
Fig. 19. Depicting calculation for production of bio-voltaic system application58 Fig. 20. Depicting calculation for production of bio-voltaic system application80
CASE STUDIES
32 33 CASE STUDIES CASE STUDIES BIO_BOT 2.0 BIO_BOT 2.0
Connecting
Green Network

Mitigating Climate Impact
Re -Metabolisation
Of Air Pollution
Filtration
Water Conservation
Recycling
DEEP GREEN| ECOLOGICSTUDIO
In order to analyse the thresholds between technology, architecture and building material sciences, case studies were conducted at three different scales of implementation: green network development, material research and cybernetic feedback within systems.
Reckless anthropogenic activities are causing an alarming threat to the environment disrupting the green resources leading to the dire need of regeneration of green network strategy. Hence, addressing the problem under this domain to cater to the depletion of urban resources, the Ecologic Studio based in London developed an algorithm through the project Deep Green.84 The formulation of this algorithm and its primary research parameters consisted of a series of workflows. Firstly, the urban regions subject to depletion of natural resources were listed and analysed, scans of their existing terrain, green networks, and road infrastructure were generated for investigation and repurposing. Once the topographical data was extracted, new green network layouts were generated on top of the investigated urban tissue. The newly generated green network layouts were derived from algorithms extracted from geometrical patterns existing in nature such as the Direct path system, Minimal path system, optimised further by contextual environmental simulations.
Trained Knowledge Base
Vegetation Biotic Layer

Ground Topography
Algorithmic Network Analysis

Network Output
Urban Waste Morphology
Water Flow Insolation Energy
Wind Flow
Rapid Urbanisation/ Volcanic Adversities


Urban Agricultural Plan
Direct Path System
Minimal Path System

Wind Flow
Lack Of Water Resources
Vegetative Network Around Water Collection
Rewilding the City Of Gautemala
Re-GreeningMogadashu
Vranje Renewable City Region
Dispersed Resources
Renewable energy production network
The developed technology was intended to be used as a method of sensitive urban planning in order to solve the problems of rewilding and strengthen the resource network for development of new towns in stressed environments.
The project ambition was based heavily on theoretical framework and research and lacked the identification of parameters for urban scale implementation. The developed algorithmic model did not consider the function and usage of the existing buildings and their interstitial spaces. The model also lacked identification of socio-cultural aspects influencing urban planning strategies. The team generated new network strategies for the cities of Mogadashu, Guatemala and Vranje computationally, through a set of graphical representations of solutions regardless of the building scale and with no evidence of its practical implementations. However, this case study can be utilised as a basis to analyse urban scale environmental parameters such as wind flow, solar radiation, biotic layering and urban waste structure in order to devise research parameters for the study of green network development.

34 35 CASE STUDIES CASE STUDIES BIO_BOT 2.0 BIO_BOT 2.0
Fig. 21. Diagrammatic indication of the workflow and techniques used in Deep Green project developed by EcologicStudio
Trap air
Manifolds/crevices Self Shading
MYCELIUM COLUMN | BLAST STUDIO


Synthetic building materials such as steel and concrete typically used in construction practices have high embodied energy and a comparatively higher carbon footprint. Extensive use of these materials contribute to the urban heat emissions and the non-biodegradability of these materials is hazardous to the environment. The project initiated by Blast Studio85 was studied in order to analyse the goal and workflow of development of biomaterial from a living tissue- mycelium in this case. Their experimentation also focused on developing a bio-material that could withstand structural loads simultaneously. The biomaterial was formulated into a resin-like mixture consisting of mycelium roots ground with paper pulp prepared for robotic arm extrusion leading to the creation of few successful prototypes. These morphologies were generated to have manifolds to create microclimate pockets to induce growth of new mushrooms which could be further used for human consumption. The mycelium morphology could be further baked to increase its structural strength as mentioned by Blast Studio.86
Trap
Structural morphology Load bearing
Food/mushroom growth
Human Consumption
Structural strength test
Height = 2.1 m
Pavillions/small houses
Baked at 80 C
Natural insulator
Fire retardant
Controlled mycelium growth rate
However certain limitations could be identified in the production of this building material. Firstly, mycelium needs controlled environments to be cultivated in bulk quantities. Secondly, its decay rate is highly subjective to instantaneous weather conditions, leading to unfavourable results. The produced physical prototype had been intended to be used as a structural member, although it lacked the abilities to take compressive loads.87 Also, its implementation at the urban scale had not been tested yet. It is important to note that development of biomaterials comes with their own risks of implementations, preservation and maintenance rules that are highly inflicted by humidity levels in the air. However, the intriguing exchange in the computational and physical medium in order to generate a physical prototype from a living material can be utilised as a methodology for further research.
36 37 CASE STUDIES CASE STUDIES BIO_BOT 2.0 BIO_BOT 2.0
3d printing the mixture
Bio Scaffold
Composition
Waste paper cups pulp
Technique
Mycelium roots
moisture along the length of the column Microclimate pockets Support tissue growth
Mycelium column
Fig. 22. Diagrammatic indication of the workflow and techniques used in the Mycelium Column project developed by Blast Studio
STEM CLOUD | ECOLOGICSTUDIO

“The new architectural machines are more like agents of local interaction, designed and developed as components of a larger self organising system.” 88
The STEMcloud v2.0 project suggests creating and evaluating an architectural prototype that serves as an oxygen-producing device. The proposal was planned and presented for the 2008 Seville Art and Architectural Biennale.89This project was initiated to create a real time interaction between humans, architectural machines and the living environment that is algae alongside its different species. This real time interaction is called a cybernetic feedback loop. A knowledge base was created to identify harmful algal blooms from different water bodies across the city. Modules with sensors, filled with different species of algaes were created. The photosynthetic characteristics, carbon absorption rate, and multiplicity rate were listed through machine learning and fed back into the module knowledge base. The machine module consisted of pipes through which humans could exhale CO2 to the module. The feedback loop is triggered as CO2 enters the module, leading to multiplication of algae and the rate defined from the knowledge base producing O2 in the gallery space. The heat, movement and light quality in the room is captured by the sensors to create a kinetic response and bioluminescence in the room. The sensors also trigger when CO2 depleted- thereby generating a response for humans to the feedback loop.

This case study is analysed as a basis of research to understand the limitations of cybernetic feedback loops and their architectural applications in real time. The machine to human interaction is limited to blowing air into the modules, as opposed to a spatial interaction. Such interactions need supervision and maintenance. Furthermore, the confinement to an indoor assembly lacks structural characteristics and limits the possibility of application at an urban scale. The material used to create the prototype machines is polysynthetic plastic- poor in biodegradability and a potential threat to the environment for a proposal focusing on ecological conscientiousness.


38 39 CASE STUDIES CASE STUDIES BIO_BOT 2.0 BIO_BOT 2.0
Algae
O2 production
Bioluminiscence Knowledge
Growth
Fig. 23. Diagrammatic indication of the workflow and techniques used in the Stem Cloud project developed by Ecologic Studio
Water Bodies
Types
rate
Base
Blowing CO2 in
Humans Emission of CO2 Emission of Heat Movement Low Lux Levels Low Oxygen Levels Increase in room temperature Gallery space Robotic Operating System Sensors Aggregate/Disintegrate Kinetic Response Simulate production Of Algae
reaction
LED signals to indicate low levels of O2 Trigger Bioluminiscence Regulate Oxygen Levels Bio-Receptive Modules
Pipes connected to algae chambers
the module
Chemical
Produce
LIVING FACADE | BURO HAPPOLD AND COOKFOX ARCHITECTS


40 41 CASE STUDIES CASE STUDIES BIO_BOT 2.0 BIO_BOT 2.0
Fig. 24. Diagrammatic indication of the workflow and techniques used in the Living Facade project by Burro Hapold And Cookfox Architects
Bird Anatomy scale environment Bird collision
Knowledge Base High Flights Mass deaths Eradication o teracotta units hollow soil pocket
species Sensitive Facade
Customised pocket bird habitat
water supply vegetative layer air flow
Intervention
Architectural
Commercial architecture represents the global identities of cities. Tall glass buildings have been a symbol of modernisation since the industrial revolution. However, as contemporary and iconic the tallest glass skyscraper looks, stretching its shadow across the ground, it comes with its adverse repercussions and setbacks for the natural species existing alongside humans as a part of the urban ecosystem. Millions of birds die everyday by glass facade collisions due to their incapability to see glass facades during their flight. The reason behind this being the glass facades that do not emit the UV rays that are visible to the birds, leading to mass bird deaths. Many architects, designers and environmentalists have started paying attention to this adversity and new ideas and architecture have emerged in the recent past few years. One such example that was analysed as a case study for the thesis research was Buro Happold and Cookfox Architects’ living facade. The living facade was a design prototype for a double skin facade that could house small wildlife, insects, birds and plants. The facade was designed as an assembly of terracotta units with micro-habitat pods resolved according to the anthropometrics to house birds and insects.
“The facade system is designed to support the diverse native ecosystem that thrive in our urban environments,” said Buro Happold associate Andre Parnther. Each individual module has a sculptural, arrow-like shape comprised of three prongs and circular openings that can be fitted with nesting pods to provide wildlife with inhabitable space beneath the surface of the facade. The measurements of the bird’s nest pods were considered for specific bird species. Reeds were packed within pods with seven-centimeter-wide openings that were designed to house pollinating bees and create spaces for numerous species to nest and populate.
Though the project stands at the threshold of marking the beginning of the age of interspecies design, it lacks the exploration of materiality in execution. Although there is immense detail added to the terracotta pods to house the birds and bees, the natural habitat environment is created artificially as an external assembly to these pockets. Undergrowth, grass layers are installed in the facade as a later process- contributing to the aspect of expensive maintenance or care. This argument leads us to think critically about the materiality of facade systems intended to support wildlife; opening a complete new avenue of research into biomaterials that support growth of ecosystems in their natural capacity while rendering differences between artificial and natural material.90
INFERENCES
The case studies which have been selected have been identified for their ranging scales of implementation; a contribution in understanding that the research proposal must include different scales of design in order to truly contribute a proposal which has extracted biological assembly information on material.
One of the challenges in the research; is the shortcomings of each case study as they relate to the ultimate ambition. Elements of each would need to metastasize into one to show a deeper understanding of bio-material design and diversity. However, this may be a struggle of choosing material design as facilitator of ecosystem; one must deduce based on a large range of information what vegetation or species might prefer through trial and error, while taking into account that the success or deduced failure of experimentation has a much larger time frame of testing than other elements of design- particularly in the case of botany- a cycle of propagation, understanding that certain types of plants need to die off first before they can establish themselves in soil permanently.
42 43 CASE STUDIES CASE STUDIES BIO_BOT 2.0 BIO_BOT 2.0
DOMAIN CONCLUSION RESEARCH QUESTIONS
Can interstitial spaces reinvigorate feedback between ecological degradation and urban context?
How do bio-bot modules become a living system that benefits the human and local environment?
What are the architectural decisions to be taken based on the bio-material life cycle through its temporal changes? Can its composite material be woven for structural performance while adapting to living tissue to support its performance?
Can public interaction, as involuntary response, become a participatory practice for ecological inclusion?
Can the boundaries between architectural and green boundaries be blurred by technology to create new interspecies mutualism?
The domain chapter concludes that for the breadth of information being extracted simultaneously it is important to devise a way for all of the different aspects of the project to work in parallel and systematically develop into one another. The Green Belt as a container for situating the project delineates the necessity for a continuous connection of green spaces found lacking within highly urbanised developments in London. As anthropogenic pollution exacerbates climate change, greenhouse emissions, heat fluxes and environmental shifts, self-sustainable purification therefore becomes the primary method of intervention.
Participatory practice must be introduced as a pedagogy for eco-intervention within the interstitial city spaces in Central London as a trade for providing self-sustainable energy as an introspection which has led us into the energy crisis. Thus, Soho, London emerges as being the worst-case test scenario for the efficacy of the proposal; not to be superseded by the importance of implementing a living tissue in order to reintegrate hard landscape and soft ecologies.
The analysis extracted from the Deep Green, Mycelium Column and Stem Cloud reveal that there are strict limitations in implementing information conducted at the material scale to translate to an urban intervention. For this reason, the methods by which a network can be devised for this dissertation must have a multilateral approach to develop how biomaterials can work within a morphological organisation that serves as a solution to combat ecological degradation while self-regulating to enhance the spatial experience of its human and non-human occupants.
44 45 RESEARCH QUESTION RESEARCH QUESTION BIO_BOT 2.0 BIO_BOT 2.0
ENDNOTES
1. Keller Easterling, “Landscapes, Highways, and Houses in America,” in Organisation Space (Cambridge, Mass..: MIT Press, 1999), 25–34.
2. Frey, Darrell, Bioshelter Market Garden: A Permaculture Farm (New Society Publishers, 2010), https://www.perlego.com/book/566670/bioshelter-market-garden-a-permaculture-farm-pdf.
3. “Ought Implies Can | Ethics and Logic | Britannica,” accessed January 8, 2023, https://www.britannica.com/topic/ought-implies-can.
4. Larry Gould, Stephen Jay, “The Flamingo’s Smile: Reflections in Natural History,” Reversals, n.d.
5. “‘O Earth, Pale Mother!,’” In These Times, accessed January 8, 2023, https://inthesetimes.com/ article/o-earth-pale-mother.
6. Jonn Elledge, “Loosen Britain’s Green Belt. It Is Stunting Our Young People,” The Gardian, September 22, 2017, https://www.theguardian.com/commentisfree/2017/sep/22/green-belt-housing-crisis-planning-policy.
7. Vanessa Miriam Carlow and Yeon Wha Hong, “London Green Belt: From a Landscape for Health to Metropolitan Infrastructure,” in Proceedings of 8th Conference of the International Forum on Urbanism (IFoU) (8th Conference of the International Forum on Urbanism (IFoU), Incheon, Korea: MDPI, 2015), 755–64, https://doi.org/10.3390/ifou-E003.
8. “London Set To Lose 48,000 Acres Of Its Local Countryside | London Green Belt Council,” accessed September 16, 2022, https://londongreenbeltcouncil.org.uk/london-set-to-lose-48000acres-of-its-local-countryside/.
9. “Green Belt under Threat from 200,000 New Houses” (The Times, January 28, 2019), https:// www.thetimes.co.uk/article/green-belt-under-threat-from-200-000-new-houses-lxp7zkkdr.
10. “Landscape Fragmentation Pressure in Europe,” accessed September 16, 2022, https://www. eea.europa.eu/ims/landscape-fragmentation-pressure-in-europe.
11. Carlow and Hong, “London Green Belt.”
12. “Air Pollution and the Effect on Our Health | London Councils,” accessed September 16, 2022, https://www.londoncouncils.gov.uk/node/33227.
13. Vizzuality, “Greater London, England, United Kingdom Deforestation Rates & Statistics GFW,” accessed September 16, 2022, https://www.globalforestwatch.org/dashboards/country/ GBR/1/36.
14. “London Air Quality Network » Annual Pollution Maps,” accessed September 16, 2022, https:// www.londonair.org.uk/london/asp/annualmaps.asp.
15. Emma Bryce, “Global Study Reveals the Extent of Habitat Fragmentation,” Audubon, March 20, 2015, https://www.audubon.org/news/global-study-reveals-extent-habitat-fragmentation.
16. Kate Orff, “Cohabit,” in Towards an Urban Ecology; Scape; (The Monacelli Press, 2016), 81–138.
17. Crawford Stanley Holling, “Resilience and Stability of Ecological Systems,” Annual Review of Ecology and Systematics, 1973, 1–23.
18. https://plus.google.com/+UNESCO, “The Unbearable Burden of the Technosphere,” UNESCO, March 27, 2018, https://en.unesco.org/courier/2018-2/unbearable-burden-technosphere.
19. James Asworth, “Bees, Butterflies and Moths ‘confused’ by Air Pollution,” January 24, 2022, https://www.nhm.ac.uk/discover/news/2022/january/bees-butterflies-and-moths-confusedby-air-pollution.html#:~:text=Air%20pollution%20obscures%20the%20sweet,by%20as%20 much%20as%2031%25.
20. McNaughtan Dugald, ‘Why Are Insects Important?’ (Wiltshire Wildlife Trust’s (WWT), 2022), https://www.wessexwater.co.uk/community/blog/why-are-insects-important#:~:text=breaking%20down%20and%20decomposing%20 organic,mammals%20 consist%20of%20mainly%20 insects
21. McNaughtan Dugald.
22. Louis F. Cassar, Landscape and Ecology The Need for a Holistic Approach to the Conservation of Habitats and Biota (Routledge, 2018), https://www.um.edu.mt/library/oar/handle/123456789/86664.
23. “Green Belt under Threat from 200,000 New Houses.”
24. Maurice Merleau-Ponty, “Performative Acts and Gender Constitutions: An Essay in Phenomenology and Feminist Theory,” no. 4 (December 1988): 31–519.
ENDNOTES
25. Cai Haoyang, “Algae-Based Carbon Sequestration,” IOP Conference Series: Earth and Environmental Science 120 (March 1, 2018): 012011, https://doi.org/10.1088/1755-1315/120/1/012011.
26. Peter Bishop, “Repurposing the Green Belt in the 2st Century,” n.d., 185.
27. Polly Turton, “Urban Heat Risk Mapping and Visualisation in London,” n.d., 23.
28. Turton, “Urban Heat Risk Mapping and Visualisation in London.”
29. “London Air Pollution,” n.d., https://globalcleanair.org/data-to-action/london-uk/.
30. Sergio Ulgiati and Amalia Zucaro, “Challenges in Urban Metabolism: Sustainability and Well-Being in Cities,” Frontiers in Sustainable Cities 1 (May 16, 2019): 1, https://doi.org/10.3389/ frsc.2019.00001.
31. By Alan Buis Laboratory NASA’s Jet Propulsion, ‘Milankovitch (Orbital) Cycles and Their Role in Earth’s Climate’, Climate Change: Vital Signs of the Planet, accessed 20 July 2022, https://climate.nasa.gov/news/2948/milankovitch-orbital-cycles-and-their-role-in-earths-climate.
32. Marshall Shepherd, “Carbon, Climate Change, and Controversy,” Animal Frontiers 1 (July 1, 2011): 5–13, https://doi.org/10.2527/af.2011-0001.
33. NASA Global Climate Change, “Carbon Dioxide Concentration | NASA Global Climate Change,” Climate Change: Vital Signs of the Planet, accessed July 20, 2022, https://climate.nasa.gov/vital-signs/carbon-dioxide.
34. “Spiralling Energy Prices Will Turn the UK’s Cost-of-Living Crisis into a Catastrophe • Resolution Foundation,” accessed January 9, 2023, https://www.resolutionfoundation.org/comment/spiralling-energy-prices-will-turn-the-uks-cost-of-living-crisis-into-a-catastrophe/.
35. “Supporting Vulnerable Energy Customers through the Energy Crisis,” National Energy Action (NEA) (blog), accessed January 8, 2023, https://www.nea.org.uk/energy-crisis/supporting-vulnerable-energy-customers-through-the-energy-crisis/.
36. “Why Have Energy Bills in the UK Been Rising?,” British Politics and Policy at LSE (blog), October 20, 2022, https://blogs.lse.ac.uk/politicsandpolicy/why-have-energy-bills-in-the-uk-been-rising-net-zero/.
37. “How Much Waste Is Produced From Renewables vs. Fossil Fuels? Green Journal,” June 30, 2020, https://www.greenjournal.co.uk/2020/06/how-much-waste-is-produced-from-renewables-vs-fossil-fuels/.
38. Jorgensen and Tylecote.
39. OMAI, “A FIELD GUIDE TO PUBLIC SPACES Are We Making Inclusive Choices in the Design and Management of Public Spaces That Help Promote a Democratic Society?,” n.d. 40. OMAI.
41. Cristian Alejandro Silva Lovera, “THE INTERSTITIAL SPACES OF URBAN SPRAWL: THE PLANNING PROBLEMS AND PROSPECTS – THE CASE OF SANTIAGO DE CHILE,” University College London, The Bartlett School of Planning, September 2016, 332.
42. Anna Jorgensen and Marian Tylecote, “Ambivalent Landscapes—Wilderness in the Urban Interstices,” Landscape Research 32, no. 4 (August 2007): 443–62, https://doi. org/10.1080/01426390701449802.
43. Orff, “Cohabit.”
44. “Knowing the Synanthrope,” The Expanded Environment (blog), accessed January 8, 2023, http://www.expandedenvironment.org/knowing-the-synanthrope/.
45. Burke, James Lee, In the Moon of Red Ponies, Billy Bob Holland 4 (Simon & Schuster, 2004).
46. “Urban Foxes | Royal Borough of Kensington and Chelsea,” accessed January 8, 2023, https:// www.rbkc.gov.uk/environment/environmental-health/urban-foxes.
47. Amy R. Klegarth, “Synanthropy,” in The International Encyclopedia of Primatology (John Wiley & Sons, Ltd, 2017), 1–5, https://doi.org/10.1002/9781119179313.wbprim0448.
48. “Knowing the Synanthrope.”
49. Gunnell, Kelly, Williams, Carol, and Murphy, Brian, Design for Biodiversity: A Technical Guide for New and Existing Buildings (RIBA Publishing, 2019), https://www.perlego.com/book/1522095/ design-for-biodiversity-a-technical-guide-for-new-and-existing-buildings-pdf.
50. “Deep Green,” n.d., https://www.ecologicstudio.com/projects/deep-green-urbansphere-venice.
51. Lovera, “THE INTERSTITIAL SPACES OF URBAN SPRAWL: THE PLANNING PROBLEMS AND PROS-
46 47 RESEARCH QUESTION RESEARCH QUESTION BIO_BOT 2.0 BIO_BOT 2.0
ENDNOTES ENDNOTES
PECTS – THE CASE OF SANTIAGO DE CHILE.”
52. Dennis Doordan, “Neri Oxman: Material Ecology,” Design Issues, January 1, 2021, https://www. academia.edu/45382106/Neri_Oxman_Material_Ecology.
53. Dirk Hebel and Felix Heisel, eds., Cultivated Building Materials: Industrialized Natural Resources for Architecture and Construction (Basel: Birkhäuser, 2017).
54. Rachel Armstrong, Soft Living Architecture; An Alternative View of Bio-Informed Practice (London: Bloomsbury Publishing Plc, 2018).
55. Hebel and Heisel, Cultivated Building Materials.
56. Marcos Cruz and Richard Beckett, “A Novel Approach towards Bio-Digital Materiality,” Bartlett School of Architecture; University College London, n.d., 20.
57. Hebel and Heisel, Cultivated Building Materials.
58. Armstrong, Soft Living Architecture; An Alternative View of Bio-Informed Practice.
59. IARC, “Wood Dust and Formaldehyde IARC Monographs on the Evaluation of Carcinogenic Risks to Humans Volume 62,” IARC Publications, 1995, https://publications.iarc.fr/80.
60. Zaira Zaman Chowdhury et al., “Influence of Carbonization Temperature on Physicochemical Properties of Biochar Derived from Slow Pyrolysis of Durian Wood (Durio Zibethinus) Sawdust,” BioResources 11, no. 2 (February 17, 2016): 3356–72, https://doi.org/10.15376/biores.11.2.3356-3372.
61. Chowdhury et al.
62. Hassan Al-Haj Ibrahim, “Introductory Chapter: Pyrolysis,” in Recent Advances in Pyrolysis, ed. Hassan Al- Haj Ibrahim (IntechOpen, 2020), https://doi.org/10.5772/intechopen.90366.
63. Hebel and Heisel.
64. Chowdhury et al., “Influence of Carbonization Temperature on Physicochemical Properties of Biochar Derived from Slow Pyrolysis of Durian Wood (Durio Zibethinus) Sawdust.”
65. Chowdhury et al., ‘Influence of Carbonization Temperature on Physicochemical Properties of Biochar Derived from Slow Pyrolysis of Durian Wood (Durio Zibethinus) Sawdust’.
66. Chowdhury et al., “Influence of Carbonization Temperature on Physicochemical Properties of Biochar Derived from Slow Pyrolysis of Durian Wood (Durio Zibethinus) Sawdust.”
67. Chowdhury et al.
68. Hordern, Jane, “Carbon Capture Using Sawdust,” 2011, https://blogs.rsc.org/ee/2011/03/24/ carbon-capture-using-sawdust/?doing_wp_cron=1658157492.9371159076690673828125.
69. “Can a Moss Culture Really Clean Urban Air?,” November 22, 2017, https://www.greenhomegnome.com/moss-clean-urban-air/.
70. Holling, “Resilience and Stability of Ecological Systems.”
71. T. Pettit et al., “Do the Plants in Functional Green Walls Contribute to Their Ability to Filter Particulate Matter?,” Building and Environment 125 (November 15, 2017): 299–307, https://doi. org/10.1016/j.buildenv.2017.09.004.
72. Nurulshyha Md Yatim and Nur Izzatul Afifah Azman, “Moss as Bio-Indicator for Air Quality Monitoring at Different Air Quality Environment,” International Journal of Engineering and Advanced Technology 10, no. 5 (June 30, 2021): 43–47, https://doi.org/10.35940/ijeat.E2579.0610521.
73. Yatim and Azman.
74. “Experiencing Innovative Biomaterials for Buildings: Potentialities of Mosses Elsevier Enhanced Reader,” accessed July 18, 2022, https://doi.org/10.1016/j.buildenv.2020.106708.
75. “MosSkin: A Moss-Based Lightweight Building System Elsevier Enhanced Reader,” accessed July 18, 2022, https://doi.org/10.1016/j.buildenv.2022.109283.
76. “Moss Voltaics - The Institute for Advanced Architecture of Catalonia,” IAAC (blog), accessed January 9, 2023, https://iaac.net/project/moss-voltaics/.
77. “Tiny Algae and the Political Theater of Planting One Trillion Trees,” accessed July 20, 2022, https://parametric.press/issue-02/algae/.
78. “Online Atlas of the British and Irish Flora,” accessed September 16, 2022, https://plantatlas.brc. ac.uk/.
79. “Tiny Algae and the Political Theater of Planting One Trillion Trees.”
80. Stephen Cousins, “Carbon-Eating Bio Curtains – the Answer to City Pollution?,” RIBA, August
19, 2019, https://www.ribaj.com/products/carbon-capture-pollution-eating-algae-filled-curtains-bio-plastics-photosynthetica-ecologicstudio.
81. “Tiny Algae and the Political Theater of Planting One Trillion Trees.”
82. Vetrivel Anguselvi et al., CO2 Capture for Industries by Algae, Algae (IntechOpen, 2019), https:// doi.org/10.5772/intechopen.81800.
83. “Minimizing Carbon Footprint via Microalgae as a Biological Capture | Elsevier Enhanced Reader,” accessed July 20, 2022, https://doi.org/10.1016/j.ccst.2021.100007.
84. “Deep Green.”
85. Jennifer Hahn, “Blast Studio 3D Prints Column from Mycelium to Make ‘Architecture That Could Feed People,’” Dezeen, January 18, 2022, https://www.dezeen.com/2022/01/18/blast-studio-tree-column-mycelium-design/#.
86. Hahn.
87. Hahn.
88. Claudia Pasquero and Marco Poletto, ‘Steam Cloud V2.0 by EcoLogic Studio’, 2008, https://www. ecologicstudio.com/projects/stemcloud-seville-art-and-architecture-biennale-2008.
89. Pasquero and Poletto, “Steam Cloud V2.0 by EcoLogicStudio.”
90. James Parkes, Buro Happold and Cookfox Architects Develop Living Facade for Birds and Insects, 2022, https://www.dezeen.com/2022/09/16/architectural-ceramic-assemblies-workshop-buro-happold-cookfox-architects-facade-design/.
48 49 DOMAIN CHAPTER DOMAIN CHAPTER BIO_BOT 2.0 BIO_BOT 2.0
METHODOLOGY

50 51 METHODOLOGY METHODOLOGY BIO_BOT 2.0 BIO_BOT 2.0
METHODOLOGY
One of the aims of the project is to develop a methodology which emphasises the necessary steps to be undertaken to attain equilibrium between the biological scale of material experimentation and its execution, without detracting from the morphological development of nature-based systems. For this reason, the methodology surrounding the design of the proposed network modules should work synergistically with proposed biological growth; in order to deduce its temporal growth or decay over time.
For this reason, Diffusion Limited Aggregation (DLA) is an appropriate method in developing network relationships as it proves efficient both at the scale of urban distributions as well as naturally occurring bifurcations existing in ecological landscape. As an outset, the morphological development of the modules should facilitate cellular distributions organised as nodal or linear connections to emphasise the decision for DLA; their combinatory connections that must fit within urban spatial implication without inhibiting preexisting architecture.
The development of a biological material explored in these scenarios conforms to the limitation to the natural, ecological growth cycle and its material timeline and decay cycle are studied as integral to its temporal feasibility. For this reason, its fabrication is strategised through a kit-of-parts regularised automation using Computer Numerical Control (CNC) fabrication and robotic extrusion for precise economic mass assembly of structural scaffolds to be interjected with robotically extruded custom geometries for each functional module’s purpose. Furthermore, the material and fabrication cycle has been precisely identified such that the production and participation with the modules on-site does not conflict with the atmospheric emissions the proposal removes.
These methods developed at the MSc. phase provided the basis by which the network generation, component development and morphological specificity could be tested as an implementation strategy. The MArch methodology has expanded on investigating more closely the relationship between climatic real-time data and its application as an environmentally grown network in-situ; defining the requirements of participatory reflection to facilitate true feedback within the scope of contemporary urban planning and detailing.
52 53 METHODOLOGY METHODOLOGY BIO_BOT 2.0 BIO_BOT 2.0
ENVIRONMENTAL COMPUTATION
Pioneered in 1982 by Finnish professor and researcher Dr. Teuvo Kohonen, a self-organizing map is an unsupervised learning model, intended for applications in which maintaining a topology between input and output spaces is of importance. The notable characteristic of this algorithm is that the input vectors that are close — similar — in high dimensional space are also mapped to nearby nodes in the 2D space. It is in essence a method for dimensionality reduction, as it maps high-dimension inputs to a low (typically two) dimensional discrete representation and conserves the underlying structure of its input space.92 In order to generate an environmentally responsive architectural solution for now and upcoming challenging climatic conditions, it has become extremely important to consider environmental parameters as input for design strategies. However, it is difficult to record environmental data for a large area as it may vary after every square meter of area as environmental and weather conditions and responses are subject to natural phenomenon. However, architects, environmentalists, engineers have been exercising different techniques to record this data. One of the most successful methods refers to dividing the floor area to be mapped in a grid, with one voxel size considered as unit area. Environmental parameters such as cumulative access to daylight, wind and urban parameters such as most likely pedestrian paths, water catchment areas etc. are mapped for each voxel.A valuable detail is that the entire learning occurs without supervision i.e. the nodes are self-organizing. They are also called feature maps, as they are essentially retraining the features of the input data, and simply grouping themselves according to the similarity between one another. This has a pragmatic value for visualizing complex or large quantities of high dimensional data and representing the relationship between them into a low, typically two-dimensional, field to see if the given unlabelled data has any structure to it.93

ENVIRONMENTAL COMPUTATION
These parameters are mapped as weights for each voxel.Different gradients are assigned to each environmental parameter being mapped to display weights. A cumulative weight is calculated for each voxel. Later, by the help of the self organizing algorithm. A voxel gets clustered corresponding to the environmental parameter that has the maximum contribution in the cumulative weight. Hence, the voxels get mapped as clusters of color gradients.

A Self-Organising Map, additionally, uses competitive learning as opposed to error-correction learning, to adjust its weights. This means that only a single node is activated at each iteration in which the features of an instance of the input vector are presented to the neural network, as all nodes compete for the right to respond to the input.The chosen node — the Best Matching Unit (BMU) — is selected according to the similarity, between the current input values and all the nodes in the grid.The node with the smallest Euclidean difference between the input vector and all nodes is chosen, along with its neighboring nodes within a certain radius, to have their position slightly adjusted to match the input vector.By going through all the nodes present on the grid, the entire grid eventually matches the complete input dataset, with similar nodes grouped together towards one area, and dissimilar ones separated.
As architects, to design for drastically varying environments, and generate responsive design strategies and decisions for the same, large data mapping, utilizing the information and its representation will be extremely important. Hence, development and use of these environmental computational methodologies has been explored in the thesis design and research. Methods such as the PlanBee grasshopper component for generating self-organizing maps have been explored. Voxel weighting method in three dimensional space has been generated further.94
54 55 METHODOLOGY METHODOLOGY BIO_BOT 2.0 BIO_BOT 2.0
Fig. 25. Self Organisational mapping cluster91
Fig. 26. KSOM MAP
DIFFUSION LIMITED AGGREGATION
Witten and Sander first introduced Diffusion Limited Aggregation (DLA) in 198196 to simulate the formation of clusters in aerosols utilising diffusion and Brownian motion as the primary particle behaviour governing transport processes. Since then, many variations of this simple DLA algorithm have been developed to mimic a wide range of physical development processes.97 The basic theory for the DLA model involves considering colloidal particles undergoing Brownian motion in some fluid and their subsequent irreversibly contact with one another.98 The clusters produced by this method are fractal and highly branched. The cluster’s fractal structure develops as a result of the faster-growing regions shielding the slower-growing regions, which make the cluster less accessible to incoming particles.99


Environmental Diffusion Limited Aggregation (eDLA) has been designed and employed as a system for developing the green network. It builds upon the Attracted Diffusion Limited Aggregation (DLA) in which each particle is considered an attractor point for the next particle attachment. DLA is an appropriate system which behaves similar to the metabolic balance and exchanges outlined in the simulation of biological growth systems. For this reason, it was investigated further to encompass real-time climatic data as a method of growing a site-specific network to address environmental shifts which implements the analysed data as an input for growth rather than an output to test optimisations against.
EVOLUTIONARY OPTIMISATION

The evolutionary design method establishes a balance within opposing aims; allowing insight into the synthesis of varying parameters such as local environmental variables, the performance existing system interjections and the tracking of generational changes made over the course of development. Based upon evolutionary optimisations over larger periods of time in nature, it is analogous with the ethos of the methodology outlined; to understand how the satisfaction of specific criteria can change within an environment in flux. It will be used to define the development at the morphological scale of the modules as a design solution and to extract the information needed for naterial implementation.

56 57 METHODOLOGY METHODOLOGY BIO_BOT 2.0 BIO_BOT 2.0
Fig. 27. 2-D DLA aggregates with versatile particle numbers95
Fig. 28. Standard Deviation graphs. The graphs plot all three fitness objectives. The red dots and curves show the selected solution in the entire simulation. It shows how successfully or unsuccessfully simulation optimised this solution for the three fitness objectives.
DIFFERENTIAL GROWTH
Biological systems have developed versatile design strategies through evolution over billions of years. Uncovering these design principles not only elucidates the mechanisms underlying the evolution of living systems, but also establishes the scientific basis for biomimetics whereby advanced materials and systems could be developed based on lessons learned from nature.100 “Differential growth is a feature of cells, the organs which they construct, and the whole plant itself. The term “differential growth” is used generally in the sense of growth that results in curvature or similar distortion in the outline of a tissue or organ.”101 Differential Growth is based on three derivatives: point-based, line-based and edge-based simulation.102 A flat or curved surface may be filled up utilising the point-based method of polyline growth and division, using circular packing to prevent self-intersection. Line-based begins active growth from a point but rather than dividing into two distinct points, they remain united to form an expanding line. In the edge-based model, active growth area is located at the edge of the surface.

The point-based and edge-based model will be implemented as the appropriate choice for module development given that relationships between surface and volume will be identified.

58 59 METHODOLOGY METHODOLOGY BIO_BOT 2.0 BIO_BOT 2.0
Fig. 29. Differential growth. Point based method of polyline growth. CNC model
Fig. 30. Differential growth. Point based method of polyline growth. CNC model
ROBOTIC 3D PRINTING
The need to investigate new solutions and novel 3-D building strategies not only requires the development of new algorithms but also reconsiderations of existing technological aspects for developing building fabrication techniques- frequently driven by economic and sustainable measures. In this context, additive manufacturing plays a huge role. Additive manufacturing is the process of creating an object by building it one layer at a time. It is the opposite of subtractive manufacturing, in which an object is created by cutting away at a solid block of material until the final product is complete.103
One of the main advantages of additive manufacturing is the feasibility of building up complex morphologies which can be limited by subtractive manufacturing. For this reason, additive manufacturing via robotic arm alters the threshold of possible fabrication techniques by utilising dimensional axial control in order to generate dynamic tool paths. This can effectively be extruded by identifying a custom end effector nozzle attached to the robotic arm in order to integrate 3-D printing for fabrication. The robotic arm fabricated by KUKA Robotics has six axes of control and proven efficient in the building industry. The printing process involves the superimposition of thermoplastic ABS or PLA material along the direction of gravity to print self-supporting forms and grow from bottom-up. This technique has proven to be highly sustainable in the past few years as it has aided additive manufacturing using novel biomaterials. Its successful experiments open new avenues of research to explore how to 3-D print newly devised bio materials such as mycelium, cellulose, algae and, in the case of this research proposal, timber saw dust. n.
CNC MILLING


Modular prototyping of building materials is not only a cost effective methodology used in the building industry, but also the future of sustainable and eco-friendly building manufacturing methods. Modular prototyping has been practised in the age-old technique of using moulds to fabricate building blocks. Moulding is a manufacturing process that involves shaping a liquid or malleable raw material by using a fixed frame, known as either a mould or a matrix. The advantages of fabrication of building material parts through modular moulds are efficient high production, low cost per part, repeatability, large material choice, low waste generation, high detail and little or no post-processing; suitable for mass-production at the urban scale.
Computer Numerical Control (CNC) machining or milling is an effective technique to produce highly detailed and intricate moulds. CNC machines provide computerised controls to produce a custom-designed part or product of high quality and precise finish. Using subtractive machining technology, CNC milling becomes the solution to high production output and less labour intensive processes. Advancement in the mould production process in order to create building materials made from novel biomaterial with variable baking temperature is a highly sustainable breakthrough in the world where production of synthetic building materials thrive. Double moulding techniques using CNC milling and silicone moulding provide a platform to make use of custom techniques for a greater cause of sustainability.104
60 61 METHODOLOGY METHODOLOGY BIO_BOT 2.0 BIO_BOT 2.0
Fig. 31. Graphical representation of Robotic extrusion process of the plants’ structure created using the differential growth algorithm
Fig. 32. Graphical representation of CNC milling process of living tissue structure created using the differential growth algorithm
ENDNOTES
91. Machine Learning Researcher at Idiap. Data Science graduate from University of Bath. Former Intern at CERN, “Kohonen Self-Organizing Maps,” n.d., https://towardsdatascience.com/kohonen-self-organizing-maps-a29040d688da.
92. Machine Learning Researcher at Idiap. Data Science graduate from University of Bath. Former Intern at CERN.
93. Machine Learning Researcher at Idiap. Data Science graduate from University of Bath. Former Intern at CERN.
94. Machine Learning Researcher at Idiap. Data Science graduate from University of Bath. Former Intern at CERN.
95. Dongjing Liu et al., “Fractal Simulation of Flocculation Processes Using a Diffusion-Limited Aggregation Model,” Fractal and Fractional 1, no. 1 (November 18, 2017): 12, https://doi.org/10.3390/ fractalfract1010012.

96. Rajur, ‘Modelling Diffusion Limited Aggregation’.
97. Rajur, ‘Modelling Diffusion Limited Aggregation’.
98. Halsey, “Diffusion-Limited Aggregation.”
99. Halsey.
100. Changjin Huang et al., “Differential Growth and Shape Formation in Plant Organs,” Proceedings of the National Academy of Sciences 115, no. 49 (December 4, 2018): 12359–64, https://doi. org/10.1073/pnas.1811296115.
101. Peter W. Barlow, Differential Growth in Plants (Oxford, New York: Pergamon Press, 1989).
102. Yufan Xie, “Differential Growth Research,” U-V-N (blog), August 23, 2017, http://uvnlab.com/differential-growth-research-en/.
103. Rebecca Linke, “Additive Manufacturing, Explained,” MIT Management Sloan School, December 7, 2017, https://mitsloan.mit.edu/ideas-made-to-matter/additive-manufacturing-explained#:~:text=What%20is%20additive%20manufacturing%3F,the%20final%20product%20is%20complete.
CHAPTER CONCLUSION
Diffusion Limited Aggregation (DLA), Environmental Diffusion Limited Aggregation (eDLA), differential growth and evolutionary optimisations set up the framework to explore nature-based systems and their implications in designing network strategies modularly. This allows for parallel areas of research which can, at this stage, be separated into appropriate site-specific solutions. Furthermore, by considering the possibility of the design solution to share similar structural assemblies via economic mass production, robotic extrusion methods can be implemented in order to achieve the complex geometries drawn from biomimetic growth models. By implementing digital (robotic) and analogue (moulding) methods in the physical prototyping, a sustainable workflow to devise ergonomic building fabrication techniques can be developed which can be integrated into both the environmental scheme and the participatory loop of assembly.
62 63 METHODOLOGY METHODOLOGY BIO_BOT 2.0 BIO_BOT 2.0
ENDNOTES
1. Keller Easterling, “Landscapes, Highways, and Houses in America,” in Organisation Space (Cambridge, Mass..: MIT Press, 1999), 25–34.
2. Frey, Darrell, Bioshelter Market Garden: A Permaculture Farm (New Society Publishers, 2010), https://www.perlego.com/book/566670/bioshelter-market-garden-a-permaculture-farm-pdf.
3. “Ought Implies Can | Ethics and Logic | Britannica,” accessed January 8, 2023, https://www.britannica.com/topic/ought-implies-can.
4. Larry Gould, Stephen Jay, “The Flamingo’s Smile: Reflections in Natural History,” Reversals, n.d.
5. “‘O Earth, Pale Mother!,’” In These Times, accessed January 8, 2023, https://inthesetimes.com/ article/o-earth-pale-mother.
6. Jonn Elledge, “Loosen Britain’s Green Belt. It Is Stunting Our Young People,” The Gardian, September 22, 2017, https://www.theguardian.com/commentisfree/2017/sep/22/green-belt-housing-crisis-planning-policy.
7. Vanessa Miriam Carlow and Yeon Wha Hong, “London Green Belt: From a Landscape for Health to Metropolitan Infrastructure,” in Proceedings of 8th Conference of the International Forum on Urbanism (IFoU) (8th Conference of the International Forum on Urbanism (IFoU), Incheon, Korea: MDPI, 2015), 755–64, https://doi.org/10.3390/ifou-E003.
8. “London Set To Lose 48,000 Acres Of Its Local Countryside | London Green Belt Council,” accessed September 16, 2022, https://londongreenbeltcouncil.org.uk/london-set-to-lose-48000acres-of-its-local-countryside/.
9. “Green Belt under Threat from 200,000 New Houses” (The Times, January 28, 2019), https:// www.thetimes.co.uk/article/green-belt-under-threat-from-200-000-new-houses-lxp7zkkdr.
10. “Landscape Fragmentation Pressure in Europe,” accessed September 16, 2022, https://www. eea.europa.eu/ims/landscape-fragmentation-pressure-in-europe.
11. Carlow and Hong, “London Green Belt.”
12. “Air Pollution and the Effect on Our Health | London Councils,” accessed September 16, 2022, https://www.londoncouncils.gov.uk/node/33227.
13. Vizzuality, “Greater London, England, United Kingdom Deforestation Rates & Statistics GFW,” accessed September 16, 2022, https://www.globalforestwatch.org/dashboards/country/ GBR/1/36.
14. “London Air Quality Network » Annual Pollution Maps,” accessed September 16, 2022, https:// www.londonair.org.uk/london/asp/annualmaps.asp.
15. Emma Bryce, “Global Study Reveals the Extent of Habitat Fragmentation,” Audubon, March 20, 2015, https://www.audubon.org/news/global-study-reveals-extent-habitat-fragmentation.
16. Kate Orff, “Cohabit,” in Towards an Urban Ecology; Scape; (The Monacelli Press, 2016), 81–138.
17. Crawford Stanley Holling, “Resilience and Stability of Ecological Systems,” Annual Review of Ecology and Systematics, 1973, 1–23.
18. https://plus.google.com/+UNESCO, “The Unbearable Burden of the Technosphere,” UNESCO, March 27, 2018, https://en.unesco.org/courier/2018-2/unbearable-burden-technosphere.
19. James Asworth, “Bees, Butterflies and Moths ‘confused’ by Air Pollution,” January 24, 2022, https://www.nhm.ac.uk/discover/news/2022/january/bees-butterflies-and-moths-confusedby-air-pollution.html#:~:text=Air%20pollution%20obscures%20the%20sweet,by%20as%20 much%20as%2031%25.
20. McNaughtan Dugald, ‘Why Are Insects Important?’ (Wiltshire Wildlife Trust’s (WWT), 2022), https://www.wessexwater.co.uk/community/blog/why-are-insects-important#:~:text=breaking%20down%20and%20decomposing%20 organic,mammals%20 consist%20of%20mainly%20 insects
21. McNaughtan Dugald.
22. Louis F. Cassar, Landscape and Ecology The Need for a Holistic Approach to the Conservation of Habitats and Biota (Routledge, 2018), https://www.um.edu.mt/library/oar/handle/123456789/86664.
23. “Green Belt under Threat from 200,000 New Houses.”
24. Maurice Merleau-Ponty, “Performative Acts and Gender Constitutions: An Essay in Phenomenology and Feminist Theory,” no. 4 (December 1988): 31–519.
64 65 METHODOLOGY METHODOLOGY BIO_BOT 2.0 BIO_BOT 2.0
RESEARCH DEVELOPMENT
The United Kingdom government envisaged a 25 Year Environmental Plan Strategy under the Environment Act 1995 as the Environment Agency (EA) was established to set out to promote sustainable development. Necessary amendments to this plan are made every year based on real-time environmental changes and concerns. “The United Kingdom is blessed with a wonderful variety of natural landscapes and habitats and our 25 Year Environment Plan sets out our comprehensive and long-term approach to protecting and enhancing them in England for the next generation. Its goals are simple: cleaner air and water; plants and animals which are thriving; and a cleaner, greener country for us all,” aligning with the intent for this proposal.
“By using our land more sustainably and creating new habitats for wildlife, including by planting more trees, we can arrest the decline in native species and improve our biodiversity. Connecting more people with the environment will promote greater well-being. And by making the most of emerging technologies, we can build a cleaner, greener country and reap the economic rewards of the clean growth revolution.”105
The objectives of the design research align with the objectives of the National Environment Policy. Considering abrupt changes in the environmental conditions in London such as threats to the Green Belt and drastic temperature differences in summer and winter alongside increases in the urban heat islands and air pollution. However, over exploitation has led to energy shortages in densely populated regions of London. Hence, there is a dire need to include energy preservation measures in the scheme while solving the aforementioned concerns. Thus, the design research focuses on developing a technological green-energy generating network strategy as a proposal to be incorporated in the environmental urban scheme of London.
The design strategy is based on developing an architectural network of ecological machines termed as “Bio_bots” being intervened in urban nodes prone to environmental deterioration. The ecological machines are proposed to be constructed out of a biomaterial that supports the growth of green tissue, while absorbing carbon from the atmosphere. Furthermore, corresponding to the category of depletion, the urban nodes at risk are intended to be implemented with the network of these ecological machines as an interactive energy generating public pods or a double skin facade for the production of biofuel, collection of grey water, filtration of carbon and protection of flora and fauna in the concerned locations, obtained through urban mapping.
Consequently, the proposed green network strategy can be laid out as a participatory scheme for civil citizens in order to generate a sense of responsibility and awareness for the environment. The regions for intervention will lie in the thresholds between dense urban environments as sprouting points while terminating back into the London Green Belt.
66 67 RESEARCH DEVELOPMENT RESEARCH DEVELOPMENT BIO_BOT 2.0 BIO_BOT 2.0
CONTEXT ANALYSIS
CONTEXT ANALYSIS


68 69 RESEARCH DEVELOPMENT RESEARCH DEVELOPMENT BIO_BOT 2.0 BIO_BOT 2.0
Fig. 33. Metropolitan Green belt
Fig. 35. Annual heat demand (MWh)
Fig. 34. Green tissue of London
75.0+ 70.0-74.9 65.0-69.9 60.0-64.9 55.0-59.9 250+ 100-250 50-100 20-50 10-20 0-10
Fig. 36. Average noise level (dB)
Fig. 37. Annual mean NO2 (µg/m3)
Fig. 39. Annual mean PM10 (µg/m3)
Fig. 38. Annual mean NOX(µg/m3)
<16 16-19 19-22 22-25 25-28 28-31 <2 2-4 4-6 6-8 8-10 31-34 34-37 37-40 40-43 43-46 46-49 31-34 34-37 37-40 40-43 43-46 46-49 49-52 52-55 55-58 >58
Fig. 40. Annual mean PM2.5 (µg/m3)
Green belt
Light pollution
Waste
Water pollution
Noise pollution
NOx
Water
Buildings
Landscape
GLOBAL CONTEXT

In selecting London’s Green Belt as the scope for intervention, research was compiled and overlaid in order to specify a location of intervention within the metropolitan area. Its protected area identified in between the urban condition and the perimeter of the Green Belt delineates the larger boundary between the unbuilt to the built environment. The green tissue confirms that while there are green spaces within the urban environment there is no continuity between the Green Belt tissue into any area outside the larger ring- thus establishing the justification for implementing bio-bot as a connective living membrane for creating and preserving contiguous green space. In order to understand the disruption of possible metabolic balances within fragmented ecosystems analysis needs to include interference from human activity to extract the root connections. As mentioned by Haoyang, forest loss not only creates more area for urban construction but disrupts the relationship that green tissue has between the production and absorption of CO2 impractical for green-house emission- a crucial identification in why revitalising green living tissue needs to be implemented. Moreover, identifying that the annual heat demand (MWh) is localised within Central London where the densest accumulation of built spaces exists signified that this accumulation of masses disrupts the urban metabolic balance of self-thermoregulation which results in the ‘urban heat island effect.’ This directly impacts any surrounding ecosystems and habitats which have been pushed out further from the city boundary toward the Green Belt, otherwise identified as species encroachment. Noise and light pollution further disrupt any balance of nocturnal species post-Edison. The overdeveloped central areas create negative feedback effects directly back to its human occupants. Urbanisation which has facilitated the development of expansive road networks is a large proponent of the annual mean nitrogen dioxide (NO2) and nitrogen oxide (NO ). Road transport is estimated to be responsible for about 50% of total emissions of nitrogen oxides106 which occur during fossil fuel combustion and is directly associated with respiratory inflammation. As nitrogen is deposited into the environment as dry or wet deposition, it can change soil chemistry and affect biodiversity in sensitive habitats.107 In order to lower nitrogen oxide emissions, London has implemented the Low Emission Zone (LEZ) and Ultra Low Emission Zone (ULEZ) controlling vehicle emissions tracked across monitoring sites. Furthermore, when nitrogen oxides react with other chemicals in the air they form particulate matter (PM) and ozone. 108 PM10 (10 microns in diameter and inhalable) and PM2.5 (2.5 microns) index and annual concentrations for air quality regulations should be considered to understand the effects that overbuilt environments expound on their surroundings. “Around half of UK concentrations of PM comes from anthropogenic sources such as domestic wood burning and tyre and brake wear from vehicles,”109 and are being heavily monitored by the Air Quality Standards Regulations 2010 due to their toxicity upon entering the bloodstream. The identification of these layers of pollution localises possible interventions for the site by pinpointing worstcase scenarios in Central London as a starting strategy in Figure 42.
POLLUTION LAYERS AREA OF INVESTIGATION
The overlay of this information defines the intersections and thus possible areas of intervention within London. Furthermore, by isolating light pollution, waste, water and noise pollution created as a result of human activity, the areas of intervention can be considered areas of highest pollution; arbitration for the worst-case scenario. This is important in assessing the time frame that is necessary between the purification of the area, rebalancing its natural state and transitioning to a homeostatic state in which it can be preserved and protected. Measurable quantification of the pollution levels removed should be documented in order to gauge them against other locations to determine the lifespan of the bio-bot.


In consideration for the implementation of biobot to be utilised such that it mitigates fragmented landscapes, its connectivity of green tissue and metabolic engagement in situ positions the project’s adaptability. By selecting a location for a global-scale solution, there are three proposed locations to prove the adaptability of the research within the network of living tissue. These vary according to their spatial distributions, density of occupants, distance from existing green landscape and intensities of intervention (pollution). While different conditions of degradation, pollution and preservation must be met from environmental and sustainability criteria, it is crucial to acknowledge that varying network growth must be considered on a site-by-site basis. Moreover, the temporality of modules will change according to the timeframe needed in order to fully establish a cyclical and reparative relationship. The extracted, layered information arrives at Soho, Central London to be the first area of intervention at a small scale, medium density, far proximity from non-human designated green spaces.

70 71 RESEARCH DEVELOPMENT RESEARCH DEVELOPMENT BIO_BOT 2.0 BIO_BOT 2.0
Fig. 41. Exploded diagram of pollution levels in London with overlaid the most polluted areas
Fig. 42. The diagram shows the overlapped pollution layers
Fig. 43. The diagram shows the extracted area of investigation located in highly dense and polluted region
The strategy of layering information confirms Soho, Central London as a highly polluted and mid-density scenario for intervention. A closer analysis of the programmatic distribution of functionality revealed that Soho has not only has a wide spread of hospitality, entertainment, leisure, a smaller range of business, retail and three grades of historically conserved buildings.110 This sets up limitations for intervention within the scope of bio-bot. While the conservation grade buildings cannot be intervened in that fundamentally changes the historical appearance and integrity of the structure, interventions that provide amenable environmental situations are encouraged. So, limitations need to be set up in order to avoidsetbacks, proximity to ground or roof and accessibility to the transportation network for vehicles and pedestrians. The domain chapter sets up the argument that a new level of human to human participation, human to machine (or in this case bio-bot), human to nature, or nature to machine (bio-bot) can occur within the ‘third space’. Furthermore, depending on the programmatic distribution of what is the urban fabric of this interstitial space, the functionality can be detailed to respond to local context cues without disrupting the planned usage. A new type of ‘third space’ can take into consideration the proximity of nearby hospitality industries; the power usage of existing grid; spatial configurations for energy generation public pods, horticultural pods, moments of reprieve between commuting; an atmosphere that engages while stimulating a purified environmental sphere in a highly polluted area.


Hotel Residential
Non-residential Institution
Lesure Business
Retail
Drinking establishment
Restaurant | cafe Interstitial spaces
Vacant building
Historical protected building
Figure 45 takes into reflects the programmatic distributions of Figure 44 while making considerations for the green tissue within the urban context of Soho, London. The mapping identifies human-designated parks, green roofs (or roofs with green tissue atop) and existing green landscape against the historically protected buildings. This is the first step in delineating the connections between these three nodes. While there can be many permutations of different networks, they need to be considered against their limitations. Their areas are measured in order to understand the hierarchical organisation in regard to location. The inclination to prioritise human-designated parks over existing green tissue due to their size comparatively goes against the problem of fragmentation. In order to rehabilitate existing green tissue, it needs to be tied back to larger green spaces- rather than working in reverse. Furthermore, what is extracted from this diagrammatic analysis are the usable 3-D surfaces which provide a jumping off point; the plane of usable ground, the same plane above the ground at roof level, particular elevational planes and planes which cannot be allowed any intervention.
72 73 RESEARCH DEVELOPMENT RESEARCH DEVELOPMENT BIO_BOT 2.0 BIO_BOT 2.0
Fig. 44. Soho building use mapping
Fig. 45. Context analysis; Identification of green spaces such as parks, and green roofs. Extraction of possible areas of implementation such as underused interstitial spaces, empty areas on facades and roofs
Extensive depletion of the atmospheric ozone layer affects the absorption of solar ultraviolet radiation which radiates back terrestrially as heat.111 The annual solar radiation analysis of Soho reveals an increase of 300 hours between the winter solar radiation between November through March versus the summer months of April through October. The highest collections of radiation can be seen accumulating within the interstitial spaces; the winter ranges between 600 to 1057 direct solar hours and 910 to 1820 direct solar hours in the summer. While interstitial spaces may be prioritised lower in the typical functionality of space planning, the exposure to sunlight and, as a by-product of heat emissivity, radiates off the ground and exposes it thermally into the environment. Respectively for winter and summer, solar analysis identifies areas that receive more than 8 hours daily throughout the year. It can be concluded that this 8+ hour daily exposure will have a compounding effect on the thermal conductivity when the surface albedo is taken into consideration. However, the direct solar radiation hours on the envelopes of the site context indicate that both in winter and summer months there is consistently high enough exposure such that at this scale of intervention, all buildings consistently overheat during both seasons; the data cannot be used on its own as a viable environmental parameter. If, however, it is to be implemented as a parameter against which the performance of the bio-bot is being critically evaluated for in subsequent analysis.


The solar radiation analysis concludes that thermal conductivity should be identified in order to justify locations for reducing heat emissions from building materials that contribute to the heat island effect alongside albedo transitions from unbuilt to built environments. Albedo, the measure of reflection of material surface from solar radiation, identifies areas which are overheating for human occupants and a space for bio-bot intervention while playing a role in fragmentation: altering the microclimate conditions of the boundary edge.112 The material mapping exercise in Figure 52 establishes the estimations of thermal conductive shifts that prolonged exposure to direct solar radiation can overstress via human albedo development. The two built ‘parks’ in Soho; Golden Square is actually a series of trees planted into a substrate surrounded by asphalt with an albedo value of 0.05 and 95% of light absorption- negating any thermoregulation vegetation could have performed in the area. Soho’s material mapping identifies that material with high thermal conductivity such as steel, concrete and asphalt mainly used in infrastructural construction have high heat emissions during the day where as materials such as brick lime plaster and grass have considerably low amounts of thermal conductivity contributing lower degree of thermal emissions.


74 75 RESEARCH DEVELOPMENT RESEARCH DEVELOPMENT BIO_BOT 2.0 BIO_BOT 2.0
Fig. 46. Solar gain during the winter season from October until March
Fig. 47. Sample points on the surfaces on the ground level that receive more than 8 direct sun hours a day during the winter season
Fig. 48. Solar gain during the Summer season from April until September
Fig. 49. Sample points on the surfaces on the ground level that receive more than 8 direct sun hours a day during the Summer season
Fig. 50. Solar gain on the building morphologies during the Summer season from April until September Fig. 51. Solar gain on the building morphologies during the winter season from October until March
Fig. 52. Material mapping
1 W/mK 0 W/mK 1
Fig. 53. Material heat emission map
W/mK
Furthermore, it is clear from the direct solar radiation analysis that consistent roof exposure negatively impacts the albedo values and exacerbates the heat island effect.


Albedo coefficient113: Grass- 0.25 - 0.30; Trees - 0.15 - 0.18;
Lime Brick - 0.20 - 0.40; Red Brick - 0.20 - 0.40; Brown Brick - 0.20 - 0.40;
Steel - 0.35; Concrete - 0.10 - 0.35;
Tar and Gravel - 0.08 - 0.20; Asphalt - 0.05 - 0.20;
One of the environmental conditions to be assessed is the wind in Soho.

By identifying the wind directionality, highest and lowest speeds, as well as vector hits on the entirety of the site, it allowed for conclusions to be made about the spread of particulate matter, air diffusion and ultimately thermal comfort. The site was tested under Computational Fluid Dynamics(CFD) parameters in order to identify where the fastest air currents were coming through and the speed at which they disperse at the pedestrian level. This established the basis to understand how wind speeds and trajectories could

could be manipulated in order to place modules which could speed up velocities in areas which are overheating in need of thermoregulation or slow down velocities in areas which are, for example, closer to vehicular traffic. Furthermore, it was important to identify above, how the simulation channels the wind through larger open areas comparatively through interstitial spaces and courtyards. The values of highest concentrations of NO2, NOx, PM10 and PM2.5 were taken and remapped to be overlaid with a Figure 52 map of Soho. It revealed that locations near London’s low emission zones were problematic due to the diesel vehicles. Furthermore, the remapping of these values in order to recategorise areas into tiers for intervention facilitated considerations for how contextually and spatially different areas within Soho with the same values would need to be intervened in differently- thus setting up constraints quantified by allowable architectural intervention and space solutions.

76 77 RESEARCH DEVELOPMENT RESEARCH DEVELOPMENT BIO_BOT 2.0 BIO_BOT 2.0
Fig. 54. Computational fluids Dynamics Simulation (CFD) Fig. 55. Extracted area with the highest wind speed Fig. 56. Extracted area with the lowest wind speed Fig. 57. Possible areas of implementation where wind flow should be lowered, redirected or accelerated
Fig. 58. The maximum NO2, NOx, PM10, and PM2.5 concentration measurements were obtained and remapped to be overlaid with a map of Soho.
ENDNOTES
104. Junying Metal Manufacturing Co., Limited, “CNC Milling Guide – CNC Milling Advantages & Disadvantages, Application, Materials and Definition,” n.d., https://www.cnclathing.com/guide/ cnc-milling-guide-cnc-milling-advantages-disadvantages-application-materials-and-definition.
105. 25yearenvironmentplan@defra.gsi.gov.uk., “A Green Future: Our 25 Year Plan to Improve the Environment,” 2022 1995, https://assets.publishing.service.gov.uk/government/uploads/system/ uploads/attachment_data/file/693158/25-year-environment-plan.pdf.
106. “London Air Quality Network Guide,” accessed August 10, 2022, https://www.londonair.org.uk/ londonair/guide/WhatIsNO2.aspx.
107. “Concentrations of Nitrogen Dioxide,” GOV.UK, accessed August 10, 2022, https://www.gov.uk/ government/statistics/air-quality-statistics/ntrogen-dioxide.
108. OAR US EPA, “Basic Information about NO2,” Overviews and Factsheets, July 6, 2016, https:// www.epa.gov/no2-pollution/basic-information-about-no2.
109. “Concentrations of Particulate Matter (PM10 and PM2.5),” GOV.UK, accessed August 10, 2022, https://www.gov.uk/government/statistics/air-quality-statistics/concentrations-of-particulate-matter-pm10-and-pm25.
110. “Retrofitting-Soho-05-Main-Report-Chapter-2-P21-26-241208s.Pdf,” accessed August 12, 2022, https://www.westminster.ac.uk/sites/default/public-files/general-documents/Retrofitting-Soho-05-Main-Report-Chapter-2-p21-26-241208s.pdf.
111. “The Sun’s Impact on the Earth,” December 4, 2019, https://public.wmo.int/en/sun%E2%80%99simpact-earth.
112. Robert M. Ewers and Cristina Banks-Leite, “Fragmentation Impairs the Microclimate Buffering Effect of Tropical Forests,” PLoS ONE 8, no. 3 (March 4, 2013): e58093, https://doi.org/10.1371/ journal.pone.0058093.
113. “Albedo - an Overview ScienceDirect Topics,” accessed August 11, 2022, https://www.sciencedirect.com/topics/engineering/albedo.
78 79 RESEARCH DEVELOPMENT RESEARCH DEVELOPMENT BIO_BOT 2.0 BIO_BOT 2.0
MATERIAL DEVELOPMENT

80 81 MATERIAL DEVELOPMENT MATERIAL DEVELOPMENT BIO_BOT 2.0 BIO_BOT 2.0
As outlined in the domain chapter, timber sawdust is the primary material of investigation. If bio-bot is to postulate that it revitalises and mitigates the environmental damages of the locations it is interjected into, then the entirety of the fabrication process must be conducive to this idea of sustainability. The wood manufacturing process which begins at either harvesting of timber or local reclaimed elements of timber can be considered as the starting point; the sawdust byproduct at the stage of harvesting or milling timber can be cycled immediately back into the production of the module. The routed structural elements are milled from pieces of reclaimed wood and its sawdust, at various stages is transformed into a new experimental mixture which is either extruded robotically or moulded. This creates an opportunity to reconsider waste material as crucial in the cyclical loop of fabrication.

Subsequently, this leads to an examination of material sourcing: if the environmental purification benefits all who are localised to the bio-bot, it is possible that sawdust becomes a proponent of a circular economy. Local timber production factories, milling productions and even cabinetry fabricators (at the smallest scale) should consider recycling the sawdust byproduct for its fabrication. It simultaneously accounts for more sustainable waste recycling at no hindrance to anyone participating.

Saw dust, corn starch and yeast have been identified as composite materials for the biomaterial formulation.Corn starch is used as a binding agent as it aids to the adhesivity of the mixture when mixed with water, while yeast facilitates bubbling when added in warm sugar solution, producing gas as a byproduct.
Although the crucial objective of experimentation lies in activation of the surface of raw saw dust to generate porosity, that would induce the growth of microorganisms being beneficial for the growth of green tissue.114 Also, a highly porous surface leads to adsorption of black carbon as the carbon molecules create surface bonds115 with the porous sawdust surface aiding the filtration of air116. Hence, achieving porosity, considerable water retention, permeability, and structural stability were key attributes of physical experimentation to obtain the desired bio material composite. As a result, the physical experiments were conducted in the aforementioned order.
82 83 MATERIAL DEVELOPMENT MATERIAL DEVELOPMENT BIO_BOT 2.0 BIO_BOT 2.0
Fig. 59. Production cycle diagram. The scheme identifies all steps undertaken to produce modules
Fig. 60. Material structure. Exploded diagram shows layes needed for filtration of different types of particles
PRELIMINARY PROCESS EXPERIMENT
The raw composite mixture for the formation of the new biomaterial was prepared from three major components raw saw dust, corn starch and yeast. When water was added to dry sawdust mix in the ratio of 1 parts saw dust to 2 parts water, a non-viscous semi-solid mixture was created as weak surface bonds are created between water molecules and sawdust particles leading to this non viscous formation. 117 However in order to create a viscous mixture with adhesive capacity to generate stronger surface bonds, 1 part corn starch was added to this semi-solid mixture of saw dust and water. However, generating porosity was the significant aim of the experiment, therefore 0.1 parts of yeast was further added to this viscous mixture. The mixture was let to sit for thirty minutes in the absence of oxygen, in order to activate yeast. Then, the mixture was transferred in a desirable mould and baked in an air-drying furnace at a temperature of 200C for about 4 hours until the moisture was evaporated. A considerable amount of porosity was observed in the baked sample. However, the adequate composition of the mixture in order to achieve maximum porosity had still not been determined.
To further determine the ratio of mixing of raw composites in order to receive maximum porosity, 12 samples were prepared with varying quantities of corn starch, water and yeast, keeping the quantity of sawdust constant throughout the experiment.


84 85 MATERIAL DEVELOPMENT MATERIAL DEVELOPMENT BIO_BOT 2.0 BIO_BOT 2.0
Fig. 61. Material production matrix shows each step of material development from raw mixture
Fig. 62. To the baked porous wood sponge
SAMPLE 1
Sawdust - 20g
Corn starch - 10g
Water - 40ml
Yeast 4g
Sugar - 1g
Temperature - 230C
Decrease in weight percentage 42.85
EXPERIMENT 1 CORNSTARCH
Aim: To formulate the adequate ratio of corn starch required against fixed quantities of water sawdust, and yeast to achieve a high degree of porosity.

Objective: Activating surface of raw saw dust by heating the obtained composite mixture in the absence of oxygen in order to receive highly porous composite bio material.
Methodology: Four samples were prepared, with 20g sawdust, 40ml water, 5g yeast and 1g sugar and varied quantities of corn starch each as 10g, 20g, 30g, 40g correspondingly. Weights of these four samples were recorded before being heated further for surface activation. Post this, the prepared samples were heated at a temperature of 230C for 6 hours in an air drying furnace. The new weights of the baked samples were recorded. In order to test the degree of increase in porosity, the percentage decrease in the weight of each sample after heating was calculated.
Observation: It was observed that the sample 4 Figure 63, with 40g of corn starch in a mixture of 20g sawdust, 40ml water, 5g yeast and 1g sugar gained maximum porosity as approximately 50 percent decrease in the weight of the sample was observed after heating. Hence, it can be observed that 2 parts of corn starch against 1 part of sawdust gives the desirable porosity.
SAMPLE 1
Sawdust - 20g
Corn starch - 40g
Water 40ml
Yeast - 4g
Sugar 1g
Temperature - 230C
Decrease in weight percentage 50.76
SAMPLE 2
Sawdust - 20g
Corn starch - 20g
Water - 40ml
Yeast 4g
Sugar - 1g
Temperature - 230C
Decrease in weight percentage 46.66
SAMPLE 3
Sawdust - 20g
Corn starch - 30g
Water - 40ml
Yeast 4g
Sugar - 1g
Temperature - 230C
Decrease in weight percentage 49.09
SAMPLE 4
Sawdust - 20g
Corn starch - 40g
Water - 40ml
Yeast 4g
Sugar - 1g
Temperature - 230C
Decrease in weight percentage 50.76
SAMPLE 2
Sawdust - 20g
Corn starch - 40g
Water 60ml
Yeast - 4g
Sugar 1g
Temperature - 230C
Decrease in weight percentage 53.00
EXPERIMENT 2 WATER
SAMPLE 3
Sawdust - 20g
Corn starch - 40g
Water 80ml
Yeast - 4g
Sugar 1g
Temperature - 230C
Decrease in weight percentage 52.00
Aim: To formulate the adequate ratio of water required against fixed quantities of corn starch, sawdust and yeast to achieve a high degree of porosity. Objective: Activating surface of saw dust by heating the obtained composite mixture in the absence of oxygen in order to receive highly porous composite biomaterial.
SAMPLE 4
Sawdust - 20g

Corn starch - 40g
Water 100ml
Yeast - 4g
Sugar 1g
Temperature - 230C
Decrease in weight percentage 44.00
Methodology: After determining the favourable ratio of corn starch quantity required, further four samples were prepared, with 20g sawdust, 40g corn starch, 5g yeast and 1g sugar and the quantities of water were varied in each sample as 40ml, 60ml, 80ml, 100ml. Weights of these four samples were recorded before being heated further for surface activation. The samples were heated at 230C for 6 hours in an air-drying furnace. The new weights of the baked samples were recorded. In order to test the degree of increase in porosity, percentage decrease in the weight of each sample after heating was calculated.
Observation: Sample 2, Figure 64, with 60ml of water in a mixture of 20g sawdust, 40g corn starch, 5g yeast and 1g sugar gained maximum porosity as 55 % decrease in the weight of the sample was observed after heating. Hence, it can be observed that 3 parts of water against 1 part of sawdust and 2 parts of corn starch gives the desirable porosity.


86 87 MATERIAL DEVELOPMENT MATERIAL DEVELOPMENT BIO_BOT 2.0 BIO_BOT 2.0
Fig. 63. Plotting relationship between increase in porosity by varying cornstarch proportion in the sawdust biomaterial composite
Decrease in weight percentage
Corn starch to sawdust ratio
Fig. 64. Plotting relationship between increase in porosity vs varying proportions of water in the sawdust biomaterial composite.
Decrease in weight percentage
Water to sawdust ratio
SAMPLE 1
Sawdust - 20g
EXPERIMENT 3 YEAST
Aim: To formulate the adequate ratio of yeast required against fixed quantities of corn starch, sawdust, and water to achieve a high degree of porosity.


Objective: Activating surface of saw dust by heating the obtained composite mixture in the absence of oxygen in order to receive highly porous composite bio material.
Methodology: After determining the favourable ratio of quantity of corn starch and water required. Four samples were prepared, with 20g sawdust, 40g corn starch,60 ml water and yeast each. The quantity of yeast was varied in each sample as 5g, 7g, 9g, 11g. In order to test the degree of increase in porosity, the percentage decrease in the weight of each sample after heating was calculated.
Observation: Figure 65 observed that the sample 4 containing 11g yeast, 4g sugar in a mixture of 20g sawdust, 40g corn starch, and 60 ml water had undergone a decrease of 62% in its weight. However, the sample turned highly charred and brittle. Sample 2 with 7g yeast and 2g sugar gained optimum porosity as approximately 53% decrease in the weight of the sample was observed after heating, this sample was observed to maintain its structural qualities tested in further experiments. Hence, it can be observed that 3 parts of water, against 1 part of sawdust and 2 parts of corn starch and 0.35 parts of yeast gives the most desirable porosity out of all the samples.
SAMPLE 1
Cmposition ratio 1S, 2C, 4W, 0.2Y
Temperature - 205C
Final Volume(ml) - 75
Change in Volume % - 7.14
SAMPLE 2
Cmposition ratio 1S, 2C, 4W, 0.2Y
Temperature -220C
Final Volume(ml) - 80
Change in Volume % - 14.28
EXPERIMENT 4 TEMPERATURE
Aim : To determine the optimum heating temperature for the formulated biomaterial composite (1S 2C 3W 0.35Y) in the absence of oxygen to activate the surface of saw dust in order to receive favourable porosity.

Sugar 8g
Temperature - 230C
Decrease in weight percentage 43.52
SAMPLE 3
Cmposition ratio 1S, 2C, 4W, 0.2Y
Temperature - 235C
Final Volume(ml) - 85
Change in Volume % - 21.42
Objective: To determine the approximate crystallisation point of the formulated sample by heating at various temperatures.
Methodology: Four samples with a mixing ratio of 1S : 2C 3W : 0.4Y were prepared. Volumes of these samples were recorded before and after they were heated in the air drying furnace.
SAMPLE 4
Sawdust - 20g
Corn starch - 40g
Water 80ml
Yeast - 4g
Sugar 10g
Temperature - 230C
SAMPLE 4
Cmposition ratio 1S, 2C, 4W, 0.2Y


Temperature - 250C
Final Volume(ml) - 60
Change in Volume %- -14.28
Observation: Figure 66 observed that the volume of sample 1 had undergone an increase of approximately 7 percent in its volume after being heated to 205C, while sample 2 being heated to a temperature of 220C and sample 3 heated upto a temperature of 235C had undergone an increase of 14% and 21% in their volumes respectively. However sample 4, had undergone a drastic decrease in its volume by 14%, being heated up to 250C for a period of 6 hours. Hence, it can be determined that heating the formulated biomaterial sample to 250C, induces crystallisation in the composite. Crystallisation is the physical process of hardening during the formation and growth of crystals.
Sawdust, mainly composed of cellulose and sugar added for the activation process of yeast, contributes to rapid crystallisation of the biomaterial composite.


88 89 MATERIAL DEVELOPMENT MATERIAL DEVELOPMENT BIO_BOT 2.0 BIO_BOT 2.0
Water
Sugar
Temperature
Decrease in weight percentage 24.7
Corn
Water
Sugar 1g Temperature
Decrease in weight percentage 52.94
Corn starch - 40g
80ml Yeast - 4g
1g
- 230C
SAMPLE 2 Sawdust - 20g
starch - 40g
80ml Yeast - 6g
- 230C
Corn
Water 80ml Yeast
SAMPLE 3 Sawdust - 20g
starch - 40g
- 4g
Decrease in weight percentage 62.35
Fig. 65. Plotting relationship between increase in porosity vs varying proportions of yeast in the sawdust biomaterial composite.
Decrease in weight percentage
Yeast to sawdust ratio
Fig. 66. Material production matrix shows each step of material development from raw mixture until the baked porous wood sponge Percentage change in volume(ml)
Temperature(C)
Time for water retention(hrs)
EXPERIMENT 5 WATER RETENTION

Aim To establish a relationship between water retention capacity and time by testing the change in the volume of the samples, considering the sample will expand as it will absorb water over time.


Objective :To test the water retention capacity of the prepared biomaterial composite.
Methodology : Volumes of 4 samples were recorded after they were heated in the air-drying furnace. Each sample was submerged in 100ml water for 30 seconds. Sample 1 was let to sit for 1 hour, Sample 2 for 2 hours, Sample 3 for 3 hours, Sample 4 for 4 hours. Volumes of these samples were recorded at these times. Percentage increase in the volumes of each sample was recorded in order to formulate a relationship between time and water retention capacity.
Observation: A 37.5% increase in the volume of sample number 3 was observed, being rested for 3 hours of time in Figure 59. However, sample number 4, which rested for more than 3 hours, showed a significant decrease in the percentage volume from 37% to 6%.

Conclusion: It could be concluded from the above experiment that the sample of the formulated biomaterial composite (1S : 2C 3W : 0.4Y) has water retention capacity of 37% for a time of 3 hours. However, the accuracy of this experiment is subject to the humidity in the air, which can be highly variable if not tested in controlled environments.
CONCLUSION COMPOSITION
In the above experiments, quantities of corn starch, water and yeast were varied, keeping the quantity of saw dust constant in the raw mixture in order to create the most lightweight, porous composite. It could be observed that the most adequate ratio of mixing can be considered as (1S 2C : 3W 0.35Y) 1 part saw dust to 2 parts corn starch to 3 parts water to 0.35 parts yeast with a decrease percentage of 53% in the weight after being heated. Further, more samples were prepared keeping the mixing ratio constant in order to test the water retention capacity, permeability, structural strength and change in volume under varying time period and temperature conditions. According to the results of the water retention experiment, the sample of the biomaterial composite (1S: 2C: 3W: 0.4Y) has a 3 hour water retention capacity of 37%. The accuracy of this experiment is dependent on the air’s humidity, which might vary greatly if tested outside of a controlled atmosphere.
90 91 MATERIAL DEVELOPMENT MATERIAL DEVELOPMENT BIO_BOT 2.0 BIO_BOT 2.0 SAMPLE 1 Composition ratio 1S 2C 3W 0.4Y Time duration (hrs) 1 Initial Volume (ml) 80 Final Volume (ml) - 95 Change in Volume % - 18.75 SAMPLE 2 Composition ratio 1S 2C 3W 0.4Y Time duration (hrs) 2 Initial Volume (ml) 80 Final Volume (ml) - 100 Change in Volume % - 25 SAMPLE 3 Composition ratio 1S 2C 3W 0.4Y Time duration (hrs) 3 Initial Volume (ml) 80 Final Volume (ml) - 110 Change in Volume % - 37.5 SAMPLE 4 Composition ratio 1S 2C 3W 0.4Y Time duration (hrs) 4 Initial Volume (ml) 80 Final Volume (ml) - 85 Change in Volume % - 6.25
Fig. 67. Plotting relationship between percentage change in volume of sample vs gradual increase in the baking temperatures.
Percentage change in volume(ml)
STRUCTURAL STRENGTH

Mechanical properties and structural strength of materials are fundamentally characterised through the maximum tension, compression and shear stress they can withstand under various loading conditions.
A three point bending test can be conducted in order to test the same. The three point bending aids to determine the Modulus of Elasticity in bending, the stress and strain of the composite material. The test is conducted on a material sample of a predefined length (L) and, made to rest on end supports. The sample is subjected to point loading at its centre.118
The test produces tensile stresses along the convex side while compressive stresses are produced along the concave side of the sample, both calculated along the outermost fibre. The Young’s Modulus, also known as the Elastic Modulus, defines the relationship between the stress and strain of the material. The modulus of elasticity is a number that measures an object or substance’s resistance to being deformed elastically, which is calculated through physical experiments from the slope or angular coefficient of the stress- deflection curve.119
Fig. 68. Plotting graph displaying vertical displacements the sample 1 undergoes when subjected to gradual increase in load unless breaking point is reached Fig. 69. Plotting graph displaying vertical displacements the sample 2 undergoes when subjected to gradual increase in load unless breaking point is reached


It was observed in Figure 68 that Sample 1 with thickness 1 cm, weight 60 g, had undergone a vertical displacement of 5mm under the maximum point load of 2.3 kg.


Sample 2 in Figure 69 with thickness 2 cm, weight 85g had undergone a vertical displacement of 15 mm under the maximum point load of 7.13 kg.


92 93 MATERIAL DEVELOPMENT MATERIAL DEVELOPMENT BIO_BOT 2.0 BIO_BOT 2.0
3 POINT BENDING TEST
2 Sample N L (cm) B(cm) T(cm) 1 10 5 1 Weight of Sample(g) Breaking point weight(kg) Force (N) Vertical Displacement (mm) 60 2.33 22.834 5 Sample N L (cm) B(cm) T(cm) 2 10 5 2 Weight of Sample(g) Breaking point weight(kg) Force (N) Vertical Displacement (mm) 85 7.13 69.874 15
SAMPLE 1 SAMPLE
Vertical displacement (mm) Vertical displacement (mm) Load (N) Load (N)
Vertical displacement (mm)
SAMPLE 3
STRUCTURAL STRENGTH
3 POINT BENDING
Aim: The aim of this experiment was to test the structural strength of the developed composite biomaterial. A three point bending test was conducted for the same.
Objective: To determine the tensile stress and strain at the Yield point and the breaking point and the Elastic modulus (Young’s Modulus).120
Methodology: Four samples with length (L) = 10 cm, breadth (B) = 5cm,composition (1S:2C:3W:0.4Y), with varying thicknesses i.e. 1cm 2cm, 2.5cm, 3.5 cm were prepared. The weights of each sample were recorded as 60g, 85g, 140g, and 250g correspondingly. Each sample was rested on end supports. Point load (F) was gradually added at the centre point of each sample, the vertical displacement(d) caused in the sample by the same, was recorded simultaneously. Load was added until the sample reached the breaking point. The load reading at yield point and breaking point was also recorded. A mathematical graph to determine the relationship between ‘F’ vs ‘d’ was plotted for each sample. The F/d parameter is equal to the angular coefficient of the line tangent to the curve during its elastic deformation.121
Vertical displacement (mm)
Sample N L (cm) B(cm) T(cm)
3 10 5 2.5
Weight of Sample(g) Breaking point weight(kg)
Force (N) Vertical Displacement (mm) 140 15.13 148.274 8
Sample 3 of Figure 70 with thickness 2.5 cm, weight 140g had undergone a vertical displacement of 8 mm under the maximum point load of 7.13 kg.
SAMPLE 4
Fig. 70. Plotting graph displaying vertical displacements the sample 3 undergoes when subjected to gradual increase in load unless breaking point is reached Fig. 71. Plotting graph displaying vertical displacements the sample 4 undergoes when subjected to gradual increase in load unless breaking point is reached

Sample N L (cm) B(cm) T(cm)
4 10 5 3.5
Weight of Sample(g) Breaking point weight(kg)


Force (N) Vertical Displacement (mm)
250 18.13 177.674 9
Sample 4 with thickness 3.5 cm in Figure 71, weight 250g had undergone a vertical displacement of 9 mm under the maximum point load of


94 95 MATERIAL DEVELOPMENT MATERIAL DEVELOPMENT BIO_BOT 2.0 BIO_BOT 2.0
TEST
Load (N) Load (N)
STRUCTURAL STRENGTH

3 POINTS BENDING TEST
Conclusion: It can be concluded from the above experiment that the formulated biomaterial composite has considerable structural strength with its feasible physical application to be utilised as a cladding material panels. However, as the biomaterial composite has 1.2 times more the amount of tensile strength as compared to the plywood of the same length, breadth and thickness subjected to a three point bending test, in the similar setup, it can be considered for further more structural applications. But since the material displayed sponge behaviour induced due to porosity it is termed as “ Timber_sawdust Sponge” in the project.
Limitations
The above mentioned experiments were not performed in a mechanical lab, nor in environments with controlled humidity levels. Hence, there is a possibility of variation in results and observation otherwise.


96 97 MATERIAL DEVELOPMENT MATERIAL DEVELOPMENT BIO_BOT 2.0 BIO_BOT 2.0
Fig. 72. Overlaid graphs displaying vertical displacements of the all 4 samples
Fig. 73. Graph displaying relationship between thicknesses of samples vs maximum vertical displacements achieved under their breaking point loads.
Vertical displacement (mm)
Vertic Load (N) al displacement (mm) Load at breaking point (kg)
The thickness of the sample
ROBOTIC EXTRUSION INTRODUCTION
As previously outlined, the raw materials for the formulation of the biocomposite in order to achieve porosity were raw saw dust, corn starch, yeast, sugar and water, mixed in a slurry and baked further in the absence of oxygen to achieve a porous composite. However, it was discovered further that the raw materials have a dynamic behaviour when the mixture is prepared under different temperature conditions. The raw mixture of cornstarch and water when heated at medium heat (100-150C), stirred constantly for a few minutes turns into a viscous mixture with the consistency of a resin; it was hypothesised that a bioresin mixture ideal for extrusion can be prepared from sawdust and cornstarch resin. Extrusion of the saw dust resin mixture using the robotic end effector would aid the fabrication of non-porous, continuous and complex morphology. Hence, saw dust resin samples were prepared in order to conduct physical tests. Additional agents, vinegar and glycerine, were added to increase the longevity of the prepared mixture of bioresin. Large cellulose molecules, such as starch, are long chain polymers. In this experiment, two ingredients change the properties of the polymer bioresin. The glycerin acts as a plasticizer which “lubricates” the plastic mixture. For the mixture to be more pliable, more glycerin is added, less glycerin is added to have less viscous mixture. Longevity of composite resins restoration can be affected by surface hardness restoration using glycerin.122

98 99 MATERIAL DEVELOPMENT MATERIAL DEVELOPMENT BIO_BOT 2.0 BIO_BOT 2.0
Layer 1 Height : 4mm
Methodology End Effector Extrusion
Nozzle size 3mm diameter
Air Pressure 0.35 Mpa
Mixture Composition
Sawdust - 1 Part; Cornstarch - 2 Parts; Water 3 Parts; Glycerine 0.2 Parts; Vinegar 0.1 Parts
EXPERIMENT 1
Layer 4 Height : 15mm
Methodology End Effector Extrusion
Nozzle size 3mm diameter
Air Pressure 0.35 Mpa
Mixture Composition
Sawdust - 1 Part; Cornstarch - 2 Parts; Water 3 Parts; Glycerine 0.2 Parts; Vinegar 0.1 Parts
Aim: To physically fabricate continuous complex morphology through the robotic arm extrusion technique


Objective: To determine adequate mixture consistency, air pressure and nozzle size for extrusion of mixture using robotic end effector.

Methodology: Raw resin samples for extrusion were prepared from saw dust, cornstarch, water and vinegar (S:C:W:G:V). Sample numbers 1 to 6 were prepared in the ratio of 1S 2C 3W 0.2G: 0.1V , sample numbers 7 to 12 were prepared in the ratio of 2S : 1C 3W 0.2 G: 0.1 V. This mixture was further used for extrusion using a nozzle of diameter of 3, 4 and 5mm each. Different morphologies were tested for extrusions. The pressure for extrusion was determined during the execution of the extrusion tests. The extruded morphologies were let to be air dried for 3 days.
Layer 8 Height : 14mm
Methodology End Effector Extrusion
Nozzle size 3mm diameter
Air Pressure 0.35 Mpa
Mixture Composition
Sawdust - 1 Part; Cornstarch - 2 Parts; Water 3 Parts; Glycerine 0.2 Parts; Vinegar 0.1 Parts


Layer 1 Height 4mm
Methodology End Effector Extrusion
Nozzle size 3mm diameter
Air Pressure 0.35 Mpa
Mixture Composition
Sawdust 2 Parts; Cornstarch 1 Part; Water 3 Parts
Glycerine - 0.2 Parts; Vinegar - 0.1 Parts
Layer 4 Height 16mm
Methodology End Effector Extrusion
Nozzle size 3mm diameter
Air Pressure 0.35 Mpa
Mixture Composition
Sawdust 2 Parts; Cornstarch 1 Part; Water 3 Parts
Glycerine - 0.2 Parts; Vinegar - 0.1 Parts
Observation: The air pressure utilised for the extrusion was 0.35 Mpa. The suitable nozzle diameter was 3mm, as nozzles bigger than this diameter allowed more material to accumulate under regular pressure while extrusion leading to lesser viscosity. Certain observations could be made after the samples were air dried. Samples 1 to 3 were observed to be less voluminous, as the layers collapsed during extrusion, displaying considerably less viscosity. Samples 4 to 6 better retained their volumes as compared to samples 1 to 3, the layers retained the height displaying considerably higher viscosity. However, shear cracks were observed in these samples.
Layer 8 Height 30mm
Methodology End Effector Extrusion

Nozzle size 3mm diameter
Air Pressure 0.35 Mpa
Mixture Composition
Sawdust 2 Parts; Cornstarch 1 Part; Water 3 Parts
Glycerine - 0.2 Parts; Vinegar - 0.1 Parts
Conclusion: The raw mixture of samples 4 to 6 with composition ratio of 2S : 1C 3W : 0.2 G: 0.1 V had higher viscosity. Hence, it can be concluded that the air dried samples retained their forms.
100 101 MATERIAL DEVELOPMENT MATERIAL DEVELOPMENT BIO_BOT 2.0 BIO_BOT 2.0
Fig. 74. Robotic extrusion. Experiment 1
EXPERIMENT 2
The aim of extruding morphologies from the raw sawdust resin mixture using robotic end effector was to achieve long continuous complex morphologies while determining the geometric constraints concerning shear crack points. Therefore, determining the longest length that can be allowed to be extruded with minimal shear cracks was extremely crucial. In order to avoid shear cracks it was hypothesised that the higher the length to absolute length ratio, lesser will be the formation of shear cracks along the length of the extruded morphology.
Aim: To physically fabricate continuous complex morphology through the robotic arm extrusion technique
Objective: To determine geometric constraints for extrusion of raw saw dust resin mixture using robotic end effector.
SAMPLE 1
Length : 15 cm
Breadth : 1 cm

Height 2 cm
SAMPLE 2
Length : 18 cm
Breadth : 2 cm
Height 3 cm
SAMPLE 3
Length 18 cm
Breadth 3 cm
Height 4 cm
SAMPLE 4
Length 20 cm
Breadth 3 cm
Height 6 cm
SAMPLE 5
Absolute Length (lo) : 15 cm

Length (l) : 17cm

l/lo = 1.14
Breadth : 2 cm
Height : 3 cm
SAMPLE 6
Absolute length (lo) 18 cm
Length (l) : 21 cm
l/lo = 1.17
Breadth : 2 cm
Height : 3 cm
SAMPLE 7
Absolute length (lo): 18 cm
Length (l) 24 cm
l/lo = 1.4
Breadth 3 cm
Height 4 cm
Methodology: Raw saw dust resin mixture with raw material composition ratio being 2S 2C 3W : 0.2 G: 0.1 V was prepared for extrusion. Rectilinear geometric morphologies with varying length to breadth to ratios were created as represented in sample numbers 1 to 4 and where as in sample numbers 5 to 8 total perimeter of the length was increased by adding manifolds in the geometry to compare the phenomenon of shear cracking between the two sets of samples. All the samples were let to air dry for 3 days and observed for further insights.
SAMPLE 8
Absolute length (lo) 20 cm
Length (l) 28 cm
l/lo = 1.4
Breadth 3 cm


Height 4 cm
Observation: It was observed that sample numbers 1 to 4 had shear cracks at l/2, l/4. l/8. However sample numbers 5 to 8 with l/lo ratio being greater than 1 had considerably less number of shear cracks.
Conclusion: It can be concluded that morphologies with manifolds that are with higher length to absolute length ratio, had lesser or almost no shear cracks as compared to rectilinear morphologies. Hence, the extrusions for final morphological fabrication could be tested for further implementation.


102 103 MATERIAL DEVELOPMENT MATERIAL DEVELOPMENT BIO_BOT 2.0 BIO_BOT 2.0
Fig. 75. Robotic
Experiment 2
extrusion.
ENDNOTES
114. Junying Metal Manufacturing Co., Limited, “CNC Milling Guide – CNC Milling Advantages & Disadvantages, Application, Materials and Definition,” n.d., https://www.cnclathing.com/guide/ cnc-milling-guide-cnc-milling-advantages-disadvantages-application-materials-and-definition.
115. Susanna Laurén and Biolin Scientific, “Surface and Interfacial Tension,” n.d., 8.
116. Hazimah Madzaki et al., “Carbon Dioxide Adsorption on Sawdust Biochar,” Procedia Engineering 148 (2016): 718–25, https://doi.org/10.1016/j.proeng.2016.06.591.
117. Hebel and Heisel, Cultivated Building Materials.
118. Wark Barry, “Bioplastic Tectonic,” 2021, https://www.barrywark.com/bioplastic.
119. Wark Barry, “Bioplastic Tectonic,” 2021, https://www.barrywark.com/bioplastic
120. Wark Barry, “Bioplastic Tectonic,” 2021, https://www.barrywark.com/bioplastic
121. Wark Barry, “Bioplastic Tectonic,” 2021, https://www.barrywark.com/bioplastic
122. Ferriza Tri Mardianti, Sukaton Sukaton, and Galih Sampoerno, “Benefit of Glycerine on Surface Hardness of Hybrid & Nanofill Resin Composite,” Conservative Dentistry Journal 11, no. 1 (June 30, 2021): 28, https://doi.org/10.20473/cdj.v11i1.2021.28-31.
123. something here to get trimmed
124. Junying Metal Manufacturing Co., Limited, “CNC Milling Guide – CNC Milling Advantages & Disadvantages, Application, Materials and Definition,” n.d., https://www.cnclathing.com/guide/ cnc-milling-guide-cnc-milling-advantages-disadvantages-application-materials-and-definition.
125. Susanna Laurén and Biolin Scientific, “Surface and Interfacial Tension,” n.d., 8.
126. Hazimah Madzaki et al., “Carbon Dioxide Adsorption on Sawdust Biochar,” Procedia Engineering 148 (2016): 718–25, https://doi.org/10.1016/j.proeng.2016.06.591.
127. Hebel and Heisel, Cultivated Building Materials.
128. Wark Barry, “Bioplastic Tectonic,” 2021, https://www.barrywark.com/bioplastic.
129. Wark Barry, “Bioplastic Tectonic,” 2021, https://www.barrywark.com/bioplastic
130. Wark Barry, “Bioplastic Tectonic,” 2021, https://www.barrywark.com/bioplastic
131. Wark Barry, “Bioplastic Tectonic,” 2021, https://www.barrywark.com/bioplastic
132. Ferriza Tri Mardianti, Sukaton Sukaton, and Galih Sampoerno, “Benefit of Glycerine on Surface Hardness of Hybrid & Nanofill Resin Composite,” Conservative Dentistry Journal 11, no. 1 (June 30, 2021): 28, https://doi.org/10.20473/cdj.v11i1.2021.28-31.
104 105 DOMAIN CHAPTER DOMAIN CHAPTER BIO_BOT 2.0 BIO_BOT 2.0
MORPHOLOGICAL DEVELOPMENT

106 107 CONCLUSION CONCLUSION BIO_BOT 2.0 BIO_BOT 2.0
OVERVIEW

The development of the individual modules intricately addresses the problems outlined in the domain chapter while having the versatility to adapt to different site-specific scenarios as an architectural assembly. According to the research compiled, the selected area has a number of problems directly connected to the fragmentation of the natural landscapes: increased temperature and pollution levels subsequently impacting the level of the heat island effect, energy crisis associated with a densely populated and occupied area and lack of viable green tissue.
Therefore, the developed system must address filtration of the polluted air, as well as identifying a strategy for its thermoregulation. Simultaneously, the proposed solution must support the natural ecosystems by providing enough greenery to create a continuous network. Moreover, its modularity must be related to the scale of the interstitial space. For this reason, it should support itself with resources and be adaptive to the fast-changing environments. The suitability of the proposal to regulate these environmental fluxes, continuity of green tissue, purification of existing urban space and regeneration of continuous habitat will allow for the first cycle of repair energy generation to occur in order to mitigate these problems before the second cycle of regeneration occurs which will prove its viability long term.
This is summarised in the material development for the module. The assembly of the material system developed is henceforth devised as design solutions to be categorised under four performative functions intervening at the most high risk nodes that is production, collection, filtration and habitation. It is through these four categories that a gradient of change between Architectural functions corresponding to the four categories can be designed for the performance of the assembled system. Their hybridisation can be understood by the shared performance of their threshold functions.
108 109 CONCLUSION CONCLUSION BIO_BOT 2.0 BIO_BOT 2.0
FUNCTIONAL DESIGN OBJECTIVES
As a primary function , green tissue production and continuity is a constant design driver shared between all the thresholds of functional categories adding to the ample production of oxygen. Furthermore, production as a function serves a two-fold purpose; it is the generation of biofuel energy and voltaic system needed to support the urban space as well as the bio-bots
Collection as a function maintains the system of all the bio-bots by harvesting rain, grey water and runoff. It purifies it before recirculating it either back into the required bio-bots or into the urban interstice.
Filtration as a function acts as a catch-all for all environmental particles: dust and soot particles from emissions zones, filtration of light as membrane and noise as reverberation and sieving of pollen particles.
Protection as a function provides a membrane for green vegetation for the proliferation of continuous tissue and endangered flora. Within the habitation function of the bio-bot, its development facilitates fauna interaction through either shelter or ecological services.
The ecological machines termed as the biobots are designed in order to achieve the above mentioned functionalities.
110 111 CONCLUSION CONCLUSION BIO_BOT 2.0 BIO_BOT 2.0
STRUCTURE
Each module shares the same structure- the permutohedron of order 4, or truncated octahedron. The space-packing truncated octahedron has been chosen due to the fact that it is comprised of 6 squares and 8 ditrigons. This allows certain restrictions in the way that the octahedron can come together. The hierarchical organisation of quadrilaterals to ditrigons suggests that there are primary and secondary connections via the number of edges for each shape. In this way, the bio-bot structure is circumscribed into a truncated octahedron which incorporates those predefined module connection rules. Furthermore, the voids left by creating face to face connections for the octahedron allows the space necessary for the rotational matrices of an object and vector in both Euclidean space and its larger non-collisional aggregation. The chosen structure is informed by the ability of the component to attach to another within a regular grid, thus providing more structural strength. At the same time, the size of the modules is defined by the ability of humans to influence the structure; providing new modules without the usage of heavy equflipment- fitting within a 1 metre by 1 metre bounding geometry. Therefore, it gives the opportunity to simplistically grow the population of components in order to adapt to fast-changing environmental condi-


VECTOR ABSTRACTION
tions. The structure is created by connecting the central point of the truncated octahedron to the central points of hexagonal surfaces, which define the angle for connection as 109°. The structure’s central area is a sphere that contains the electronic part of the system, which is responsible for the performance of the component. The connection arms have a cylindrical shape to allow the kinetic rotation of the system. The upper and bottom half of the sphere can be unbolted and disassembled into two pieces in order to outfit with the appropriate internal hardware; the sleeve cap joint is a facilitator of the kit-of-parts solution.

It leaves the cetral node of the geometry hollow in which the ‘brain’ of the bio-bot is housed. This allows for the interchangeability of hardware needed for the performance of different functions.


112 113 CONCLUSION CONCLUSION BIO_BOT 2.0 BIO_BOT 2.0
Fig. 76. Structure is fitted into the permutohedron of order 4 or truncated octahedron with 90 X 85 cm global dimensions
Fig. 77 .Diagrams show the relationships between permutohedron of order 4 and inner structure as well as module to module connection
GOAL GENERATE A MORPHOLOGICAL VARIATION OF THE COMPONENT IN CONSIDERATION FOR THE LOCAL ENVIRONMENTAL CONDITIONS

OBJECTIVES OPTIMISE THE MORPHOLOGY TO FACILITATE GREEN TISSUE GROWTH


FITNESS CRITERIA FITNESS CRITERIA 1; EQUALISE SUN EXPOSURE FITNESS CRITERIA 2; MAXIMISE NUMBER OF PLANT POCKETS FITNESS CRITERIA 3; MAXIMISE SURFACE AREA OF PLANT POCKET BED


PHENOTYPE GENERATED USING DIFFERENTIAL GROWTH ALGORITHM
GENEPOOL POSITION,OF POINT TO GENERATE POLYLINES FOR GROWTH, NUMBER OF POLYLINES, EXTRUSION DEPTH
The flora_bot addresses the concern of fragmentation of green cover, facilitating growth for both vernacular plants as well as protected. The design objective for the morphological development was to generate continuous timber resin morphology for water circulation, while creating crevices to hold plants on its locations creating an ecosystem for their root system. The line based model differential growth algorithm was utilised in order to receive continuous manifold morphology.

COMPUTATIONAL LOGIC
The experiment’s goal was to create continuous morphologies with maximised surface area and minimal folds or crevices for plantation.For this goal, the following fitness criterias were established: fitness criteria 1 (FC1)– maximises the length of generated polylines; fitness criteria 2 (FC2)– Creating equalised regions of light and shade by minimising the ratio between points( on morphology )subject to high sun vector hits vs low sun vector hits.The taxonomy of plants selected to be facilitated for growth defines the primitive morphology requirements; fitness criteria 3 (FC3)– maximise the surface area of the planter bed. Each of these objectives is related to the morphological changes induced transformations termed as the “genetic code” (or genome).
The following morphological alterations are addressed by the number of genes or genome: the base surface for points generation is subdivided, wherein the number of subdivisions can vary. This variation directly impacts how many complete closed loops “pots’’ can be generated. Each subdivision is divided into four sections, with each subdivision serving as a field for generating a starting point. These spots are then joined to form polylines as a base for a line-based model of differential growth algorithm (DGA). The next step was the simulation of DGA by varying radii for the collision of points. The final step is the extrusion length, which helps to achieve different levels of sun exposure.

114 115 CONCLUSION CONCLUSION BIO_BOT 2.0 BIO_BOT 2.0
1. Offset of the core surface
3. Differential Growth of the polyline using point collision algorithm
5. Rulled surface 6. Surface offset
2. Generation of the points on the surface. Creation of polylines from previously generated points
4. Offset of the generated polylines on different distances
FLORA_BOT
Fig. 78. Computational logic of the Flora_bot
EVOLUTIONARY OPTIMISATION
After the evolutionary optimisation it was observed that a high number of morphologies generated displaying a significant height difference, was influenced by the gene that induced depth of the fold crucial for plant maturation.


The result of the algorithm produced 1000 phenotype solutions with three fitness values per solution, totalling 3000 values. Although the simulation performed well towards optimisation of the solutions, it produced a significant number of variations struggling to optimise towards Fitness criteria 1. From the Pareto Front solutions, it can be observed that the simulation produced a high number of individuals with repeated values which decreased the variation within produced phenotypes. The high level of visual geometrical variation was observed only in the simulation’s early stages, which rapidly converged into optimised values due to the low number of genes informing the morphological alterations.


EVOLUTIONARY OPTIMISATION

The visual analysis of the Pareto Front solutions shows that there are a limited number of phenotypes with intersecting geometries, which can be considered as a sign of a successful simulation.


Refer to Appendix Section A for Flora_bot optimisation details.
OPTIMISED INDIVIDUAL
The optimised individual 19 from G47 was obtained displaying better performance for FC1 that is equalised sun exposure and FC3 that is increased surface area for plant bed, consisting of 5 loops of manifold morphologies with a high variation in their height, to be utilised as plant pockets.
116 117 CONCLUSION CONCLUSION BIO_BOT 2.0 BIO_BOT 2.0
Fitness criteria 1; Equilise sun exposure Fitness criteria 2; Maximise the number of pockets Fitness criteria 3; Maximise surface of the planter
Fig. 79. The average solution for all fitness criteria with a rank of zero The red dots and curves show the selected solution in the entire simulation. It shows how successfully or unsuccessfully simulation optimised this solution for the three fitness objectives.
FLORA_BOT
The detailing of the module surrounding the milled timber structure needs to prioritise a lightweight assembly given the amount of living tissue, in this case plants to purify and oxygenate, suspended within. Beginning from the central nodal sphere which houses sensors in order to identify solar exposure, milled timber pipe, or arms, extend outward towards the quadrilateral faces of the octahedron. The arms are connected directly to a motor server which provides allowable rotation of the module to respond to solar conditions. Connected additionally to the sensors is a pod for collected rain water and dispensers which pass through the central sphere and out through to distribute the water and humidity directly into the module. Atop the central sphere is a waterproofing layer to protect the inner mechanics of the production protection machinery.
The extruded sawdust layer utilises the layered folds of the differential growth algorithm in order to create the voided pockets for the suspended plants. The plants, which are identified at a localised condition
FLORA_BOT


(whether the area has a higher requirement for oxygenation, CO2 absorption, or extraction of chemical pollutants) based on the taxonomised plants outlined before. The pockets are lined with a thin fabric substrate to prevent any decay of material to transfer between layers. The cavities of the pockets themselves are filled with lightweight porous clay pebbles which provide a suitable condition for plants to root. Furthermore, to prevent any living tissue from being dislodged from the module due to any rotations which may incur, a woven organic netting is attached and spans the openings of the extruded sawdust. The size of holes of the netting may be varied in order to ensure that the plants selected for the module will not have a stem larger than can fit through the opening. Water can be easily dispersed between the clay pebbles to reach the roots of each plant.
Humidity levels are controlled via sensor to ensure that the module can thrive in the absence of human interaction. The structural capacity of the module will not be exceeded by the weight of plants to
118 119 CONCLUSION CONCLUSION BIO_BOT 2.0 BIO_BOT 2.0
Fig. 80. Flora_bot module development expected in a 6 - 12 month period
Fig. 81. Flora_bot module development expected in a 12 - 24 month period
FLORA_BOT


complete their annual, perennial, or evergreen life cycles. As a precaution, the mister which attaches via bottom face of the module ensures that the microclimate of the module is consistently monitored and can be utilised to regulate the larger thermo climate of a larger combination of protection production modules in the urban environment during temperature fluxes.
PLANTS TAXONOMY
The quantification of the plant selection can be carefully selected via plant taxonomy in Figure 84. The identification of non-native, neophyte and vernacular plants alongside information on their conservation status can identify the need for implementation. They are assessed according to life cycle: annual, perennial, biennial and evergreen status in order to ensure that the Bio-bot can be landscaped to provide continual oxygenation, shading, and seasonality to constitute the green connective tissue. Furthermore, by identifying a mature scale of growth and spread it is possible to begin grouping flora species that will not compete with each other in the predetermined pocket sizes. Varying species require different exposure to direct versus indirect solar exposure as well as watering cycles. This creates a vertical hierarchy within the component itself, as well as the vertical distribution (solar exposure) in an assembly of production protection modules. Identification of locations where the species can be grown will further determine which species are more beneficial in worst-case versus best-case scenarios for pollution extraction. Additionally, three major groups of species have recategorised according to the logic of the modules:
120 121 CONCLUSION CONCLUSION BIO_BOT 2.0 BIO_BOT 2.0
Fig. 82. Flora_bot module structure without plants
STRUCTURE EXTRUDED SAWDUST POROUS CLAY PEBBLES WATER DISPERSION WOVEN NETTING MICROCLIMATE MIST
Fig. 83. Flora_bot module section shows the essential details of the morphology
TIMBER SPONGE MORPHOLOGY_ DIFFERENTIAL GROWTH SIMULATION


The timber sponge morphology was developed as a common component in the rest of the biobots to support the growth of moss as living tissue to maintain green continuity. Furthermore, to utilise moss voltaic generation in order to produce electricity charging points in a defunc urban intersitice as public space intervention. The differential growth most closely resembles the biological growth of the living tissue. This becomes the design impetus for the morphology design of moss supporting timber_sponge panels as a major component of bio-bot modules. As the timber sponge can be moulded into any form, the morphology was generated on the digital medium using the Kangaroo physics and Anemone plugin for Grasshopper as an engine for Differential growth simulation. Morphologies with varying geometrical parameters were generated and post analysis was conducted to identify most suitable output, to avoid computational lag encountered in the simultaneous optimisation process. The differential growth generation logic is based on the point collisions, therefore, the size of the grid or mesh, collision radius and number of iteration all have a direct impact on the growth algorithm and its results which produced 21 individuals that were measured towards sun exposure, self shading, volume and surface growth areas as post analysis. Design goals to achieve best output were considered as high sun exposure, high self shading, high surface area to Volume ratio, for heat dissipation and facilitation of moss growth.The parameters of sample 19 were considered best performing, as the sample has the highest shadow area, considering relatively low parameters of surface and volume growth. Therefore these values were implemented in the further development stages.

Volume Surface


Sun exposure
Shadow area
[fo] - from original surface
Collision radius
Number of iterations
Size of the grid
Volume growth [fo]
Surface growth [fo]
Sun exposure
Shadow area
Collision radius
Number of iterations
Size of the grid
Volume growth [fo]
Surface growth [fo]
Sun exposure
Shadow area
Collision radius
Number of iterations
Size of the grid
Volume growth [fo]
Surface growth [fo]
Sun exposure
Shadow area
Collision radius


Number of iterations
Size of the grid
Volume growth [fo]
Surface growth [fo]
Sun exposure
Shadow area
124 125 CONCLUSION CONCLUSION BIO_BOT 2.0 BIO_BOT 2.0
Fig. 85. The exploded diagram of layers of the differential growth living tissue structure
1 10 7.5 0.9 m3 m2 % % 1 10 7.5 90 86 78 22 1 15 7.5 100 110 71 29 1 20 7.5 120 160 35 65 1.5 10 7.5 100 120 35 65 cm cm % % % % cm cm % % % % cm cm % % % % cm cm % % % % ORIGINAL SURFACE TYPE 1 TYPE 2 TYPE 3 TYPE 4
Collision radius
Number of iterations
Size of the grid
Volume growth [fo]
Surface growth [fo]
Sun exposure
Shadow area
ORIGINAL SURFACE

Collision radius
Number of iterations
Size of the grid
Volume growth [fo]
Surface growth [fo]
Sun exposure
Shadow area
Collision radius
Number of iterations
Size of the grid
Volume growth [fo]
Surface growth [fo] Sun exposure Shadow area
Collision radius
Number of iterations
Size of the grid
Volume growth [fo]
Surface growth [fo]

Sun exposure
Shadow area
Collision radius
Number of iterations
Size of the grid
Collision radius
Number of iterations
Size of the grid
Volume growth [fo]
Surface growth [fo] Sun exposure Shadow area
Collision radius
Number of iterations
Size
Collision radius


Number of iterations Size of the grid
Volume growth [fo] Surface growth [fo]


126 127 CONCLUSION CONCLUSION BIO_BOT 2.0 BIO_BOT 2.0
Sun
Shadow area 1.5 20 7.5 180 300 50 50 1.5 15 7.5 130 170 45 55 2 10 7.5 130 170 50 50 2 15 7.5 180 270 49 51 2 20 7.5 280 510 58 42 cm cm % % % % cm cm % % % % cm cm % % % % cm cm % % % % cm cm % % % % TYPE
TYPE 6 TYPE 7 TYPE 8 TYPE 9 Volume Surface Sun exposure Shadow area [fo] -
face
exposure
5
from original sur-
Volume growth [fo] Surface growth [fo] Sun exposure Shadow area
of the grid Volume growth [fo] Surface growth [fo] Sun exposure Shadow area
[fo]
[fo] Sun exposure Shadow area 1 10 7.5 0.9 m3 m2 % % 1 10 5 1 1.1 43 57 1 15 5 1.3 1.7 38 62 1 20 5 1.5 3.2 41 59 1.5 10 5 1.4 2 45 55 cm cm % % % % cm cm % % % % cm cm % % % % cm cm % % % %
Collision radius Number of iterations Size of the grid Volume growth
Surface growth
TYPE 10 TYPE 11
TYPE 13
TYPE 12
Collision radius
Number of iterations
Size of the grid
Volume growth [fo]
Surface growth [fo]
Sun exposure
Shadow area
ORIGINAL SURFACE
Collision radius
Number of iterations
Size of the grid
Volume growth [fo]
Surface growth [fo]
Sun exposure
Shadow area
Collision radius
Number of iterations
Collision radius
Number of iterations
Size of the grid
Volume growth [fo]
Surface growth [fo]
Sun exposure
Shadow area
Collision radius
Number of iterations
Size

Collision radius
Number of iterations
Size of the grid
Volume growth [fo]
Surface growth [fo] Sun exposure
Collision radius Number of iterations
Collision radius


Number of iterations
Size of the grid
Volume growth [fo] Surface growth [fo]
The differential growth living tissue structure was optimised by calculating the difference in volume and surface growth to the original structure. Moreover the ratio between shaded and exposed to sun surfaces. The simulation helped reveal the best-performing values implemented into the development of the morphologies. The parameters of sample 19 were considered best performing, as the sample has the highest shadow area, considering relatively low parameters of surface and volume growth. Therefore these values were implemented in the further development stages.


128 129 CONCLUSION CONCLUSION BIO_BOT 2.0 BIO_BOT 2.0
Shadow area
Sun
Shadow area 1.5 20 5 2.4 6.6 55 45 1.5 15 5 1.8 3.4 50 50 2 10 5 2.1 3.2 45 55 2 15 5 2.8 5.7 38 62 2 20 5 4 11 35 65 cm cm % % % % cm cm % % % % cm cm % % % % cm cm % % % % cm cm % % % % TYPE 14 TYPE 15 TYPE 16 TYPE 17 TYPE 18 Volume Surface Sun exposure Shadow area [fo] - from original surface
exposure
Size of the grid Volume growth [fo] Surface growth [fo] Sun exposure Shadow area
Shadow
of the grid Volume growth [fo] Surface growth [fo] Sun exposure
area
Volume
Surface
Sun exposure Shadow area 1 10 7.5 0.9 m3 m2 % % 1 10 3 1.5 2.4 39 61 1.5 10 3 2.2 4.7 51 49 2 10 3 3.4 8 62 38 cm cm % % % % cm cm % % % % cm cm % % % %
Size of the grid
growth [fo]
growth [fo]
TYPE 19 TYPE 20 TYPE 21
GOAL GENERATE A MORPHOLOGICAL VARIATION OF THE COMPONENT TO MAXIMISE SOLAR EXPOSURE


OBJECTIVES OPTIMISE THE MORPHOLOGY OF THE ALGA_TERRA_BOT FUNCTION


FITNESS CRITERIA FITNESS CRITERIA 1; RATIO MAXIMISE VOLUME MINIMISE SURFACE FITNESS CRITERIA 2; MAXIMISE SHADOW ON THE LIVING TISSUE STRUCTURE FITNESS CRITERIA 3; MAXIMISE SUN EXPOSURE FOR ALGAE STRUCTURE


PHENOTYPE GENERATED USING DIFFERENTIAL GROWTH ALGORITHM
GENEPOOL POSITION,OF POINT TO GENERATE POLYLINES FOR GROWTH, NUMBER OF POLYLINES, EXTRUSION DEPTH
The Alga_bots are designed to be composed of morphologies for algae containment and timber sponge to facilitate the growth of moss. The algae as a component living material is utilised to induce the absorption of carbon dioxide from the atmosphere and produce oxygen in return, aiding the reduction of greenhouse carbon emissions. As an architectural implementation alga_bots populate in regions with high carbon dioxide content and sun exposure to provide shade, simultaneously utilised for the production of biofuel from algal oil to power urban space.
COMPUTATIONAL LOGIC
Maximising sun exposure to algae components for photosynthesis and shaded regions for timber sponge component to create microclimate for moss were main design goals. For this goal, the following fitness criterias were established: fitness criteria 1 (FC1)– maximises the volume of pipes for algae, minimises their length; fitness criteria 2 (FC2)– maximises sun exposure for algae; fitness criteria 3 (FC3)– maximises the shadow occlusion on the moss surface. The optimisation of surface differential growth that provides valleys for moss distribution was conducted separately, due to the limitation of the computational capacity. Each of these objectives relates to the morphological changes used to devise the form for Alga_bot; these transformations are known as the “genetic code” (or genome). The morphological alterations are addressed by the number of genes or genome: the baselines for pipe attachment are divided into points, where the number of points and distance between them can vary. The offset size for the base surface for differential growth simulation is implemented as a gene influencing the self-shading of the structure. The final step is the generation of pipe for created polylines- guides, where the diameter of the pipe is a gene.
130 131 CONCLUSION CONCLUSION BIO_BOT 2.0 BIO_BOT 2.0
1. Creation of rectangles along structure pipes
3. Generation of olyline through these points. Multipipe
5. Creation of a surface through generated lines 6. Differential growth of the surface structure
2. Extraction of needed points and their rearrangement in data list
4. Generation of base lines for living tissue structure surface
ALGA_TERRA_BOT
Fig. 86 Computational logic of the Alga_Terra_bot
EVOLUTIONARY OPTIMISATION
Fitness criteria 1 (FC1) was measured as a ratio between the volume of algal tubes and their length. The intention was to increase the volume while decreasing the length of the pipes for material economy. The FC2 was measured as maximum points subject to self shading. In this simulation, as only the algae pipe morphology was part of the optimisation, the differential growth for the timber sponge was optimised separately. Finally, the FC3 was to increase the number of points exposed to direct sunlight located on the algal pipes’ surface. This step was necessary for algae’s high-performance rate.

EVOLUTIONARY OPTIMISATION


Refer to Appendix Section B for Alga_Terra_bot optimisation details.


OPTIMISED INDIVIDUAL
The result of the algorithm produced 1000 phenotype solutions with three fitness values per solution, totalling 3000 values. The average solution for all fitness criteria with a rank of zero was chosen as generation 26 individual 7 (G26I7) was chosen for further development of the Alga_bot module.

132 133 CONCLUSION CONCLUSION BIO_BOT 2.0 BIO_BOT 2.0
Fitness criteria 1; Ratio | Maximise volume Minimise surface Fitness criteria 2; Maximise shadow on the living tissue structure Fitness criteria 3; Maximise sun exposure for algae structure
Fig. 87. The average solution for all fitness criteria with a rank of zero The red dots and curves show the selected solution in the entire simulation. It shows how successfully or unsuccessfully simulation optimised this solution for the three fitness objectives.
ALGA_TERRA_BOT
The Alga_Terra_bot is similarly organised around the central sphere which houses the sensors, motors and hardware in order to avoid exposing it to the outside elements. The module is structured to maximise the surface area of both the algal pipes which need exposure to sunlight for photosynthesis as well as the moss which is grown in the valleys of the corrugated sawdust morphology. This module has both a pod for the collection of the algae biomass as well as a pump to constantly circulate the algal fluid within the pipes. The pipes are fixed to one another using clips to ensure their position when rotation occurs to self-regulate consistent shadowing for the living tissue which in this case is moss grown on sawdust morphology. The moss has access to the water pump via the collection module attachment to ensure even and consistent distribution. The CO2 sensor ensures that algae is harvested at optimal condition. The connection between one filtration production module to another allows for a network connection

module structure

ALGA_TERRA_BOT
between the collection pods between modules which allow them to be re-drained or filled simultaneously. In this way, maximum volume of algae gel can be stored and circulated between the same filtration production components or en masse to facilitate human intervention or care-taking of the bio-bot.
134 135 CONCLUSION CONCLUSION BIO_BOT 2.0 BIO_BOT 2.0
Fig. 88. Alga_Terra_bot
STRUCTURE ALGAE PIPES COLLECTION PUMP LIVING MOSS O2 CIRCULATION CO2 SENSOR
Fig. 89. Alga_Terra_bot module section shows the essential details of the morphology
The Alga_bot module is similarly structured to maximise the surface area of both the algal pipes which need exposure to sunlight for photosynthesis; without the addition of moss as a living tissue. In this case, the algae as bio-fuel single function is being highlighted. This is in order to ensure that the maximum volume of algae can be processed in for the bio-fuel collection. Solo algae bots are therefore organised within the most concentrated areas of within the distribution in order to further detail their connections to additional mechanisms housed within the module columns to facilitate an efficient system algae infusion and drainage at various moments of the algal bloom cycle.
Its Alga_Terra bot companion therefore becomes a marker of the actual threshold transition between functions of continuity of green tissue versus living tissue for the production of bio-fuel or solar voltaics.

Furthermore, after the removal of the moss living tissue layer, the algae piping therefore has twice the amount of algal distribution as its partial algae, partial moss bot (alga_terra bot). The calculation changes of volume this facilitates in the urban scenario is further outlined in the green network analysis.

136 137 CONCLUSION CONCLUSION BIO_BOT 2.0 BIO_BOT 2.0
ALGA_BOT
Fig. 90. Alga_bot module structure
ALGA_BOT
STRUCTURE ALGAE PIPES COLLECTION PUMP O2 CIRCULATION CO2 SENSOR
Fig. 91. Alga_bot section shows the essential details of the morphology
GOAL GENERATE A MORPHOLOGICAL VARIATION OF THE COMPONENT TO MAXIMISE WATER COLLECTION
OBJECTIVES OPTIMISE THE MORPHOLOGY OF THE HYDRO_TERRA_BOT


FITNESS CRITERIA FITNESS CRITERIA 1; RATIO MAXIMISE VOLUME MINIMISE SURFACE FITNESS CRITERIA 2; MAXIMISE SHADOW ON THE LIVING TISSUE STRUCTURE FITNESS CRITERIA 3; MAXIMISE SUN EXPOSURE FOR ALGAE STRUCTURE
PHENOTYPE GENERATED USING DIFFERENTIAL GROWTH ALGORITHM
GENEPOOL POINT POSITION TO GENERATE POLYLINES FOR GROWTH, NUMBER OF POLYLINES, EXTRUSION DEPTH

A water collection and distribution system to sustain the performance of the biobot network, was introduced by the generation of Hydro_bot by providing infrastructure for the collection, filtering, and subsequent distribution of grey and rainwater. The porous nature of the timber sponge facilitates water vapour diffusivity enhancing the thermoregulation of the space.
COMPUTATIONAL LOGIC
The aim of the experiment is to optimise the morphology for maximum water collection. For this goal, the following fitness criterias were established: fitness criteria 1 (FC1)– maximises the length and number of rainwater lines which are simulated using average wind vector direction; fitness criteria 2 (FC2)– is set to maximise the surface area to volume ratio; fitness criteria 3 (FC3)– maximises the area of the water collection volume. The optimisation of surface differential growth that provides valleys for moss distribution was conducted separately, due to the limitation of the computational capacity. Each of these objectives is related to the morphological changes used to construct the primitive form of the Hydra_bot morphology; these transformations are known as the “genetic code” (or genome).
The number of genes or genome addresses the following morphological changes: the size of the base semi-spherical surface set as a gene. The starting radius for pocket morphologies can vary. The number of the guidelines for rainwater collection and at the same time their offset distance generated using varying values. The final step is the optimisation of the base surface for the differential growth to generate timber sponge where each offset distance is set as a gene.

138 139 CONCLUSION CONCLUSION BIO_BOT 2.0 BIO_BOT 2.0
1. Generation of circles with different radii
4. Generation of the water collection surface with water collection pockets
7. Offset of the generated polylines. Creation of a surface 8. Living tissue structure created by differential growth algorithm Final morphology of the Hydro_Terra_bot
2. Water collection surface with projected circles on the surface 3. Intersection of the surface with polylines. Solid difference
5. Water collection channels base line on the water collection pockets surface
6. Connection of water collection channels lines
HYDRO_TERRA_BOT
Fig. 92 Computational logic of the Hydro_Terra_bot
EVOLUTIONARY OPTIMISATION
Fitness criteria 1 (FC1) was measured as a ratio between the volume and water collection surface. The intention was to minimise the volume while increasing the surface area. The FC2 was set in order to increase the surface and number of water collection channels that direct water into the pockets. Finally, the FC3 intention was to increase the number and length of simulated rain lines. The rainwater simulation was created using an Anemone plugin for Grasshopper, wherein the directionality for rain was input as the predominant wind vector’s direction. The timber sponge structure was not a part of the optimisation process as it was optimised separately due to the computational limitations.
EVOLUTIONARY OPTIMISATION


Refer to Appendix Section C for Hydro_bot optimisation details.


OPTIMISED INDIVIDUAL
The result of the algorithm produced 1000 phenotype solutions with three fitness values per solution, totalling 3000 values. The average solution for all fitness criteria with a rank of zero was chosen as generation 43 individual 17 (G43I17). FC1 and FC3 informed the development of a water collection surface in which the high variety of water collection pocket morphologies were achieved.

140 141 CONCLUSION CONCLUSION BIO_BOT 2.0 BIO_BOT 2.0
Fitness criteria 1; Ratio | Maximise volume Minimise surface
criteria 2; Maximise shadow on the living tissue structure Fitness criteria 3; Maximise sun exposure for algae structure
Fitness
Fig. 93. The average solution for all fitness criteria with a rank of zero The red dots and curves show the selected solution in the entire simulation. It shows how successfully or unsuccessfully simulation optimised this solution for the three fitness objectives.
HYDRO_TERRA_BOT
The Hydro_Terra_bot can be identified by its enclosed upper half upon which there are patterned ridges in order to channel the water directly into the collection pods. The pods for storing water inside pass through a filtration membrane and secondary porous substrate to filter any particles out. This dispenses into the collection pod in the central node and the water levels and quality are monitored to determine which component will need water dispensed to it. The water channels between components are hidden within the fixed (non-rotating) hollowed arms of the structure. This ensures clean integration in between. Furthermore, due to the morphology of the slightly smaller upper half of collection as it relates to the larger edge of the filtration bottom half, there is an opportunity for rainwater to directly drip along the corrugated edges of the sawdust and moss section into a secondary concavity. As the moss biotissue

HYDRO_TERRA_BOT
in this needs shaded, humid environmental conditions, the rotational positioning of the module in their larger assembly should be minimised. The microclimate of the bottom portion is aided by mist attached directly from the collection pod and similarly serves to thermoregulate temperature fluxes for its human occupants underneath or nearby.

142 143 CONCLUSION CONCLUSION BIO_BOT 2.0 BIO_BOT 2.0
Fig. 94. Hydro_Terra_bot structure
STRUCTURE WATER CHANNELS COLLECTION &FILTRATION COLLECTION &FILTRATION DISPERSION LIVING MOSS MICROCLIMATE MIST
Fig. 95. Hydro_Terra_bot section shows the essential details of the morphology
HYDRO_BOT
The Hydro_bot is structured similarly to its Hydro_Terra bot companion. This hydro variation has been designed to maximise the available volume within its interior connective sleeves; by processing and filtering twice the amount of water capacity, this bot can be implemented in different scenarios. In one case, it can collect the rain water and disperse it to satisfy the performance of other bots needing water (per every group of 8 bots that have a living tissue membrane). By incorporating valves into the design of the bot when it connects at the ground level, it can directly channel the collected water off the site for storm water dissipation by locating it near ground channels. Furthermore, while the morphological design of the hydro_terra bot was such that its exterior channels have been placed according to a water simulation and gravity, the lower portion of the bot similarly has channels. This is not an oversight as the bottom

HYDRO_BOT
membrane is lacking green tissue; therefore it is has varying apertures within the membrane in order to disperse water throughout the assembly as a skin; thermoregulating its surroundings faster in cases of high temperature on site or in the context ecological services provided to species.

144 145 CONCLUSION CONCLUSION BIO_BOT 2.0 BIO_BOT 2.0
Fig. 96. Hydro_bot structure
STRUCTURE WATER CHANNELS COLLECTION &FILTRATION COLLECTION &FILTRATION DISPERSION MICROCLIMATE MIST
Fig. 97. Hydro_bot section shows the essential details of the morphology
GOAL GENERATE POROUS MORPHOLOGY TO FACILITATE PARTICLE CAPTURE

OBJECTIVES OPTIMISE THE MORPHOLOGY OF FILTRATION MEMBRANE THROUGH PARTICLE SIMULATION METHOD


Osmo_bot is designed to capture pollen and soot particles floating in the air contributing to the air pollution. The design objective was to formulate a morphology with variation in its porosity across its section to act as a multilayer filter with increased surface adsorption properties. The Osmo_bot was designed to consist of a highly perforated membranous morphology, to draw air in the biobot aiding the capture of black carbon from the atmosphere, and a timber sponge morphology as its crevices support the growth of moss to induce thermoregulation and green tissue continuity.


The module’s morphology is divided into two sections: the first is the timber sponge morphology to induce moss growth, and the second is membrane morphology. Additionally, the level of porosity on each filtration surface fluctuates, to aid filtration of grains of various sizes. The hole sizes also, alter the wind speed, smaller the holes faster will be the speed of the air going through it and vice versa., tested further by varying dimensions of the perforation holes through the modelling of particle behaviour in air medium using the Flexhopper plugin for Rhino|Grasshopper.

146 147 CONCLUSION CONCLUSION BIO_BOT 2.0 BIO_BOT 2.0
1. Polylines generation
4. Lines generation
7. Membranes multipipe surface creation 8. Living tissue structure created using differential growth algorithm
The final morphological organisation of the Osmo_bot
2. Exterior and interior surfaces generation 3. Base polylines for the intermediate surface
5. Intermediate surface creation
OSMO_BOT
6. Rebuilding of the surfaces grid size
OSMO_BOT
Fig. 98. Computational logic of the Osmo_bot
FITNESS CRITERIA MAXIMISE THE SURFACE AREA TO VOLUME RATIO OF MEMBRANES WHILE INDUCING MAXIMUM PARTICULATE CAPTURE
PHENOTYPE MEMBRANEOUS MORPHOLOGY GENEPOOL VARIATION IN POROSITY THROUGH DIFFERENT MEMBRANE LAYERS
Particle simulation was set up using 8 different sized filters to analyse the efficiency of the filtration module in trapping particles. In the first particle simulation, by setting the size of the filter grid in membrane 3 as a variable to test its role in filtration, it was observed that the third layer played a crucial role as to how many particles were intercepted: the denser the grid, the better the interception. Following which, by setting the grid size of the membrane 1 as a variable, it could be observed that the grid size of this membrane should not be too dense, otherwise it will block particles from entering the filter module, thus weakening its overall filtration.
In the second test, based on the findings of the previous simulation, membrane 3 was set to be the densest to focus on intercepting


particles with different densities in membranes 1 and 2. By setting the first layer to a medium density and setting the grid size of membrane 2 as a variable, it is observed that membrane 2 acts as a “pocket” in this simulation- the form of the second layer can be used to significantly reduce the flow rate of particles for the purpose of storing them. At the same time, this membrane should not become too dense, otherwise it will result in two parts of the module- the trapping and moss become unbalanced in terms of the number of particles stored. It can be observed that option 7 provides the optimal balance between particle capture efficiency and harmonising the quantity of particle capture between the filtration and moss layer.

148 149 CONCLUSION CONCLUSION BIO_BOT 2.0 BIO_BOT 2.0
Membrane grid 1 Membrane grid 2 Membrane grid 3 Percentage of catched particles Membrane 1 Membrane 2 Membrane 3 Moss structure Membrane grid 1 Membrane grid 2 Membrane grid 3 Percentage of catched particles Membrane 1 Membrane 2 Membrane 3 Moss structure Membrane grid 1 Membrane grid 2 Membrane grid 3 Percentage of catched particles Membrane 1 Membrane 2 Membrane 3 Moss structure Membrane grid 1 Membrane grid 2 Membrane grid 3 Percentage of catched particles Membrane 1 Membrane 2 Membrane 3 Moss structure 14.5 4.5 4.5 0.45 287 123678 121432 654437 13 4.5 3 0.73 548 13 3 3 0.71 636 242080 442173 872938 4.5 3 4.5 0.65 534487 127585 255171 382754 MEMBRANE TYPE 1 MEMBRANE TYPE 2 MEMBRANE TYPE 3 MEMBRANE TYPE 4 Total Simluation Particles: 2000000
Membrane grid 1 Membrane grid 2 Membrane grid 3 Percentage of catched particles Membrane 1 Membrane 2 Membrane 3 Moss structure Membrane grid 1 Membrane grid 2 Membrane grid 3 Percentage of catched particles Membrane 1 Membrane 2 Membrane 3 Moss structure Membrane grid 1 Membrane grid 2 Membrane grid 3 Percentage of catched particles Membrane 1 Membrane 2 Membrane 3 Moss structure Membrane grid 1 Membrane grid 2 Membrane grid 3 Percentage of catched particles Membrane 1 Membrane 2 Membrane 3 Moss structure 7 3.5 3 0.79 6228 360634 401116 810680 6 3.6 3 0.83 6549 379216 421784 852451 6 3.2 3 0.87 7590 505819 242943 882643 6 3 3 0.86 9625 475572 350681 884122
MEMBRANE
MEMBRANE TYPE 5 MEMBRANE TYPE 6
TYPE 7
MEMBRANE TYPE 8
Fig. 99. Particle simulation
The Osmo_bot is designed similarly to the production and collection details while prioritising its eponymous function. The dual membranes of varying apertures are designed to filtrate particulate matter (PM) of varying sizes. This can be curtailed or expanded depending on localised conditions of environmental specificity. The arms are designed to align it to receive a higher level of wind vector hits in order to ensure maximum exposure to PM. There is a secondary layer of filtration behind the dual membranes. From the other end, the filtration module also incorporates the production detailing for the living tissue.

In this context, moss plays an important role for filtration: it is capable of absorbing toxic chemical gases, nitrates, and hazardous pollution while combining 50% of it into fuel for itself. Water is dispersed into the living tissue to comply with the biological requirements of water via pod through the sawdust material layer. Furthermore, because the dual membrane is clipped into place along the length of arms, it is possible for replacement should the internal sensors in the central sphere indicate high pollutant exposure has been met.

150 151 CONCLUSION CONCLUSION BIO_BOT 2.0 BIO_BOT 2.0
OSMO_BOT
Fig. 100. Osmo_bot structure
OSMO_BOT
STRUCTURE DUAL MEMBRANE FILTRATION OF PM EXTRUDED SAWDUST WATER DISPERSION VIA COLLECTION MODULE LIVING MOSS
Fig. 101. Osmo_bot section shows the essential details of the morphology
TERRA_BOT
Terra_bot focuses on the regeneration of green tissue connectivity by maximising its surface area while retaining pod-morphologies needed to create habitation for species. It’s bio-mass is largest of all the bots and is intended to be the most amenable to blending into existing green tissue. Comprised of moulded timber sponge, it is porous in for the collection of spores to sprout life on its surface. Furthermore, its decomposition is considered most amenable to the environment by which time it will be filled with additionally filtered bio-mass.


152 153 CONCLUSION CONCLUSION BIO_BOT 2.0 BIO_BOT 2.0
Fig. 102 Growth of moss culture over 6, 12 and 18 month period
Fig. 103 Integration over 20 month period
TERRA_BOT
TERRA_BOT
The Terra_bot is a full-living tissue membrane bot which fullfills the function of species habitations. It is designed with an additional framework around it extracted from the original truncated octohedron. This timber framework is clad in a layer of timber sponge which has moss tissue culture already grown on it. When the moss begins to mature over the course of 6 months, it will thicken and cover the framework entirely in vegetation. This is particularly important for the assimilation of species into the module.

TERRA_BOT
The differential growth algorithm, in this case has been generated in order to produce ridges for the moss to grow between but more importantly deep pockets; similar in conception to the plant pockets of the flora_bot. Large enough to house avon species but given the structural arm protruding from the center of the moss pocket, it has been considered as a trunk element; filtering light coming through as a canopy. The addition of the framework which will thicken also facilitates density within the larger assembly of terra_bots.

154 155 CONCLUSION CONCLUSION BIO_BOT 2.0 BIO_BOT 2.0
Fig. 104. Terra_bot structure
STRUCTURE LIVING MOSS EXTRUDED SAWDUST WATER DISPERSION VIA COLLECTION MODULE LIVING MOSS CULTURE
Fig. 105. Terra_bot section shows the essential details of the morphology
TERRA_BOT 2.0
Terra_bot 2.0 focuses on the regeneration of green tissue connectivity by maximising its surface area while its pod-morphologies are fully enclosed. It’s interior volume is filled with a hydrogel mixture sitting a top a mix of conductive fibers, as identified in the Moss Voltaics experiment outlined in domain. By maximising the surface area of the moss living tissue it simultaneously maximises its interior volume; thereby increasing the amount of photosynthesis and carbon absoroption the bot can come in contact with. This induces a voltaic response to the plate of cathodes and anodes below, sending charges back into the ‘brain’ of the module.

TERRA_BOT 2.0
Terra_bot 2.0 becomes integral as a living green tissue bot which can directly expend energy back into the energy grid of its introduced site. It is self-sustainable as any harnessed power is implemented to fuel the other functional bots; either in the collection of solar power to ensure that the alga_bot is kept well lit to process photosynthesis or that the flora_bot is receiving enough light on days of less solar exposure.

156 157 CONCLUSION CONCLUSION BIO_BOT 2.0 BIO_BOT 2.0
Fig. 106. Terra_bot 2.0 structure
STRUCTURE HYDROGEL LAYER *CRYSTALINE ANODE CATHODE PLATE CONDUCTIVE METAL FILLINGS LIVING MOSS
Fig. 107. Terra_bot 2.0 section shows the essential details of the morphology
BIO_BOT MATERIAL CALCULATIONS
MATERIAL TIMEFRAME UNITS 02 PRODUCTION UNITS C02 ABSORPTION UNITS AREA UNITS PARTICULATE MATTER 1 PLANT 1 DAY g 900 g 900 cm2 60
BIO_BOT MODULE CALCULATIONS
The calculations to assess the biomaterial and living tissue composite has been obtained to compare the outcome of the proposed network growth against values of oxygen production, carbon absorption, and particulate matter capture. These values are based on 470g of carbon dioxide which can be absorbed by 1000ml of activated saw dust composite undergone through pyrolysis, 1000ml of algal solution absorbed by 8.27 grams of carbon dioxide and the release of 6.03 g of oxygen. In comparing the values at a per-module basis, calculations can be made further to confirm the success of the distribution of function within the network while assessing the period of time for intervention on site.
158 159 CONCLUSION CONCLUSION BIO_BOT 2.0 BIO_BOT 2.0
MOSS
ALGAE 1 DAY g 0.072224 g 0.09924 cm3 1000 SAWDUST 1 PLANT 0.0197 cm3 6100
1 DAY 500 cm2 10000 g 20
Material Sawdust Plants Algae Water ** Parameters volume baked or extruded (cm3) CO2 absorption per day(g) Surface (cm2) O2 production per day (g) CO2 absorption per day (g) Volume cm3 O2 production per day (g) CO2 absorption per day (g) FLORA-bot - - 3070 46050 46050 - -TERRA-bot: habitation 127072 0.410 TERRA-bot: production 79420 0.256 ALGA-bot 14817 1.070 1.407 ALGA-TERRA-bot 39710 0.128 5330 0.385 0.529 HYDRO-bot ** 79420 0.256 24100 HYDRO- ** TERRA-bot Living tissue surface 39710 0.128 - - - 13500 0.385 0.529 OSMO-bot Living tissue surface 39710 0.128 Moss Overall per day (g) Overall per year (kg) Surface cm2 CO2 absorption per day (g) Particulate matter per day (g) CO2 absorption per day (g) O2 production per day (g) Particulate matter (g) CO2 absorption (kg) O2 production (kg) Particulate matter (kg) - - 46050 46050 16808.25 16808.2542357 2117 84.713 2118 26473 1323 52.946 1324 1.070 0.536 0.391 13236 661.8 26.473 662.4 0.385 241.8 0.145 9.662 1.47 13236 661.8 26.473 662 -0.385 - 241692 0.385 9.662 6591 329.5 13.182 330 12027 4.81
Fig. 108. Bio-bot material calculations Fig. 109. Individual bio-bot material calculations
FUNCTIONAL CATEGORISATION

Bio_bots were designed to cater to the four categories of functionality that is production of energy and biofuel, collection of water and heat, filtration of pollen and soot and protection of plant and species to be intervened across high risk zones subject to environmental deterioration. The distribution of biobots across these four functions could be allotted based on the biobots performative characteristic Therefore Alga_bot, Alga_Terra bot, Terra_bot are categorised to aid the production of biofuel and electricity through public pod interventions, Flora_bot , Hydro_bot, Osmo_bot are categorised to aid the collection of water and pollen through horticultural pod interventions, Hydra_bot and Osmo_bot is categorised to aid the Filtration of air and water through filtration facade assembly interventions and Terra_bot and Flora_bot for Protection of plants and species for habitation pod interventions in the affected zones.


160 161 CONCLUSION CONCLUSION BIO_BOT 2.0 BIO_BOT 2.0
HYDRO_TERRA TERRA_TERRA ALGA_TERRA HYDRO FLORA ALGA OSMO HYDRO-TERRA FLORA TERRA OSMO
Fig. 110. Bio_bot collection categorised by function
CONCLUSION
While the technical detailing for the project has been considered and designed on an individual module basis, the ultimate reflection on the assembly has prioritised the module’s ability to be functionally unique while structurally ubiquitous; the structure remains constant while the interior fittings are adaptable to serve the four different functions. In this way, no matter the relationship of one programmatic function to another, there is a clearly outlined proposal in the transition from one functional assembly to another. Moreover, by identifying that larger groups of similar functions ie. filtration or collection functions can work together in higher quantities in order to maximise the volume of liquids passing through between modules, the system of filtration effectively works as a stand-alone isolated method between other programmatic modules- it can pool all similar liquids together in unison to facilitate faster filtration. The modules were therefore designed to have functionally-specific detailing which would not affect the fabrication process; each structural module was fabricated in the same fashion allowing for change should there be environmental changes such as meeting the amount of pollution extraction for a particular site location or removing elements within the assembly which have met the material’s contamination extraction limit.

162 163 CONCLUSION CONCLUSION BIO_BOT 2.0 BIO_BOT 2.0
MATERIAL IMPLEMENTATION

164 165 MATERIAL IMPLEMENTATION MATERIAL IMPLEMENTATION BIO_BOT 2.0 BIO_BOT 2.0
The production process of the bio-bot module was considered from the environmental and economic perspectives simultaneously. Hence, saw dust for morphological development was aimed to be utilised from the milling process of timber structure of the bio-bot thereby intending to reduce the carbon footprint. The experiments were conducted through two methodologies of moulding, implemented in timber sponge morphology and robotic extrusion implemented in Flora_bot morphology.

ROBOTIC EXTRUSION
The morphology of the Flora_bot was not aimed to be porous but to possess comparatively higher structural strength, as long lengths had to be maintained to create plant pockets. Hence the methodology of extrusion using robotic end effector to extrude the saw dust resin mixture was utilised. After previously successful extrusion experiments, steps were laid out to fabricate 1/8th part of the morphology by extrusion methods. These generated forms, when rotated and adjusted along their central spherical axis could be assembled to produce the final morphology, hence sufficing to the aim of modularity Figure 96.
166 167 MATERIAL IMPLEMENTATION MATERIAL IMPLEMENTATION BIO_BOT 2.0 BIO_BOT 2.0
Fig. 111. Logic for robotic extrusion. Usage of the same morphology as a base surface for extrusion will allow the creation of complex geometries. The structure should be always located in the centre even if morphology is different
In order to execute this process, a hemispherical mould made from foam was milled. The radius of the hemisphere was equal to the radius of the morphology to be extruded. After the adequate mixture was being prepared for the extrusion, the final morphology was extruded on the hemispherical mould as a base, hence, the toolpath was developed based on these geometrical implications.

LIMITATIONS OBSERVED


The extruded morphologies were let to air dry at room temperature in a non-laboratory environment. The temperature, pressure and humidity levels were not controlled, leading to non uniformity in the air drying process. As a result, there was uneven contraction of material while drying, leading to generation of some shear cracks.


168 169 MATERIAL IMPLEMENTATION MATERIAL IMPLEMENTATION BIO_BOT 2.0 BIO_BOT 2.0
Fig.112. Robotic extrusion of sawdust material on the flat surface; Experiment 3
Fig. 113. Robotic extrusion of sawdust material on the curved surface; Experiment 4

170 171 MATERIAL IMPLEMENTATION MATERIAL IMPLEMENTATION BIO_BOT 2.0 BIO_BOT 2.0
TIMBER SPONGE MORPHOLOGY
The manifold morphology component in the biobot was developed to aid the growth of moss. This manifold morphology needs to be developed from timber sawdust sponge the biomaterial composite formulated in material experimentation phase, as its porous nature induces the growth of green tissue. From the material experiments it could be concluded that porosity in the biomaterial composite is achieved through baking process conducted in the absence of the air. While raw semi solid biomaterial can be poured into mould of any geometrical form to be baked further for final production.
-
MOULDING


Hence, the manifold morphology of timber sponge component was best suited to be fabricated through moulding as the generated designed morphology had asymmetric algorithmically generated crevices. After previously successful moulding experiments, steps were laid out to fabricate 1/8th part of the timber sponge morphology by moulding methods (Fig. 114). This 1/8th part mirrored along the edges generated the full morphology to a complete 360 degree sphere.

172 173 MATERIAL IMPLEMENTATION MATERIAL IMPLEMENTATION BIO_BOT 2.0 BIO_BOT 2.0
Fig. 114. Logic for creation of the living tissue structure using CNC milling. The surface should be subdivided into flat mor
phologies
The process was executed by creating double moulds. Firstly a mould for the 1/8th part of the morphology was created by milling a grey Roland foam, but since the foam mould is not feasible for baking, a second mould was cast using a thermosetting silicone with a high melting temperature of 500 C recast on the foam mould. The silicone mould was used as the final mould for casting the raw mixture of sawdust biomaterial composite to be baked further in the absence of oxygen at a temperature of 230C for final production.


174 175 MATERIAL IMPLEMENTATION MATERIAL IMPLEMENTATION BIO_BOT 2.0 BIO_BOT 2.0
Fig.115. The living tissue structure surface made of foam after the CNC milling
LIMITATIONS OBSERVED
The experiments were conducted in a home oven as opposed to an air-drying furnace. Hence, it could be observed that the heating was irregular, leading to crystallisation in certain regions.


176 177 MATERIAL IMPLEMENTATION MATERIAL IMPLEMENTATION BIO_BOT 2.0 BIO_BOT 2.0
Fig. 116. The living tissue structure surface after baking in a silicone mould
Fig. 117. The living tissue structure surface after baking in a sil
-
icone mould
178 179 GREEN NETWORK DEVELOPMENT GREEN NETWORK DEVELOPMENT BIO_BOT 2.0 BIO_BOT 2.0
GREEN NETWORK DEVELOPMENT


180 181 GREEN NETWORK DEVELOPMENT GREEN NETWORK DEVELOPMENT BIO_BOT 2.0 BIO_BOT 2.0
Fig. 118. Participatory scheme diagram
URBAN PARTICIPATORY SCHEME
The design research focuses on developing a technological green-energy generating network of Bio_bots to be implemented as urban infrastructure proposed as an Environmental Urban Scheme for London to address the environmental deterioration at all levels. The implementation of the Biobot networks is succeeded by identifying urban nodes prone to utmost environmental deterioration, where Soho has been identified as a region for further case study. The network of bio-bots will be implemented as pods for production of biofuel and electricity, collection of grey water, filtration of air and protection of flora and fauna. In order to implement the proposed green network strategy, it can be laid out as a participatory scheme for civil citizens in order to generate a sense of responsibility and awareness for the environment Figure 118.
Step 1: MACRO SCALE: Identifying Urban Nodes at High Risk In a City
Real time changes in the environment are proposed to be mapped by the help of sensors installed in all possible places. With the use of Artificial Intelligence the entire data can be mapped and recorded in the London Environment headquarters, in order to identify the urban nodes at high risk.
Step 2: MICRO SCALE Urban and environmental mapping of Urban Node
Once the nodes at high risk are identified, further mapping at micro scale is proposed to be conducted based on the parameters like pedestrian patterns, lack of shaded regions, high temperature regions, regions with low green tissue proximity, regions with high wind pressures and high particulate matter content in the air. All of this information can be assigned to per square meter voxel each of the areas under investigation.
Step 3: GENERATION OF FUNCTIONAL DISTRIBUTION MAP
After micro scale mapping of urban nodes and assigning the information to a voxel (per square meter). The functions (production, collection, filtration, collection) for intervention can be distributed With the help of self organisational mapping and distribution which is based on the computational logic of Kohonen Self Organising Map.
Step 4: DEVELOPMENT OF ARCHITECTURAL RESOLUTIONS
After the allocation of functional distribution over the site, architectural outputs are generated based on the algorithm developed for spatial configuration operated through further environmental analysis, conducted in the three dimensional space per cubic metre of volume. The algorithm uses diffused limited aggregation to generate a network of bio-bots, while the growth being optimised through environmental parameters such as creating shaded regions, increasing wind regulation and green tissue proximity.
URBAN PARTICIPATORY SCHEME
After these networks are generated architectural information is outputted in the form of structural assembly sequence manual for the citizens, to be constructed in situ on the site.
Step 5: ENROLLMENT PROGRAM
In order to induce a voluntary citizen participation, an environmental scheme and participation application/ website is proposed to be developed to be used by the local citizens. The application will provide a platform for registration to participate in the assembly of the bio-bots on site. The application will contain location, dates, and methodology sequence manual and other information for the volunteers to view. Once a certain amount of required participation will be reached. Bio-bots will be supplied to the site on the designated date, time and location.
Step 6: SITE ASSEMBLY AND SUPPLY
A user manual will be provided in the application for the citizens to assemble the biobots on the site, raw material for the functioning of the bio-bots will be provided on the site. Once the bio-bots are assembled on the site, the location of the bio-bots will be updated in real time in the application from the sensors of bio-bots. Instructions for daily interaction and maintenance for the citizens will be prompted on the application.
Step : USAGE AND MAINTENANCE
As the bio-bot networks function as nodes for power generation. Different categories of bio-bots that have different user interaction methodology will be prompted to the citizens based on physical sensors as light emitters as well as prompted on the application to users in the closest vicinity to the bio-bots. The interaction will be based on mechanical input by the users in order to facilitate the functioning of bio-bots. Further prompts will be generated when the biobots are ready to be used as electricity charging pods for smartphones and electric vehicles.
Step 8: RE-ASSEMBLY SCHEME
If a bio-bot reaches its threshold for repair subject to weather conditions or dysfunctionality, It will be prompted back to be replaced. Re-assembly and replacement will again be considered from the real time environmental mapping. Furthermore, new urban nodes at high risk will appear. The entire process will be repeated in a 6 month cyclic loop. Where energy balances before and after the implementation of bio-bots will be calculated as a step to analyse the rate of change in existing carbon footprints
182 183 CONCLUSION CONCLUSION BIO_BOT 2.0 BIO_BOT 2.0
SITE MAPPING PARAMETERS
As an example model for the urban scheme, Soho Square has been considered for zone A and a public, commercial interstice has been identified as zone B. This is to facilitate a comparison between two different types of participatory intervention. While Soho Square is an open, publicly accessed ‘green’ space, it requires the consent of parties involved for the intervention, maintenance and generation of all functions to modulate the bio-bot. It has open access and as a public park, therefore falls within government jurisdiction. In contrast, zone B interstice is a commercially-owned property. Its multifunctionality requires different considerations; identifying a ground-level commercial enterprise, a hotel subject to large influxes of people, residential lofts and restaurants on top. It is additionally selected as a case study as it is one of few urban fragments which has a ‘green roof’- selective potted vegetation as well as solar panelled terrace at its highest peak. This provides the opportunity for the bio-bots to participate in the same functions as they do in Soho Square albeit with a series of caveats. The participatory nature is reconsidered as the building is not government owned. Instead, the property may choose to install the bio-bots. It may assign a team of interventionists to facilitate the care-taking of the bio-bots. It will need different coordination given the functioning of a double-skin facade; laymen cannot climb up the exterior to care-take but workers who are hired for glazed-facade maintenance would have access. Furthermore, depending on ownership of the solar-collection panels, the property could choose whether the energy harvested through solar or algal pods should be inserted back into the grid of the building, or the grid of the city; a distinction to be made.
After identification of Soho, London as a polluted node of intervention for bio-bots, the following points should be made for the selection of zones [a] and [b]. Zone [a] at Soho Square, is one of two urban green parks in Soho. It has been selected specifically because though it is identfied as green tissue, in actuality it is paved in stone and asphalt with less than 10 trees planted. Surrounded by a mix of historically protected Grade I and II buildings, it provides restrictions in the alteration of facade. As a primarily in the commercial and hospitality sector, there is a range of interstitial spaces identified which are used for waste management rather than intervention. Furthermore, its proximity to Picadilly Theatre which has 1,600 people coming in and out of the area daily, along a major (shortest path)transportation route between Picadilly and Oxford Circus terminates near Carnaby Street. This particular site has influxes of 110,000 people daily on average. Therefore there is high thermal dysregulation along the footfall lines as well as increase in pollution. Zone [b] to be identified further in contrast is identified as an isolated commercial building to be analysed for its potential interstice called out in Figure 119.

184 185 CONCLUSION CONCLUSION BIO_BOT 2.0 BIO_BOT 2.0
Fig. 119. Site identification of zone [A] and [B]
FUNCTIONAL DISTRIBUTION
Architectural functions across the Soho Node are aimed to be intervened as production pods of biofuel consisting of alga_bots and electricity consisting of terra_bots, collection and filtration double skin facade system consisting of hydra_bot and osmo_bot, protection pods consisting of flora_bot and terra_bot in urban scale and green belt.
The study model for program intervention being considered as Soho square defined under the domain of interstitial public space intervention. The total approximate area of the site is 70,000 sm2, therefore a further regional environmental analysis in order to define the exact locations of sprouting zones for the bio-bot network becomes extremely important. In order to do so, the entire site was divided in a two dimensional grid of voxels with area per unit voxel being 1mx1m.
Further, environmental and urban parameters such as access to daylight, wind vector hits, particulate pollution, pedestrian patterns, and proximity to green tissue were analysed for each voxel. Each of these environmental parameters were weighted for the four architectural functions of production, collection, filtration and protection based on the subjective requirement for each function. With the help of the Self Organising Map algorithm, a gradient of change from one function to another was mapped for each voxel assigned as a weight represented as one of colours from the colour gradient. As the bio-bot network system is intended to be a continuous network system, it is critical to address the gradient of change of bio_bots from a network system of one functional pod transcending into another. This method produced the location of voxels with highest weights for each function considered as a sprouting zone for each intervention.

186 187 CONCLUSION CONCLUSION BIO_BOT 2.0 BIO_BOT 2.0
FUNCTIONAL DISTRIBUTION
ACCESS TO DAYLIGHT
Access to daylight was analysed as a goal to identify the regions with maximum sunhours to consider the allocation of production pods for alga_bots as sunlight capture is required for photosynthesis.

The voxel grid generated on the site was analysed for cumulative access to daylight. To conduct the analysis, cumulative sun rays vector hits for the entire year for London were calculated against each voxel for the site. The voxels encountering the maximum number of vector hits were assigned the highest weights, and vice versa for the rest of the voxels. A colour gradient voxel map was generated to depict weights of highest order to the lowest order as represented in Figure 120. The regions identified with maximum weights were located in Soho Square.


SUBJECT TO WIND VECTOR HITS
Wind vector hits were analysed to identify regions for allocation of double skin biobot facades for filtration of air and pollen capture for plantation pods.
Further, the same voxel grid generated on the site was analysed for its likeliness to receive wind vector hits throughout the year
To conduct the analysis, the annual dominant wind direction was considered as South-west to North-East of London according to the windrose analysis. A plane was generated In the South-West region of the site, vector rays were cast across the site. The voxels that encountered maximum wind vector hits were assigned highest weights. A colour gradient voxel map was generated to depict weights of highest order to the lowest order as represented in the Figure 121.
PARTICULATE POLLUTION
Particulate pollution was analysed to identify regions for allocation of double skin biobot facades and filtration pods majorly for filtration of air and capture of black carbon and soot. Two parameters were considered for the analysis of particulate pollution firstly the predominant wind vector direction that is from Southwest to the North East, secondly voxels falling in the category of primary roads, highways that are subject to constant air pollution due to emissions from vehicles were considered for ray cast across the voxel grid. The voxels with highest cumulative sum of both the vector raycast hits were considered as voxels under the region of highest particulate pollution.A colour gradient voxel map was generated to depict weights of highest order to the lowest order as represented in the Figure 122.
FUNCTIONAL DISTRIBUTION


PEDESTRIAN PATTERNS
Pedestrian patterns were analysed to predict heat generation due to pedestrian movement throughout the day, while it was assumed that heat generation is directly proportional to the amount of people per square unit area. This information was processed for the allocation of moss pods in the collection category consisting of Terra_bots to induce thermoregulation.In order to analyse the pedestrian patterns on the voxel grid generated on the site. Transportation hubs in Soho were mapped and located in the voxel grid. These points were considered as the origin points of pedestrian traffic. Rays were cast from each transportation origin point to another transportation origin point simultaneously passing against each voxel on the site grid. Hence, voxel regions most likely to be under continuous pedestrian access were identified with maximum vector hits. A colour gradient voxel map was generated to depict weights of highest order to the lowest order as represented in the Figure 123. Simultaneously voxel regions with lowest pedestrian access as most unlikely paths were identified.

GREEN TISSUE PROXIMITY
One of the aims of the project is to generate a continuous green tissue network while providing habitation to plant and animal species . Green tissue proximity was analysed for the allocation of the protection pods consisting of the Terra_bots and the Flora_bots. Regions with green patches were identified, and mapped across the voxel grid. Distances from these points were calculated for each voxel on the grid. The voxel with the smallest distance, attained the highest weight and vice versa. A colour gradient voxel map was generated to depict weights of highest order to the lowest order as represented in Figure 124.
KSOM
After the weights for the above mentioned environmental and urban parameters for the allocation of the functions were mapped as voxel colour gradient to represent weights, a self organisational map was generated to create the map for gradient of functional distribution using the Kohonen Self Organisation Map component in the Grasshopper Rhino.
In order to create the self organisational map for the functional distribution of the production (A), collection(B) filtration(C), protection(D) pods. The analysed urban and environmental parameters were hierarchically weighted for each of these functions according to the functional requirement as an input to the Self Organising Algorithm Figure 125.
188 189 CONCLUSION CONCLUSION BIO_BOT 2.0 BIO_BOT 2.0
Fig. 120. Access to daylight
Fig. 121. Wind vector hits
Fig. 122. Particulate pollution
Fig. 123. Pedestrian patterns
Fig. 124. Green tissue proximity
Fig. 125. KSOM self-organisation map
AREA QUANTIFICATION


For each function (production, collection, filtration, protection) voxels with cumulative highest weights are mapped as clustering strategy represented through colour gradient from highest weighted voxel to lowest weighted voxel of one function to another respectively. Hence, the functional distribution of respective architectural pods were obtained. Furthermore, this information was processed to obtain the highest weighted voxel for each function to consider the sprouting zone for biobot network generation. The self organisational map also informed the quantity of biobots to suffice the functional working of the pods.The ratio of voxels underlying each function was obtained and total number of bio-bots for each function were received as represented in Figure 126.
DLA NETWORK FORMULATION
In order to agglomerate the network of bio-bots, Diffusion limited aggregation was considered as the most appropriate strategy model. The truncated octahedral geometry of the bio-bot was formulated in order to abstract the vector direction from its 14 faces for the formation of connections with its consecutive bio-bots to create dynamic spatial aggregations. Diffusion Limited aggregation algorithm was implemented to generate the network. According to MIT AI Laboratory: A broad category of behaviour known as diffusion-limited aggregation underlies a number of dendritic growth-related phenomena, including the development of ice on a window pane, lightning and sparks, and urban sprawl. The particles or individual units that make up a specific “resource” diffuse freely until they are caught by and help to form a static structure. “The clusters generated by this process are both highly branched and fractal.” Diffusion Limited Aggregation (DLA) is used as a framework for generating networks that produce highly branched and fractal forms; integral to filling interstices. DLA therefore is an appropriate method to necessitate the connection from environmentally deteriorated nodes to multiple green spaces which begin to branch at several locations.
190 191 CONCLUSION CONCLUSION BIO_BOT 2.0 BIO_BOT 2.0
Fig. 126. KSOM distribution diagram
Fig. 127. Diffusion Limited Aggregation network
CREATE SHADED REGION


Each of the unit voxels from the 3-D voxel grid was subjected against the sun vector hits per annual climatic analysis of London, Based on the amount of sun vector hits per voxel, weights were assigned to each voxel. The voxels with maximum number of sun vector hits were assigned highest weights, in order to generate aggregations that could create maximum solar shading. The weight values for each voxel were re mapped (0.1-1)through a coloured gradient of change as represented in Figure 129.

DLA NETWORK FORMULATION
A design algorithm was formulated in order to generate the network of biobots using sequential diffusion limited aggregation based on design goals sufficing environmental optimisation. This is conducted in the order of assigning hierarchical weights informed by environmental analyses to the 3d voxel grid for growth, the voxels with higher weights are considered as spawn points for growth. The attractor point locations are generated from the most unlikely path analysis for integration. As an example for a DLA network of 500 iterations, for the initial 10 iterations the classic DLA algorithm is activated, generating radial clusters at spawn locations. For the remaining iterations, directionality is induced, obtained from vector multiplication in direction of attractor points, generating branching, With the simultaneous activation of environmental DLA growth laid out further.
3-DIMENSIONAL SPACE INPUT

From the functional distribution mapping Soho Square was identified as the sprouting region for the network of biobots, therefore further analysis for the Soho Square was conducted for the network development. In order to generate the network, the entire Soho Square was voxelized in a cubic grid of 1x1x1 (m) per unit voxel. The size of the unit voxel was obtained from the bounding volume of a unit biobot that is 1x1x1 (m). The three dimensional coordinates for each voxel are inputted as possible locations for the growth of biobots.


The newly defined aim for the growth of the network of biobots was based on identification and formulation of environmental parameters defined as design goals, in order to generate the algorithm for the same. In order to inform these design goals in the algorithm, three dimensional voxel weighting method was formulated.
WIND VELOCITY REGULATION

Each of the unit voxels from the 3-D voxel grid was subjected against wind vector hits as per dominant annual wind direction that is Southwest to Northeast of London. Based on the amount of wind vector hits per voxel, weights were assigned to each voxel. The voxels with maximum number of wind vector hits were assigned highest weights, in order to generate aggregations that could encounter maximum wind vector hits to induce reduction in the wind speed and capture particulate matter in the air. The weight values for each voxel were re mapped (0.1-1)through a coloured gradient of change as represented in Figure 130.
PROXIMITY TO GREEN TISSUE
The regions with green patches in the Soho square were mapped, Centroids for these green patches were generated and distances from the centroids to each of the unit voxels from the 3-D voxel grid was calculated. The voxels subjected to shorter distance were assigned higher weights and vice versa, to ensure growth in these regions to create continuous link with the green tissue.The weight values for each voxel were re mapped (0.1-1) through a coloured gradient of change as represented in Figure 131.
192 193 CONCLUSION CONCLUSION BIO_BOT 2.0 BIO_BOT 2.0
Fig. 128. Soho Square elevation
Fig. 129. Grid weighting for points subjected to sun vector hits
Fig. 130. Grid weighting for points subjected to wind vector hits
Fig. 131. Grid weighting for points closer to green tissue
IDENTIFICATION OF UNLIKELY PEDESTRIAN PATHS
As a part of urban analysis, most unlikely paths were crucial to be analysed to identify the voxel regions where the biobots could possibly be attached to the ground to avoid any hindrances with existing pedestrian patterns and in return shade the existing pedestrian paths. In order to analyse the pedestrian patterns on the voxel grid generated on the site. Transportation hubs in Soho were mapped and located in the voxel grid. These points were considered as the origin points of pedestrian traffic. Rays were cast from each transportation origin point to another transportation origin point simultaneously passing against each voxel on the site grid. Hence, voxel regions most likely to be under continuous pedestrian access were identified with maximum vector hits. The voxels with least vector hits were assigned highest weights and vice versa.The weight values for each voxel were re mapped (0.1-1)through a coloured gradient of change as represented in Figure 132.


FACE VECTOR ASSOCIATION TO ENVIRONMENTAL PARAMETER

The voxels locations for growth have been weighted for prioritisation of growth locations to achieve the design goals. However, to achieve more spatial control over the growth, a relationship between each environmental parameter and the respective extracted module face vector (of 14 faces total) for the formation of connections with its consecutive biobot was defined. To create more shaded regions vector directions for lateral connections were weighted higher, to encounter high wind vector hits, face vector for upward connections were weighted higher, for green tissue continuity, face vector for downward and lateral connections were weighted higher,for unlikely paths face vector for downward connections were weighted higher. This vector weighting method informed the architectural spatial dynamics of the space.
SPAWN POINTS AND ATTRACTOR POINTS


The highest weighted voxel for the Wind Velocity regulation, Proximity to Green Tissue, and high sun exposure are extracted as the sprouting points for the locations to generate spatial growth of network of biobots.The Attractor Points are extracted from the voxels with highest weights obtained from the most unlikely path analysis. ,envisioning spatial growth terminating at the ground line.
SPAWN WEIGHTS
The spawn weights are input as the quantity of biobots to be generated at the Spawning locations- corresponding to the quantification performed in the functional distribution method.
194 195 CONCLUSION CONCLUSION BIO_BOT 2.0 BIO_BOT 2.0
Fig. 132. The living tissue structure surface after baking in a sil
Fig. 133. The living tissue structure surface after baking in a sil
Fig. 134. The living tissue structure surface after baking in a sil
Fig. 135. The living tissue structure surface after baking in a sil
SEQUENTIAL DLA
First module is placed at the Spawn point location,classic DLA for initial iterations is activated. The classic DLA simulation assigns a random walk between each particle and its attachment to the attractor point.For all subsequent iterations, directional DLA and Environmental DLA are activated simultaneously. From the last voxel locations reached, the algorithm examines the neighbouring voxels for further growth, the next growth occurs at the voxel location with highest weight informed by cumulative environmental voxel weighting. The algorithm identifies the environmental parameter inducing maximum contribution to the cumulative voxel weight. The face vector of the biobot associated with the respective environmental parameter induces further control over the spatial growth added to the directionality vector to reach the attractor point. The growth iterations are run until the maximum spawn count is reached. The algorithm was run for the four design goals independently and as a cumulative analysis for comparison.
BIO_BOT DISTRIBUTION
After the network for production pods at Soho Square (Zone A) and Commercial Building (Zone B) is generated based on the required biobot count, the validation for achievement of above mentioned environmental goals are outputted as their respective colours as represented xx.Further, each environmental parameter corresponds to the gradient of distribution of the biobots within the production, collection, filtration, and protection pods generated.


Yellow modules represent locations with maximum sunlight access, hence, adequate for the placement for alga_bot for photosynthetic requirements, transitioning into alga_terra bot to receive solar voltaics, while green modules represent locations for terra_bots in order to facilitate the green tissue continuity.
The pink modules are a result of their closer proximity to the ground, hence, represent the location of the terra_bots for species habitation at ground level. The blue modules are obtained as a fulfilment of environmental goal with highest wind vector hits, hence facilitate maximum particle capture from air under filtration category, representing the osmo_bots. While the Hydra bot gets distributed across every eight biobots in the Collection pod category to facilitate adequate flow of water through flora_bots.
196 197 CONCLUSION CONCLUSION BIO_BOT 2.0 BIO_BOT 2.0
Fig. 136. The living tissue structure surface after baking in a sil Fig. 137. The living tissue structure surface after baking in a sil
STRUCTURAL LIMITATIONS | ANALYSIS
In order to control the architectural implications of the aggregation, a ruleset of constraints was implemented as parameters for identifying the voxels to be avoided for growth within the 3-dimensional grid.

Spatial envelope of buildings:


Non-conserved facades are open to intervention
Within the accessible facades, window vistas are neither to have sightlines blocked nor the exposure to sunlight1
1 metre offset from the facade minimises non-structural tiebacks to existing construction
Restrictive height distance to facilitate transportation network was introduced at 10 metres
Terminating the network growth at the ground to maintain the required cantilever limitation
The iterations are run continuously until the quantity of bio-bots needed to suffice the environmental

In order to understand the cantilever limitations that should be implemented within the network generation framework, the finite element analysis was conducted. The analysis was set up for testing using the Karamba plugin for Rhino | Grasshopper. The analysis was conducted on a variety of connected structures using only 2 points of connection to the building and analysed from 2 to 6 connected modules.
(Fig. 142) As the structure of the modules consists of wood, wood was implemented in the analysis to understand the real parameters of displacement. The FEA analysis was tested considering the worse case scenario- particularly the linear aggregation of modules. As a visual representation, displacement results shown have been increased 50 times.
Material: wood;
Cantilever: 1.9 m;
Cross-section: 1.5cm;
Supports: wall connection;
Load: self-weight;
Displacement: 0.04 cm
Load: wind pressure 0.0072 kPa
Displacement: 0.028 cm
Material: wood;
Cantilever: 2.7 m;
Cross-section: 1.5cm;
Supports: wall connection;
Load: self-weight;
Displacement: 0.34 cm
Load: wind pressure 0.0072 kPa
Displacement: 0.46 cm
Material: wood;
Cantilever: 3.4 m;
Cross-section: 1.5cm;

Supports: wall connection;
Load: self-weight;
Displacement: 1.27 cm
Load: wind pressure 0.0072 kPa

Displacement: 1.33cm
198 199 CONCLUSION CONCLUSION BIO_BOT 2.0 BIO_BOT 2.0
Fig. 138. Buildings as obstacles
Fig. 140. Visual and solar constraint for windows
Fig. 141. Transportation and pedestrian road buffer
Fig. 139. Cantilever restriction
Fig. 142. Finite element analysis
Material: wood;
Cantilever: 4.2 m;
Cross-section: 1.5cm;
Supports: wall connection;
Load: self-weight;
Displacement: 3.43cm
Load: wind pressure 0.0072 kPa
Displacement: 3.28 cm
Material: wood;
Cantilever: 5 m;
Cross-section: 1.5cm;


Supports: wall connection;

Load: self-weight;
Displacement: 7.76 cm
Load: wind pressure 0.0072 kPa
Displacement: 5.3 cm
ARCHITECTURAL RATIONALISATION
The analysis showed that connections of 5 modules in a linear assembly considering the section of the shell as 1.5cm and wind pressure of 0.0072kPa, the displacement value will be 3.42cm and 3.48cm respectively. While the connection of 6 modules linearly showed that considering self-weight and wind pressure of 0.0072kPa, the displacement value will be 7.76cm and 5.3 cmrespectively. Therefore, obtaining lengths of the modules was implemented as a cantilever constraint, at 4.5 metres. The conducted set of experiments took into consideration only bearing structure, without taking into account any supplementary materials and equipment needed for their performance. Therefore, in the following stages of the research development, the structural capacity of the modules should be reevaluated.
The FEA analysis identified the cantilever restriction to be implemented as a limitation within the network design. Oversight has been made to avoid dangerous overhangs in public sites- therefore all morphologies have been attached to the ground to distribute load equally; as this is a modular structural system. Furthermore, the detailing is such to not destroy existing site material- Figure 123 identifying the construction sequence which will remove existing stonework or brick to place a foundation underneath which will then be utilised to cover it back atop. Therefore the bio-bot modules can be assembled using a sleveve-joint system with minimal disruption, as well as can be repurposed at different locations.


200 201 CONCLUSION CONCLUSION BIO_BOT 2.0 BIO_BOT 2.0
Fig. 144. Connection to footing
Fig. 143. Finite element analysis
MORPHOLOGICAL NETWORK DEVELOPMENT


202 203 GREEN NETWORK DEVELOPMENT GREEN NETWORK DEVELOPMENT BIO_BOT 2.0 BIO_BOT 2.0
DLA MORPHOLOGY


After the functional distribution mapping of the Soho square, the major functions were generated as production of biofuel energy and electricity. To achieve the biobot network morphology to fulfil this function, sequential environmental DLA as a methodology for network growth was formulated, while achieving the environmental design goals. The achieved design goals were outputted through colour indication generated as a count, as biobot’s location was snapped to the unit voxel with high weights associated to the environmental goals. Hence, the achievement of environmental design goals could be quantified and measured further for the selection of the most optimised network. Colour associated with the environmental goal with highest degree of fulfilment was assigned to the biobot, which facilitated the further classification of biobot typology distribution across the Production and Collection network morphologies to be generated in the Soho Square.


204 205 GREEN NETWORK DEVELOPMENT GREEN NETWORK DEVELOPMENT BIO_BOT 2.0 BIO_BOT 2.0
DLA MORPHOLOGY

To generate the DLA design morphology network experiment methodology was set up, to optimise singular environmental design goals for extreme environmental conditions and to optimise for cumulative environmental parameters. Since, biobot morphology has been developed for a flexible kit of parts thereby, manual displacement of biobot from one high risk zone to another high risk zone could be conducted in case of extreme environmental response generation. The first network was generated by prioritisation of environmental design goal that is to cast maximum shaded region on ground, thereby through voxels under high sun vector hits. The generated network was spread across creating more canopy regions, concluded through visual comparison figure x. The second network was generated for the prioritisation of green tissue proximity, low heighted morphologies with connection to ground was generated,concluded through visual comparison. Fissure x the third network was generated for the prioritisation of vertical connections to unlikely pedestrian paths leading to heighted morphology, as noticed through visual comparison figure x. The fourth network was generated for the of obstruction of wind vector hits, highly pitched morphologies were generated for wind regulation, as observed through visual comparison. Further, network was generated as all goals were prioritised at the same time, it was observed that morphological growth was informed by the sun vector hit parameter and wind vector hit parameter.

206 207 GREEN NETWORK DEVELOPMENT GREEN NETWORK DEVELOPMENT BIO_BOT 2.0 BIO_BOT 2.0


208 209 GREEN NETWORK DEVELOPMENT GREEN NETWORK DEVELOPMENT BIO_BOT 2.0 BIO_BOT 2.0


210 211 GREEN NETWORK DEVELOPMENT GREEN NETWORK DEVELOPMENT BIO_BOT 2.0 BIO_BOT 2.0


212 213 GREEN NETWORK DEVELOPMENT GREEN NETWORK DEVELOPMENT BIO_BOT 2.0 BIO_BOT 2.0
Further, network was generated as all goals were prioritised at the same time, it was observed that morphological growth was informed by the sun vector hit parameter and wind vector hit parameter.


214 215 GREEN NETWORK DEVELOPMENT GREEN NETWORK DEVELOPMENT BIO_BOT 2.0 BIO_BOT 2.0


PRODUCTION POD_Zone A
The production pods constituted of x alga bots, y Alga_terra bots, z terra_bots
The production pods were formulated for the production of biofuel and solar voltaics as a response to the environmental degradation, high heat island effect, high carbon levels, and low green coverage in Soho Square formulated through functional distribution mapping. The architectural implication was detailed as a third public space, where mechanical user interaction with the biobots induces functionality and enhances performance of the system. As a part of the urban participatory scheme, as soon as an architectural resolution for a high risk node is developed, a notification is generated, circulated through a digital application, to alert the citizens and induce participation through organisation of voluntary events for biobot assembly. As a certain required participation is reached, biobots are supplied to the site, facilitated with a kit of parts and the user manual for assembly on site. The communal activity creates the first level of social interaction amongst humans. Once the biobots are assembled on the site, facilitated with required raw supply, the functioning of the pod is set to begin, where biobots respond to nature A daily basis mechanical user interaction is induced through digital indications to human users designed to benefit their health. The biobots also house sensors to monitor the real time changes in the environment, which is translated into digital information for the users to indicate manual movement of the biobots to the new high risk zone. This feedback loop is repeated until the biobots reach their threshold for replacement by the end of two years for a worse case scenario. Hence, the production pods were further detailed in two categories majorly constituting Alga_bots and Terra_bots.
220 221 CONCLUSION CONCLUSION BIO_BOT 2.0 BIO_BOT 2.0
PRODUCTION POD 1
The production pod 1 consisted of Alga bots, Alga_terra bots, and Terra_bots. The main singular function of this pod was defined as the production of biofuel from algae as a global aim. The functioning of the pod is informed by the seasonal and temporal cycles, and different levels of user interaction that can be defined as the loop of sequential interaction.

The main functioning of the biofuel pod is based on utilising human mechanical energy to convert algae into biofuel for production of electricity. According to research if 60 humans cycle a mechanical bike for 60 mins continuously 553 kwh can be produced, which can be utilised further. Therefore, bio-bots are installed with a system of open air mechanical bicycle assembly to generate the same effect. The circulation loop starts as liquid algae is supplied to the algae containers in biobots, which is further circulated in the alga_bots. The algae pipelines in alga_ bots are interconnected with a syphon system, attached to a mechanical motor in the bicycle for the circulation of algae. The circulation of algae is important to aid continuous photosynthesis, thereby absorbing CO2 from the atmosphere and diffusing O2 back into the environment The biobots produce hourly signals through light sensors to indicate the due need for circulation of algae which is notified to passers by either through visual signal or through digital application. The users can voluntarily interact with the production pod by using the mechanical bikes for algae circulation on an hourly basis. In scenarios when there is no available user interaction, the alga-bot assembly relies on its stored energy to continue circulation; ensuring the algal bloom cycle is not disrupted. 19132.39 kwh can be used to power 635 households using algal harvesting.

222 223 CONCLUSION CONCLUSION BIO_BOT 2.0 BIO_BOT 2.0
Fig. 145. Identification of which bio-bot distributions have been implemented
Fig. 146. Color distribution reprsentation of achieved environmental goals obtained after network geneartion
Fig. 147. Assigning required biobots to corresponding environmental parameter as Alga_Terra bots for production of biofuel through public user interaction


224 225 CONCLUSION CONCLUSION BIO_BOT 2.0 BIO_BOT 2.0
Fig. 148. Machine assembly of participatory cycling scheme to power algal biofuel extraction
ALGAL TRANSPORTATION CYCLE

Upon extracting the algal bloom, the liquids must be collected and sent out for chemical extraction. Therefore, depending on the quantity of algal-bots in various scenarious, the appropriate transportative method should be chosen to avoid increasing carbon into the scenario. Options for consideration have been volunteers of the participation scheme who are en route out of Central London and will be passing location drop offs along the way and tankers which are servicing local stations nearby and can collect the algae to refuel. Furthermore, given that large-scale algal harvesting has not as of yet been commercialised in London, given the carbon emission created by implementing algae as biofuel should be a positive indication that they will shortly be a part of decarbonisation scenarios.

226 227 CONCLUSION CONCLUSION BIO_BOT 2.0 BIO_BOT 2.0
Fig. 149. Algal to bio-fuel transportation cycle


228 229 CONCLUSION CONCLUSION BIO_BOT 2.0 BIO_BOT 2.0
Fig. 150. Signal indication for circulation of algae after every one hour
Fig. 151. Signal indication for churning of algae to algal oil for biofuel generation in every 15 days
Fig. 152. Section throuh the algal pod identifying a modular column which instantiates the collection via shut off-valve
A photosynthetic cycle completes after every 15 days , where the algae is converted into algal oil, ready to begin the process of conversion into biofuel to generate electricity. This process requires more mechanical energy, hence, more man power for churning. This process is brought into execution through mass mechanical biking events being conducted signalled through alarming visual or digital notification. This event ensures all algae oil has been properly separated from its liquid suspension and drains the entire system into tanks to be transported off-site. Commonly referred to as ‘green crude’ the algae oil goes through a process of transesterification which ultimately results in the production of biodiesel. If churned for x hours at x rate production pod 1 can produce x electricity enough to light 300 households.The biobots also house sensors to monitor the real time changes in the environment such as change in sunhour radiations for alga_bots to recieve more sunlight, or create more shaded region on the ground , which is further translated into digital information for the users to indicate manual movement of the biobots to the new high risk zone.The biobots are repaired or replaced in every two years based on their real time condition.


230 231 CONCLUSION CONCLUSION BIO_BOT 2.0 BIO_BOT 2.0
Fig. 153. Real time sunhour radiation mapping by biobot sensors to signal re-assembly to create shade in summers
Fig. 154. Real time sunhour radiation mapping through biobot sensors to signal re-assembly to create sun exposure in winters, while Alga_bots indicating higher placement to recieve maximum sunlight


PRODUCTION POD 2

The production pod 2 consists majorly of terra_bots. The main singular function of this pod was defined as the production of moss voltaics through Terra_bots to generate electricity. The functioning of the pod is informed by the seasonal and temporal cycles Firstly, the biobots are installed on the site through communal participation activity. After this installation process, the terra_bots are planted with a layer of hydrogel, moss and an electricity conducting metal plate consisting of anode and cathode, attached to electricity conducting metal wires and a socket to create charging points. This assembly is installed as a network of interconnected Terra_bots. As the photosynthesis begins, Co2 is absorbed by the moss from the atmosphere in the presence of sunlight, as a result glucose is generated through the roots in the hydrogel. The glucose is broken down into ions e- with the help of attached cathode and anode plate to the moss assembly. This further generates electricity, stored in mini transformers, when this cycle completes, a signal is created through sensors which is notified to passers by either through visual signalling or through digital application serving as electricity charging pods amidst urban chaos while thermoregulating the otherwise heated urban space. The biobots also house sensors to monitor the real time changes in the environment such as sunhour radiations which is translated into digital information for the users to indicate manual movement of the biobots to the new high risk zone.The biobots are repaired or replaced in every two years based on their real time condition.

236 237 CONCLUSION CONCLUSION BIO_BOT 2.0 BIO_BOT 2.0
Fig. 157. Bio-bot identification located within production pod 2
Fig. 155. Color distribution representation of achieved environmental goals obtained after network generation
Fig. 156. Assigning biobots corresponding to required environmental parameters constituting of Terra_bots for moss voltaics intervened to be used as electric power stations by public
MOSS CALCULATIONS

Voltaic approximations have been made accroding to the research set out by the Institute of Advanced Research in California, identified in Figure 19.
If utilised at full capacity, their experiment has shown that one 100mm x 100mm surface of moss is capable of producing 0.35 volts of electricity upon establishing its growth on the substrate. Furthermore, by identifying continuous exposed surfaces of the network in Figure 160, it is possible to maxmise the detailing of this function; a continuous bed of hydrogel substrate can improve the collection of voltaic collection given that moss grows faster when it is planted densly over sparse.


238 239 CONCLUSION CONCLUSION BIO_BOT 2.0 BIO_BOT 2.0
Fig.158. Moss development on Terra_bot modules through the duration of two months minimium
Fig. 159. Indication for electricity production by ionic action as a result of photosynthesis in moss :Terra_bots.
Fig. 122. Buildings as obstacles
Fig. 160. Section through moss voltaics generating electicity to be inserted back into the existing infrastructural grid


240 241 CONCLUSION CONCLUSION BIO_BOT 2.0 BIO_BOT 2.0
Fig. 161. Tracking of teporal changes against production pod 2, varying exposure of sunlight which throughout the day can be collected in order to self-iluminate the pods, provide light to other functions which need vegetative light and tie back into the existing grid


242 243 CONCLUSION CONCLUSION BIO_BOT 2.0 BIO_BOT 2.0
Fig. 162. Real time outdoor heat comfort mapping by biobot sensors to signal re-assembly
Fig. 164. Real time outdoor heat comfort mapping by biobot sensors to signal re-assembly
Fig. 163. Real time sunhour radiation mapping through biobot sensors to signal re-assembly to create pockets of shaded regions for moss_Terra_bots

COLLECTION POD
The collection pod consists of Terra_bots, Flora_bots for moss and plantation growth, Hydra_ bots for collection and circulation of water, and Osmo_bots for capture of pollen seeds to induce cross-pollination The major function of the collection pods is to maintain green tissue continuity, facilitate plant growth in dense urban regions in order to significantly reduce the heat island effect and create green public space. The collection pods have been incorporated as a horticultural communal involvement initiative where voluntary participation will be instilled across users for 10 biobots each through the urban environmental scheme. After the installation process, users can participate and book their place through digital medium to maintain 10 biobots each, where users can plant a seed in the biobot and keep track of its growth and harvesting cycle through sensor based response generated on the digital platform. The biobots also facilitate particularly growth of plant species that attract bees and butterflies for cross pollination. This interactive intervention serves as a platform to induce social interaction amongst urban users, botanists, and environmental enthusiasts and inculcate a sense of civic responsibility. The biobots are repaired or replaced every two years based on their real time condition. Furthermore, as identified in Fig. xx, annual, perennial, and biennial vegetation are identified for the planting strategy. This is to ensure that at all moments across seasonal changes, there is green vegetation. The seasonal distribution aids to identify cross-pollination on closer inspections; making note of which plant species have spread to other Flora-bots.


246 247 CONCLUSION CONCLUSION BIO_BOT 2.0 BIO_BOT 2.0
Fig. 167. Identification of bio-bots to be implemented witin the collection pod
Fig. 165. Color distribution representation of achieved environmental goals obtained after network generation
Fig.166. Assigning biobots corresponding to required environmental parameters constituting of Terra_bots, Flora_bots, Osmo_bots and Hydra_bots under collection category intervened through communal plantation scheme.


248 249 CONCLUSION CONCLUSION BIO_BOT 2.0 BIO_BOT 2.0
Fig.168. Flora_bots supporting plant and flower growth induced by cross pollination
Fig.169. Seasonal harvesting activity and exchange of botanical knowledge as a green third space activity
Fig.170. Real time sunhour radiation mapping by biobot sensors to signal re-assembly for maximum sunlight exposure to Flora_bots
Fig.171. Real time wind pressure mapping through biobot sensors to signal re-assembly to capture pollens, facilitated by wind flow by Osmo_bots.


250 251 CONCLUSION CONCLUSION BIO_BOT 2.0 BIO_BOT 2.0
Fig. 172. Detail of section for Osmo-bot to collect rainwater to diffuse among Flora-bots
Fig. 173. Detail of water-run off drawining into existing storm-water collection
Fig. 174. Temporal section series of establishment of vegetation and flora within the Flora-bot pod


252 253 CONCLUSION CONCLUSION BIO_BOT 2.0 BIO_BOT 2.0
Fig. 175. Combined detail of construction assembly continuation and green tissue growth
ZONE B SITE MORPHOLOGY MAPPING


254 255 CONCLUSION CONCLUSION BIO_BOT 2.0 BIO_BOT 2.0
Fig. 176. Isolation of interstitial space located inside site morphology of zone b
Fig. 177. Bio-bot identification located within production pod 2
For the intervention of the double skin facade based on the functional distribution output, a highly pollution prone region in Soho was identified. For the implementation of the biobot facade a commercial building in that region, functioning as a hotel, was selected as a study model for the same.

A three dimensional bounding volume of the commercial building model was populated with a cubic voxel grid of 1x1x1m each based on the biobot size.The three dimensional coordinates for each voxel are inputted as possible locations for the growth of biobots.


The newly defined aim for the growth of the network of biobots was based on identification and formulation of environmental parameters defined as design goals laid out as follows:
CREATE SHADED REGION ON THE FACADE AND THE GROUND
Each of the unit voxels from the 3-D voxel grid was subjected against the sun vector hits per annual climatic analysis of London, Based on the amount of sun vector hits per voxel, weights were assigned to each voxel. The voxels with maximum number of sun vector hits were assigned highest weights, in order to generate aggregations that could create maximum solar shading. The weights for each voxel were mapped through a coloured gradient of change as represented in Figure 179.
WIND VELOCITY REGULATION
Each of the unit voxels from the 3-D voxel grid was subjected against wind vector hits as per dominant annual wind direction that is Southwest to Northeast of London. Based on the amount of wind vector hits per voxel, weights were assigned to each voxel. The voxels with maximum number of wind vector hits were assigned highest weights, in order to generate aggregations that could encounter maximum wind vector hits to induce reduction in the wind speed and capture particulate matter in the air. The weights for each voxel were mapped through a coloured gradient of change as represented in Figure 180.
256 257 CONCLUSION CONCLUSION BIO_BOT 2.0 BIO_BOT 2.0
Fig. 179. Grid weighting for sun vector hits
Fig. 180. Grid weighting for wind vector hits
Fig.178. Real time wind pressure mapping through biobot sensors to signal re-assembly to capture pollens, facilitated by wind flow by Osmo_bots.
PROXIMITY TO GREEN TISSUE
The regions with green patches in the Soho square were mapped, Centroids for these green patches were generated and distances from the centroids to each of the unit voxels from the 3-D voxel grid was calculated. The voxels subjected to shorter distance were assigned higher weights and vice versa, to ensure growth in these regions to create continuous link with the green tissue.The weights for each voxel were mapped through a coloured gradient of change as represented in Figure 181.
IDENTIFICATION OF UNLIKELY PEDESTRIAN PATHS AND ATTACHMENT POINTS ON FACADE

As a part of urban analysis, most unlikely paths were crucial to be analysed to identify the voxel regions where the biobots could possibly be attached to the ground to avoid any hindrances with existing pedestrian patterns and in return shade the existing pedestrian paths. In order to analyse the pedestrian patterns on the voxel grid generated on the site. Transportation hubs in Soho were mapped and located in the voxel grid. These points were considered as the origin points of pedestrian traffic. Rays were cast from each transportation origin point to another transportation origin point simultaneously passing against each voxel on the site grid. Hence, voxel regions most likely to be under continuous pedestrian access were identified with maximum vector hits. The voxels with least vector hits were assigned highest weights and vice versa.The weights for each voxel were mapped through a coloured gradient of change as represented in figure x.Attachment points were extracted from building rules defined in the building code as mentioned earlier.
SPAWN POINTS AND ATTRACTOR POINTS
The highest weighted voxel for the Wind Velocity regulation, Proximity to Green Tissue, and high sun exposure are extracted as the sprouting points for the locations to generate spatial growth of network of biobots.The Attractor Points are extracted from the voxels with highest weights obtained from the most unlikely path analysis and attachment points on the facade according to building code of rules.

,envisioning spatial growth terminating at the ground line and building facade.

SPAWN
WEIGHTS
The spawn weights are input as the quantity of biobots to be generated at the Spawning locations- corresponding to the quantification performed in the functional distribution method. Sequential DLA is run to generate the biobot network iterations
258 259 CONCLUSION CONCLUSION BIO_BOT 2.0 BIO_BOT 2.0
Fig.181. Grid weighting for green tissue proximity
Fig.182. Grid weighting for unlikly paths
Fig.183. Cummulative grid weighting
DLA MORPHOLOGY
After the functional distribution mapping of the second zone commercial building, the major functions were generated as Collection of grey water, Filtration of pollen, and protection of plants and birds species. To achieve the biobot network morphology to fulfil this function, sequential environmental DLA as a methodology for network growth was formulated, while achieving the environmental design goals. The achieved design goals were outputted through colour indication generated as a count, as biobot’s location was snapped to the unit voxel with high weights associated to the environmental goals. Hence, the achievement of environmental design goals could be quantified and measured further for the selection of the most optimised network. Colour associated with the environmental goal with highest degree of fulfilment was assigned to the biobot, which facilitated the further classification of biobot typology distribution across the Filtration, Collection, and protection facade morphologies, indicated through function distribution colour gradient.


260 261 GREEN NETWORK DEVELOPMENT GREEN NETWORK DEVELOPMENT BIO_BOT 2.0 BIO_BOT 2.0
Fig. 184. Sequential DLA network development process


262 263 GREEN NETWORK DEVELOPMENT GREEN NETWORK DEVELOPMENT BIO_BOT 2.0 BIO_BOT 2.0
Fig. 185. Sequential DLA network development process for facade morphology


264 265 GREEN NETWORK DEVELOPMENT GREEN NETWORK DEVELOPMENT BIO_BOT 2.0 BIO_BOT 2.0
Fig. 186. Sequential DLA network maximising shadow on the ground
Fig. 187. Sequential DLA network maximising proximity to green tissue
Fig. 187. Sequential DLA network maximising wind vector hits
Fig. 188. Sequential DLA network maximising proximity to unlikely paths


266 267 GREEN NETWORK DEVELOPMENT GREEN NETWORK DEVELOPMENT BIO_BOT 2.0 BIO_BOT 2.0
Fig. 189. Sequential DLA network maximising shadow on the ground
Fig. 191. Sequential DLA network maximising proximity to green tissue
Fig. 190. Sequential DLA network maximising wind vector hits
Fig. 192. Sequential DLA network maximising proximity to unlikely paths


268 269 GREEN NETWORK DEVELOPMENT GREEN NETWORK DEVELOPMENT BIO_BOT 2.0 BIO_BOT 2.0
Fig. 193. Sequential DLA network maximising shadow on the ground; aerial and street view
Fig. 195. Sequential DLA network maximising proximity to green tissue; aerial and street view
Fig. 194. Sequential DLA network maximising wind vector hits; aerial and street view
Fig. 196. Sequential DLA network maximising proximity to unlikely paths
DLA MORPHOLOGY

To generate the DLA design morphology network experiment methodology was set up, to optimise singular environmental design goals for extreme environmental conditions and to optimise for cumulative environmental parameters. Since, biobot morphology has been developed for a flexible kit of parts thereby, manual displacement of biobot from one high risk zone to another high risk zone could be conducted in case of extreme environmental response. The first network was generated by prioritisation of the environmental design goal that is to cast maximum shaded region on ground, thereby through voxels under high sun vector hits. The generated network was spread across creating more canopy regions, concluded through visual comparison Figure 186-88. The second network was generated for the prioritisation of green tissue proximity, low heighted morphologies with connection to ground was generated,concluded through visual comparison. Figure 188 the third network was generated for the prioritisation of vertical connections, and connections to unlikely pedestrian paths land more increase density of connection to facade leading to dense heighted facade morphology, as noticed through visual comparison Figure 195. The fourth network was generated for the obstruction of wind vector hits, highly pitched morphologies were generated for wind regulation, as observed through visual comparison. Further, network was generated as all goals were prioritised at the same time, it was observed that morphological growth was informed by the sun vector hit parameter and wind vector hit parameter the most.


270 271 GREEN NETWORK DEVELOPMENT GREEN NETWORK DEVELOPMENT BIO_BOT 2.0 BIO_BOT 2.0
Fig. 197. Network generated through cumulative environmental parameters
FILTRATION FACADE ZONE_B

For the intervention of the double skin facade based on the functional distribution output, a highly pollution prone region in Soho was identified. For the implementation of the biobot facade a commercial building in that region, functioning as a hotel, was selected as a study model for the same. The number of biobots to be installed are obtained from the network generating algorithm, proposed to be installed by the building stakeholders while maintaining architectural restraints as mentioned earlier. The biobot facade acts as a green facade purposed to reduce the existing carbon footprint of the building to curb heat wastage due to excessive use of active cooling and heating equipment in summers and winters mainly due to drastic seasonal difference across London.

The use of concrete and steel as building material contributes to material heat emissions, hence, adding to the requirement of thermoregulation. Hence, the generated biobot facade consisted of Osmo_bots for the capture of soot particles from the air pollution caused by vehicles, Terra_bots to maintain green continuity, Hydra_bots to filter grey water from the building into the Flora_bot for plant growth .Outdoor and Indoor heat maps were generated before and after the application of the biobot network using the Honeybee | grasshopper engine. Timber properties were input as material properties for biobots, an increase in the difference between indoor and outdoor temperature was observed ranging across 5C during winter months and 10C during summer months

272 273 GREEN NETWORK DE GREEN NETWORK DEVELOPMENT BIO_BOT 2.0 BIO_BOT 2.0
Fig.198. Sunhour radiation before bio-bot network intervention Fig.199. Sunhour radiation after bio-bot network intervention


274 275 GREEN NETWORK DE GREEN NETWORK DEVELOPMENT BIO_BOT 2.0 BIO_BOT 2.0
Fig.202. Outdoor heat mapping before biobot network intervention ranging across 30-38 C during summer months
Fig.203. Outdoor heat mapping after biobot network intervention ranging across 25 -30 C during summer months
Fig.200. Color distribution representation of achieved environmental goals obtained after network generation
Fig.201.Assigning biobots corresponding to required environmental parameters for filtration facade constituting of Osmo_bots, Flora bots, Terra_bots and Hydra_bots
DETAILING
The detailing of the bio-bot connection at the facade is designed simply as an anchor tie which is bolted by framed plate. The plate is aligned to the dimension of the brick coursework behind it to ensure that it is never just a single fastened connection but it goes through two layers. The intent is for there to be little indication that a biobot had ever been there after it has purfied and served its life cycle. The physical connnections to the facade are kept to to a necessary minimum. Furthermore, the integration of the Hydro-bot to facilitate channeling rain water from the parapet wall has been considered given that it could filter it through to flora-bots directly below.


276 277 GREEN NETWORK DE GREEN NETWORK DEVELOPMENT BIO_BOT 2.0 BIO_BOT 2.0
Fig. 204. Detail at sleeve joint Fig. 205. Detail at algal roof production Fig. 206. Detail at mid-height Fig. 207 Module attachment and elevation
ARCHITECTURAL FACADE CONSTRAINTS


In order to set further clarification to the constraints outlined for zone A, an in-depth look is taken into the architectural elements set as obstructions to the attachment of bio-bots in order to maintain conserved areas, dentify ownership of property, or the integration of specific bio-bot modules to perform within the architectural assembly; connection to roof drainage, creation of canopy above porticos, filtering of light above window frames (while leaving sightlines avoided) Figure 208.

278 279 GREEN NETWORK DE GREEN NETWORK DEVELOPMENT BIO_BOT 2.0 BIO_BOT 2.0
1. EXISTIING CONSERVED, TERRACED RESIDENTIAL, PROTECTED RESIDENTIAL, COMMERCIAL FACADES
4. INNER LAYER CONNECTED DIRECTLY TO FACADE
2. ARCHITECTURAL LIMITATIONS, OBSTRUCTIONS
5. OUTER LAYER GROWN ATOP FASTENED BIO-BOTS
A A ] [ B [ B [ C ] C ] D D
3. STRUCTURAL FRAMEWORK WITHIN 1M GRID LINE
Fig. 208. Architectural obstruction diagram


280 281 GREEN NETWORK DE GREEN NETWORK DEVELOPMENT BIO_BOT 2.0 BIO_BOT 2.0
-
Fig.209. Indoor heat mapping before the application of biobot facade net
work mapped as difference between indoor and outdoor temperatures in degree C.
Fig.212. Indoor heat map after the application of biobot facade network mapped as difference between indoor and outdoor temperatures in degree C.
Fig.210. Terra_bots facilitate moss growth for green tissue continuity and thermoregulaiton of building interior
Fig.213. pollen capture by filtration facade by Osmo_bots facilitates cross pollinated through plant species, while inducing soft material landing to avoid bird-glass collisions
Fig.211. Facilitation of user interaction with Flora_bot as induced ownership through plantation and harvesting of desired vegetation.
16.75 15.08 13.04 11.73 10.05 8.38 6.70 5.02 3.35 1.68 0.00
Fig.214. Surface absorption of soot particles by Osmo_bots
Fig.215. Diagram representing channelisation of gray water wastage through Hydra_bots
Fig.216. Real time wind pressure mapping through biobot sensors to signal re-assembly to capture pollens, facilitated by wind flow by Osmo_bots.
Through the process of rotation, the structure adapts itself for the most suitable spatial organisation according to the outer conditions be it the amount of sun, shadow or rain. To perform shading functions, the structure reorganises itself to better direct towards the sun to provide optimal shadowing. Vice versa, the moss-containing modules must turn against sunlight as moss grows in shadow. The model is a representation of the kinetic responsive behaviour of the structure, it has the ability to turn itself according to the signal received from the photo resistors. The Arduino microcontroller has been programmed to turn the motor according to the direction of the higher signal between two photoresistors directed in the opposite directions of one of the legs of the module, pointing the module toward the light source.
REAL-TIME ENVIRONMENTAL ADAPTATION
Real time environmental adaptation :
Through kinetic rotation, the biobots in the facade can cadapts themselves for the most suitable spatial organisation according to the environmental conditions be it the amount of sun, shadow or rain. To perform shading functions, the structure reorganises itself to better direct towards the sun to receive sunlight. The model is a representation of the kinetic responsive behaviour of the structure, it has the ability to turn itself according to the signal received from the photo resistors. The Arduino microcontroller has been programmed to turn the motor according to the direction of the higher signal between two photoresistors directed in the opposite directions of one of the legs of the module, pointing the module toward the light source.
Working Kinetic model
A working model of biobots to display kinetic movement was produced. The electrical hardware is hosted inside the module and therefore the motor is turning not the transparent tube coming out of the module, but the module itself while the tube stays stable. This occurs because the tube is being held inside of the leg of the module with the bearing and the connection to the motor through an additional 3d printed tube attached to the motor and transparent structural tube. Therefore the motor is turning itself rather than the tube. This helps the modules to be autonomous in the rotation behaviour and react separately from each other, organising the swarm system logic, and working on local and global scales differently according to the environmental conditions and functions of the specific modules.

282 283 GREEN NETWORK DE GREEN NETWORK DEVELOPMENT BIO_BOT 2.0 BIO_BOT 2.0
Fig.217. Kinetic prototype inner content Physical fabrication and assembly of structural core of biobot
DC motor
Photo resistor
Photo resistor
Resistor 1kOhm
Resistor 1kOhm
Motor driver chip
Arduino Uno


284 285 GREEN NETWORK DE GREEN NETWORK DEVELOPMENT BIO_BOT 2.0 BIO_BOT 2.0
Fig.218. Physically fabricated working model of the core of biobot employing arduino and its tools
Fig.219. Simulation of bio-bot modules showing kinetic variability
GREEN BELT
Intervention through urban intercises were investigated throughout the course of the proposal. However, it is only by interjecting it within a unbuilt environment that it can truly be assessed for longevity.
“We’re all—trees, humans, insects, birds, bacteria—pluralities. Life is embodied network. These living networks are not places of omnibenevolent Oneness. Instead, they are where ecological and evolutionary tensions between cooperation and conflict are negotiated and resolved. These struggles often result not in the evolution of stronger, more disconnected selves but in the dissolution of the self into relationship. Because life is network, there is no “nature” or “environment,” separate and apart from humans. We are part of the community of life, composed of relationships with “others,” so the human/nature duality that lives near the heart of many philosophies is, from a biological perspective, illusory.”126

286 287 GREEN NETWORK DE GREEN NETWORK DEVELOPMENT BIO_BOT 2.0 BIO_BOT 2.0
Fig. 220. Section through habitation pod in Green Belt
SPECIES HABITATION PODS


The species habitations pods are detailed regarding to the spatial requirements needed to sustuain outlined species in Figures 226-229. They are not fixed in a moment of time but are in a constant state of growth, decay and regrowth. Continuous green networks maintain the existing ecosystems, redefining the symbiotic synergy between human beings, living species and nature.They are not static. The development of a material with a determined decay rate thus satisfies the needs for interjecting species habitation pods within the Green Belt. At the maximum point of their decomposition, in Figure 232, the timber sponge tissue disintegrates into the landscape after having been overgrown by vegetation. The rhiozomotous species introduced in the plant taxononmy will retain some vegetation in place but what becomes left in the landscape is the timber arms, at which point they may be collected back into the next cycle of bio-bot construction.


288 289 GREEN NETWORK DE GREEN NETWORK DEVELOPMENT BIO_BOT 2.0 BIO_BOT 2.0
Fig. 221. Terra-bot bee and wasp habitation; by the establishing hives near planted wildflower flora or by chewing through sponge tissue as a substitue for pulp with wasp saliva
Fig. 222. Terra-bot insect and mushroom habitation; termite disintigration of sawdust layer cast in earth allows for natural decay to occur- recycling all collected pollens back into the ecosystem
Fig. 223. Terra-bot avon habitation; by the establishing of nests on moss substrate after some flora die out seasonally- dried reeds remain in place for birds
Fig. 224. Terra-bot fox habitation; generating overhanging enclosure for shelter while excavating below for fox den- faces of structural classing remain open to provide fox hole opening
Fig. 225. Terra-bot green tissue developemnet over 18 month period under favorable environmental conditions


290 291 GREEN NETWORK DE GREEN NETWORK DEVELOPMENT BIO_BOT 2.0 BIO_BOT 2.0
Fig. 226. Terra-bot species habitation: SCIURIDAE- squirrels, chipmunks, mice AGARICOMYCETES- mushrooms INSECTA- termites, tawny mining bees FUNGI
Fig. 227. Terra-bot species habitation: MAMMALI: foxes MUSTELIDAE: badgers, polecats


292 293 GREEN NETWORK DE GREEN NETWORK DEVELOPMENT BIO_BOT 2.0 BIO_BOT 2.0
Fig. 228. Terra-bot species habitation: INSECTA- butterflies, bees, wasps, beetles
Fig. 229. Terra-bot species habitation: CHIROPTER bats AVES- falcons, hawks, owls, song thrush, sparrows
 Fig. 230. Bio-bot habitation in the Green Belt; timeframe 8 months since intervention
 Fig. 231. Bio-bot habitation in the Green Belt; timeframe 16 months since intervention- subject to extreme climate change conditions

-
Fig. 232. Bio-bot habitation in the Green Belt; timeframe 24 months since intervention- reintegration into de
cay cycle of surrounding flora
CONCLUSION
The breadth of subjects needed to understand the dynamic and temporal changes of an environmentally-grown green tissue intervention is significantly vaster than the semantics of proposing a green tissue network for humans and species which sustainably acts as purification and habitat. The former needs meticulous sifting of information to draw connective lines of eco-consequences while the latter details a more specific and typical scale: how does the bio-bot make contact with the ground, at what quantity of growth does it become ‘architectural’ and can it become a new type of green wall system? Drawing constructive ties between all of these proved to be challenging over the entire process of design. In proposing a ‘grown’ network development which needed to take its cues from biological growth, the decision to incorporate environmental diffusion-limited aggregation as a methodology technique.
The picturesque landscape style of the mid-eighteenth century which developed into landscape gardening techniques has British origins; utilising composition to create natural landscape. It should bring to mind the vastness and beauty of green tissue without seeming too chaotic- in other words a meticulous pruning. Humans have always claimed to coexist with nature but only if it conforms with their preferences. Hemenway writes, “the average yard is both an ecological and agricultural desert. The prime offender is short-mown grass, which offers no habitat and nothing for people except a place to sit, yet sucks down far more water and chemicals than a comparable amount of farmland,” but isn’t modern society conditioned to prefer a neatly trimmed front yard? Therefore, the irony in proposing a network development of green tissue with environmental parameters of growth is contradictory to genealogy of the historically picturesque, while ‘picturesque’ in the eyes of the bio-bot team. Furthermore, if the integration of the network in areas of high pollution could be instated as council policy, it would not open the conversation to aesthetic opinion but rather health strategem.
The research focused on magnifying fragmentation of landscape as an instigator of urban disruption. While it was conceived as a network design which stretches from the Green Belt towards urban centers, it did not acknowledge what the potential differences could be conceived if it were designed in reverse. While the execution of the network growth and detailing could consist of the same computation parameters, real-time climatic information and modular structure it would be philosophically and ethically jarring to propose that the disruption of species encroachment in urban centers merits a dissertation to push the animals back out, by leaving a network of modular attachment to guide them out. It essentially capsizes the argument from moral environmental responsibility to urban comfortability; which is to say design up until this moment.
The concept of species integration in design sets up an elephant in a London flat problem- everything designers know about habitation can only be extracted and deduced. A bee cannot be surveyed and asked what the most amenable distance between two wildflower patches might be and yet at the same time it is not complete over-dramatisation in biologist E.O. Wilson’s point: “If all mankind were to disappear, the world would regenerate back to the rich state of equilibrium that existed ten thousand years ago. If insects were to vanish, the environment would collapse into chaos.” And to be contextualised in a not dissimilar way by cultural theorist Žižek, our freedom, control over nature, and survival is predicated on stable climatic parameters such as thermal comfort and air quality. “We can ’do what we want’ only insofar as we remain marginal enough, so that we don’t seriously perturb the parameters of life on Earth. The palpable limitation of our freedom imposed by ecological disturbances is the paradoxical outcome of the exponential growth of our freedom and power. He goes on to mention that humans feel dependent to their visceral guilt over climate change to feel control as ecological saviors. Hence we ‘recycle old paper, we buy organic food, we install long-lasting light bulbs – whatever – just so we can be sure that we are doing something.’ But this proposal, if further reflected on, provides society with the viable information, kit-of-parts, instruction pamphlet and site to assemble the bio-bots. What is lacks is guilt as motivation: relying instead on Kant’s ought implies can. And no matter how many drawings of architectural detailing as justification for conception, it may only ever percolate as philosophical discussion.
At the start of the application process for this postgraduate programme, The calculated atmospheric co2 count was 415 ppm.
It is currently at 420 ppm, the highest recorded historical level, yet. 127
300 301 CONCLUSION CONCLUSION BIO_BOT 2.0 BIO_BOT 2.0
ENDNOTES
133. Haskell, David George, The Song of Trees: Stories from Nature’s Great Connectors (Viking, 2017).
134. Change, “Carbon Dioxide Concentration | NASA Global Climate Change.”
135. “‘O Earth, Pale Mother!’”
302 303 DOMAIN CHAPTER DOMAIN CHAPTER BIO_BOT 2.0 BIO_BOT 2.0
BIBLIOGRAPHY
25yearenvironmentplan@defra.gsi.gov.uk. “A Green Future: Our 25 Year Plan to Improve the Environment,” 2022 1995. https://assets.publishing.service.gov.uk/government/uploads/system/uploads/attachment_data/file/693158/25-year-environment-plan.pdf.
“Air Pollution and the Effect on Our Health London Councils.” Accessed September 16, 2022. https:// www.londoncouncils.gov.uk/node/33227.
“Albedo - an Overview ScienceDirect Topics.” Accessed August 11, 2022. https://www.sciencedirect.com/ topics/engineering/albedo.
Al-Haj Ibrahim, Hassan. “Introductory Chapter: Pyrolysis.” In Recent Advances in Pyrolysis, edited by Hassan Al- Haj Ibrahim. IntechOpen, 2020. https://doi.org/10.5772/intechopen.90366.
Anguselvi, Vetrivel, Reginald Ebhin Masto, Ashis Mukherjee, and Pradeep Kumar Singh. CO2 Capture for Industries by Algae. Algae. IntechOpen, 2019. https://doi.org/10.5772/intechopen.81800.
Armstrong, Rachel. Soft Living Architecture; An Alternative View of Bio-Informed Practice. London: Bloomsbury Publishing Plc, 2018.
Asworth, James. “Bees, Butterflies and Moths ‘confused’ by Air Pollution,” January 24, 2022. https://www. nhm.ac.uk/discover/news/2022/january/bees-butterflies-and-moths-confused-by-air-pollution.html#:~:text=Air%20pollution%20obscures%20the%20sweet,by%20as%20much%20as%2031%25.
Barlow, Peter W. Differential Growth in Plants. Oxford, New York: Pergamon Press, 1989.
Bishop, Peter. “Repurposing the Green Belt in the 2st Century,” n.d., 185.
Borges, Jorge Luis. The Garden of Forking Paths. Penguin Random House UK, 2018.
Bryce, Emma. “Global Study Reveals the Extent of Habitat Fragmentation.” Audubon, March 20, 2015. https://www.audubon.org/news/global-study-reveals-extent-habitat-fragmentation.
Burke, James Lee. In the Moon of Red Ponies. Billy Bob Holland 4. Simon & Schuster, 2004. “Can a Moss Culture Really Clean Urban Air?,” November 22, 2017. https://www.greenhomegnome.com/ moss-clean-urban-air/.
Carlow, Vanessa Miriam, and Yeon Wha Hong. “London Green Belt: From a Landscape for Health to Metropolitan Infrastructure.” In Proceedings of 8th Conference of the International Forum on Urbanism (IFoU), 755–64. Incheon, Korea: MDPI, 2015. https://doi.org/10.3390/ifou-E003.
Cassar, Louis F. Landscape and Ecology : The Need for a Holistic Approach to the Conservation of Habitats and Biota. Routledge, 2018. https://www.um.edu.mt/library/oar/handle/123456789/86664.
Change, NASA Global Climate. “Carbon Dioxide Concentration | NASA Global Climate Change.” Climate Change: Vital Signs of the Planet. Accessed July 20, 2022. https://climate.nasa.gov/vital-signs/carbon-dioxide.
Chowdhury, Zaira Zaman, Md. Ziaul Karim, Muhammad Aqeel Ashraf, and Khalisanni Khalid. “Influence of Carbonization Temperature on Physicochemical Properties of Biochar Derived from Slow Pyrolysis of Durian Wood (Durio Zibethinus) Sawdust.” BioResources 11, no. 2 (February 17, 2016): 3356–72. https:// doi.org/10.15376/biores.11.2.3356-3372.
GOV.UK. “Concentrations of Nitrogen Dioxide.” Accessed August 10, 2022. https://www.gov.uk/government/statistics/air-quality-statistics/ntrogen-dioxide.
GOV.UK. “Concentrations of Particulate Matter (PM10 and PM2.5).” Accessed August 10, 2022. https://www.gov.uk/government/statistics/air-quality-statistics/concentrations-of-particulate-matter-pm10-and-pm25.
Cousins, Stephen. “Carbon-Eating Bio Curtains – the Answer to City Pollution?” RIBA, August 19, 2019.
BIBLIOGRAPHY
https://www.ribaj.com/products/carbon-capture-pollution-eating-algae-filled-curtains-bio-plastics-photosynthetica-ecologicstudio.
Cruz, Marcos, and Richard Beckett. “A Novel Approach towards Bio-Digital Materiality.” Bartlett School of Architecture; University College London, n.d., 20.
“Deep Green,” n.d. https://www.ecologicstudio.com/projects/deep-green-urbansphere-venice. MIT AI Laboratory. “Diffusion Limited Aggregation,” n.d. http://www.ai.mit.edu/projects/im/broch/.
Doordan, Dennis. “Neri Oxman: Material Ecology.” Design Issues, January 1, 2021. https://www.academia. edu/45382106/Neri_Oxman_Material_Ecology.
Easterling, Keller. “Landscapes, Highways, and Houses in America.” In Organization Space, 25–34. Cambridge, Mass..: MIT Press, 1999.
Elledge, Jonn. “Loosen Britain’s Green Belt. It Is Stunting Our Young People.” The Gardian, September 22, 2017. https://www.theguardian.com/commentisfree/2017/sep/22/green-belt-housing-crisis-planning-policy.
Ewers, Robert M., and Cristina Banks-Leite. “Fragmentation Impairs the Microclimate Buffering Effect of Tropical Forests.” PLoS ONE 8, no. 3 (March 4, 2013): e58093. https://doi.org/10.1371/journal. pone.0058093.
“Experiencing Innovative Biomaterials for Buildings: Potentialities of Mosses Elsevier Enhanced Reader.” Accessed July 18, 2022. https://doi.org/10.1016/j.buildenv.2020.106708.
Frey, Darrell. Bioshelter Market Garden: A Permaculture Farm. New Society Publishers, 2010. https://www. perlego.com/book/566670/bioshelter-market-garden-a-permaculture-farm-pdf.
Gould, Stephen Jay, Larry. “The Flamingo’s Smile: Reflections in Natural History,” Reversals, n.d. “Green Belt under Threat from 200,000 New Houses.” The Times, January 28, 2019. https://www.thetimes. co.uk/article/green-belt-under-threat-from-200-000-new-houses-lxp7zkkdr.
Gunnell, Kelly, Williams, Carol, and Murphy, Brian. Design for Biodiversity: A Technical Guide for New and Existing Buildings. RIBA Publishing, 2019. https://www.perlego.com/book/1522095/design-for-biodiversity-a-technical-guide-for-new-and-existing-buildings-pdf.
Hahn, Jennifer. “Blast Studio 3D Prints Column from Mycelium to Make ‘Architecture That Could Feed People,’” Dezeen, January 18, 2022. https://www.dezeen.com/2022/01/18/blast-studio-tree-column-mycelium-design/#.
Halsey, Thomas C. “Diffusion-Limited Aggregation: A Model for Pattern Formation.” Physics Today 53, no. 11 (November 2000): 36–41. https://doi.org/10.1063/1.1333284.
Haoyang, Cai. “Algae-Based Carbon Sequestration.” IOP Conference Series: Earth and Environmental Science 120 (March 1, 2018): 012011. https://doi.org/10.1088/1755-1315/120/1/012011.
Haskell, David George. The Song of Trees: Stories from Nature’s Great Connectors. Viking, 2017. Hebel, Dirk, and Felix Heisel, eds. Cultivated Building Materials: Industrialized Natural Resources for Architecture and Construction. Basel: Birkhäuser, 2017.
Holling, Crawford Stanley. “Resilience and Stability of Ecological Systems.” Annual Review of Ecology and Systematics, 1973, 1–23.
Hordern, Jane. “Carbon Capture Using Sawdust,” 2011. https://blogs.rsc.org/ee/2011/03/24/carbon-capture-using-sawdust/?doing_wp_cron=1658157492.9371159076690673828125.
“How Much Waste Is Produced From Renewables vs. Fossil Fuels? Green Journal,” June 30, 2020. https:// www.greenjournal.co.uk/2020/06/how-much-waste-is-produced-from-renewables-vs-fossil-fuels/.
304 305 DOMAIN CHAPTER DOMAIN CHAPTER BIO_BOT 2.0 BIO_BOT 2.0
BIBLIOGRAPHY
https://plus.google.com/+UNESCO. “The Unbearable Burden of the Technosphere.” UNESCO, March 27, 2018. https://en.unesco.org/courier/2018-2/unbearable-burden-technosphere.
Huang, Changjin, Zilu Wang, David Quinn, Subra Suresh, and K. Jimmy Hsia. “Differential Growth and Shape Formation in Plant Organs.” Proceedings of the National Academy of Sciences 115, no. 49 (December 4, 2018): 12359–64. https://doi.org/10.1073/pnas.1811296115.
IARC. “Wood Dust and Formaldehyde IARC Monographs on the Evaluation of Carcinogenic Risks to Humans Volume 62.” IARC Publications, 1995. https://publications.iarc.fr/80.
James Parkes. Buro Happold and Cookfox Architects Develop Living Facade for Birds and Insects, 2022. https://www.dezeen.com/2022/09/16/architectural-ceramic-assemblies-workshop-buro-happold-cookfox-architects-facade-design/.
Jorgensen, Anna, and Marian Tylecote. “Ambivalent Landscapes—Wilderness in the Urban Interstices.” Landscape Research 32, no. 4 (August 2007): 443–62. https://doi.org/10.1080/01426390701449802.
Junying Metal Manufacturing Co., Limited. “CNC Milling Guide – CNC Milling Advantages & Disadvantages, Application, Materials and Definition,” n.d. https://www.cnclathing.com/guide/cnc-milling-guide-cnc-milling-advantages-disadvantages-application-materials-and-definition.
Klegarth, Amy R. “Synanthropy.” In The International Encyclopedia of Primatology, 1–5. John Wiley & Sons, Ltd, 2017. https://doi.org/10.1002/9781119179313.wbprim0448.
The Expanded Environment. “Knowing the Synanthrope.” Accessed January 8, 2023. http://www.expandedenvironment.org/knowing-the-synanthrope/.
Laboratory, By Alan Buis, NASA’s Jet Propulsion. “Milankovitch (Orbital) Cycles and Their Role in Earth’s Climate.” Climate Change: Vital Signs of the Planet. Accessed July 20, 2022. https://climate.nasa.gov/ news/2948/milankovitch-orbital-cycles-and-their-role-in-earths-climate.
“Landscape Fragmentation Pressure in Europe.” Accessed September 16, 2022. https://www.eea.europa. eu/ims/landscape-fragmentation-pressure-in-europe.
Laurén, Susanna, and Biolin Scientific. “Surface and Interfacial Tension,” n.d., 8. Linke, Rebecca. “Additive Manufacturing, Explained.” MIT Management Sloan School, December 7, 2017. https://mitsloan.mit.edu/ideas-made-to-matter/additive-manufacturing-explained#:~:text=What%20 is%20additive%20manufacturing%3F,the%20final%20product%20is%20complete.
Liu, Dongjing, Weiguo Zhou, Xu Song, and Zumin Qiu. “Fractal Simulation of Flocculation Processes Using a Diffusion-Limited Aggregation Model.” Fractal and Fractional 1, no. 1 (November 18, 2017): 12. https:// doi.org/10.3390/fractalfract1010012.
“London Air Pollution,” n.d. https://globalcleanair.org/data-to-action/london-uk/.
“London Air Quality Network » Annual Pollution Maps.” Accessed September 16, 2022. https://www.londonair.org.uk/london/asp/annualmaps.asp.
“London Air Quality Network Guide.” Accessed August 10, 2022. https://www.londonair.org.uk/londonair/ guide/WhatIsNO2.aspx.
“London Set To Lose 48,000 Acres Of Its Local Countryside London Green Belt Council.” Accessed September 16, 2022. https://londongreenbeltcouncil.org.uk/london-set-to-lose-48000-acres-of-its-localcountryside/.
Lovera, Cristian Alejandro Silva. “THE INTERSTITIAL SPACES OF URBAN SPRAWL: THE PLANNING PROBLEMS AND PROSPECTS – THE CASE OF SANTIAGO DE CHILE.” University College London, The Bartlett School of Planning, September 2016, 332.
Machine Learning Researcher at Idiap. Data Science graduate from University of Bath. Former Intern at
BIBLIOGRAPHY
CERN. “Kohonen Self-Organizing Maps,” n.d. https://towardsdatascience.com/kohonen-self-organizing-maps-a29040d688da.
Madore, Jonathon. “How To Compost Sawdust.” Green Upside, n.d. https://greenupside.com/how-tocompost-sawdust/.
Madzaki, Hazimah, Wan Azlina Wan A.B. KarimGhani, NurZalikhaRebitanim, and AzilBahariAlias. “Carbon Dioxide Adsorption on Sawdust Biochar.” Procedia Engineering 148 (2016): 718–25. https://doi. org/10.1016/j.proeng.2016.06.591.
Mardianti, Ferriza Tri, Sukaton Sukaton, and Galih Sampoerno. “Benefit of Glycerine on Surface Hardness of Hybrid & Nanofill Resin Composite.” Conservative Dentistry Journal 11, no. 1 (June 30, 2021): 28. https://doi.org/10.20473/cdj.v11i1.2021.28-31.
McNaughtan Dugald. “Why Are Insects Important?” Wiltshire Wildlife Trust’s (WWT), 2022. https://www. wessexwater.co.uk/community/blog/why-are-insects-important#:~:text=breaking%20down%20and%20 decomposing%20organic,mammals%20consist%20of%20mainly%20insects.
Merleau-Ponty, Maurice. “Performative Acts and Gender Constitutions: An Essay in Phenomenology and Feminist Theory,” no. 4 (December 1988): 31–519.
“Minimizing Carbon Footprint via Microalgae as a Biological Capture Elsevier Enhanced Reader.” Accessed July 20, 2022. https://doi.org/10.1016/j.ccst.2021.100007.
IAAC. “Moss Voltaics - The Institute for Advanced Architecture of Catalonia.” Accessed January 9, 2023. https://iaac.net/project/moss-voltaics/.
“MosSkin: A Moss-Based Lightweight Building System | Elsevier Enhanced Reader.” Accessed July 18, 2022. https://doi.org/10.1016/j.buildenv.2022.109283.
In These Times. “‘O Earth, Pale Mother!’” Accessed January 8, 2023. https://inthesetimes.com/article/oearth-pale-mother.
OMAI. “A FIELD GUIDE TO PUBLIC SPACES Are We Making Inclusive Choices in the Design and Management of Public Spaces That Help Promote a Democratic Society?,” n.d.
“Online Atlas of the British and Irish Flora.” Accessed September 16, 2022. https://plantatlas.brc.ac.uk/. Orff, Kate. “Cohabit.” In Towards an Urban Ecology; Scape;, 81–138. The Monacelli Press, 2016. “Ought Implies Can | Ethics and Logic Britannica.” Accessed January 8, 2023. https://www.britannica. com/topic/ought-implies-can.
Pasquero, Claudia, and Marco Poletto. “Steam Cloud V2.0 by EcoLogicStudio,” 2008. https://www.ecologicstudio.com/projects/stemcloud-seville-art-and-architecture-biennale-2008.
Pettit, T., P. J. Irga, P. Abdo, and F. R. Torpy. “Do the Plants in Functional Green Walls Contribute to Their Ability to Filter Particulate Matter?” Building and Environment 125 (November 15, 2017): 299–307. https:// doi.org/10.1016/j.buildenv.2017.09.004.
Mongabay Environmental News. “Playing the Long Game: ExxonMobil Gambles on Algae Biofuel,” July 6, 2021. https://news.mongabay.com/2021/07/playing-the-long-game-exxonmobil-gambles-on-algae-biofuel/.
Postman, Neil. Technopoly: The Surrender of Culture to Technology. Vintage, 1993. Rajur, Vinay Sharanappa. “Modeling Diffusion Limited Aggregation,” 2015. https://doi.org/10.13140/ RG.2.1.4269.3283.
“Retrofitting-Soho-05-Main-Report-Chapter-2-P21-26-241208s.Pdf.” Accessed August 12, 2022. https:// www.westminster.ac.uk/sites/default/public-files/general-documents/Retrofitting-Soho-05-Main-Report-Chapter-2-p21-26-241208s.pdf.
306 307 DOMAIN CHAPTER DOMAIN CHAPTER BIO_BOT 2.0 BIO_BOT 2.0
BIBLIOGRAPHY
Scott, Bernard. “Second-order Cybernetics: An Historical Introduction.” Kybernetes 33, no. 9/10 (October 1, 2004): 1365–78. https://doi.org/10.1108/03684920410556007.
Shepherd, Marshall. “Carbon, Climate Change, and Controversy.” Animal Frontiers 1 (July 1, 2011): 5–13. https://doi.org/10.2527/af.2011-0001.
“Spiralling Energy Prices Will Turn the UK’s Cost-of-Living Crisis into a Catastrophe • Resolution Foundation.” Accessed January 9, 2023. https://www.resolutionfoundation.org/comment/spiralling-energy-prices-will-turn-the-uks-cost-of-living-crisis-into-a-catastrophe/.
Spyropoulos, Theodore. “Constructing Participatory Environments: A Behavioural Model for Design.” Thesis (Doctoral), UCL (University College London), 2017. https://discovery.ucl.ac.uk/id/eprint/1574512.
National Energy Action (NEA). “Supporting Vulnerable Energy Customers through the Energy Crisis.” Accessed January 8, 2023. https://www.nea.org.uk/energy-crisis/supporting-vulnerable-energy-customers-through-the-energy-crisis/.
“The Sun’s Impact on the Earth,” December 4, 2019. https://public.wmo.int/en/sun%E2%80%99s-impact-earth.
Till, Caroline, and Kate Franklin. Exhibiton “Our Time on Earth” Barbican International Enterprises; Co-Produced by Musée de La Civilisation, Québec City, Canada. n.d.
“Tiny Algae and the Political Theater of Planting One Trillion Trees.” Accessed July 20, 2022. https://parametric.press/issue-02/algae/.
Turton, Polly. “Urban Heat Risk Mapping and Visualisation in London,” n.d., 23.
Ulgiati, Sergio, and Amalia Zucaro. “Challenges in Urban Metabolism: Sustainability and Well-Being in Cities.” Frontiers in Sustainable Cities 1 (May 16, 2019): 1. https://doi.org/10.3389/frsc.2019.00001.
“Urban Foxes | Royal Borough of Kensington and Chelsea.” Accessed January 8, 2023. https://www.rbkc. gov.uk/environment/environmental-health/urban-foxes.
US EPA, OAR. “Basic Information about NO2.” Overviews and Factsheets, July 6, 2016. https://www.epa. gov/no2-pollution/basic-information-about-no2.
Vizzuality. “Greater London, England, United Kingdom Deforestation Rates & Statistics | GFW.” Accessed September 16, 2022. https://www.globalforestwatch.org/dashboards/country/GBR/1/36.
Wark Barry. “Bioplastic Tectonic,” 2021. https://www.barrywark.com/bioplastic.
British Politics and Policy at LSE. “Why Have Energy Bills in the UK Been Rising?,” October 20, 2022. https:// blogs.lse.ac.uk/politicsandpolicy/why-have-energy-bills-in-the-uk-been-rising-net-zero/. Xie, Yufan. “Differential Growth Research.” U-V-N (blog), August 23, 2017. http://uvnlab.com/differential-growth-research-en/.
Yatim, Nurulshyha Md, and Nur Izzatul Afifah Azman. “Moss as Bio-Indicator for Air Quality Monitoring at Different Air Quality Environment.” International Journal of Engineering and Advanced Technology 10, no. 5 (June 30, 2021): 43–47. https://doi.org/10.35940/ijeat.E2579.0610521.
308 309 DOMAIN CHAPTER DOMAIN CHAPTER BIO_BOT 2.0 BIO_BOT 2.0
310 311 APENDIX APENDIX BIO_BOT 2.0 BIO_BOT 2.0
APENDIX
EVOLUTIONARY OPTIMISATION
The result of the algorithm produced 1000 phenotypes solutions with three fitness values per solution, totalling 3000 values. Although the simulation performed well towards optimisation of the solutions, it produced a significant number of variations struggling to optimise towards Fitness criteria 1. From the Pareto Front solutions (Fig.71), it can be observed that the simulation produced a high number of individuals with repeated values which decreased the variation within produced phenotypes. The high level of visual geometrical variation was observed only in the simulation’s early stages, which rapidly converged into optimised values due to the low number of genes informing the morphological alterations. The visual analysis of the Pareto Front solutions shows that there are a limited number of phenotypes with intersecting geometries, which can be considered as a sign of a successful simulation.

EVOLUTIONARY OPTIMISATION


Fitness criteria 1 (FC1)- the most optimised phenotype evolved from generation 22 individual 2 (G22I2).

The criteria was formulated to equalise the sun exposure on the morphology surfaces. The simulation produced 53 phenotypes with rank 0 for FC1.
Fitness criteria 2 (FC2)- the most optimised phenotype evolved from generation 49 individual 2 (G49I2).


The criteria was set to maximise the number of pockets which should hold plants in position. The simulation produced 61 phenotypes with rank 0 for FC2. The post analysis shows that individuals with high performance of FC2 have geometrical issue, particularly the intersection of some of the geometries

Fitness criteria 3 (FC3)- the most optimised phenotype evolved from generation 29 individual 1 (G29I1)
The criteria was set as a parameter that should evolve towards the maximisation of the surface of planters. The simulation produced 57 phenotypes with rank 0 for FC3.

312 313 APENDIX APENDIX BIO_BOT 2.0 BIO_BOT 2.0
Fig.71. This figure illustrates the selected pool of individuals, particularly Pareto Front solutions.
Fig. 72. Best individuals for 3 Fitness Criteria. The graphs plot all three fitness objectives. The red dots and curves show the selected solution in the entire simulation. It shows how successfully or unsuccessfully simulation optimised this solution for the three fitness objectives.
FITNESS CRITERIA 3
FITNESS CRITERIA 2
APENDIX A
FITNESS CRITERIA 1
EVOLUTIONARY OPTIMISATION
The result of the algorithm produced 1000 phenotype solutions with three fitness values per solution, totalling 3000 values. Although the simulation performed effectively towards the optimisation of the solutions, it produced a significant number of variations in all three fitness criteria in conflicting relationships. From the Pareto Front solutions (Fig..81), it can be observed that the simulation produced a limited variety of phenotypes due to its small-scale optimisation. The high level of visual geometrical variation was not observed due to the low number of genes informing the morphological alterations. However, the simulation established important relationships between gene values which were developed in later stages of morphological organisation.
EVOLUTIONARY OPTIMISATION


Fitness criteria 1 (FC1)- the most optimised phenotype evolved from generation 46 individual 5 (G46I5).


The criteria was formulated as a ratio between volume and the length of the algae pipes. The simulation produced 24 phenotypes with rank 0 for FC1.

Fitness criteria 2 (FC2)- the most optimised phenotype evolved from generation 43 individual 2 (G43I2).
The criteria was set to maximise the number of points located in shadowed area without direct sunlight.


The simulation produced 29 phenotypes with the rank of 0 for FC2.
Fitness criteria 3 (FC3)- the most optimised phenotype evolved from generation 45 individual 3 (G45I3 )
The criteria was set as a parameter that should evolve towards the maximisation of sun exposure on the surface of algae pipes. The simulation produced 23 phenotypes with rank 0 for FC3. The post analysis shows that individuals with a higher performance of in FC3 have a high density of pipes on one of the sides, which should be considered during the module placement in the environment to direct higher density to direct sun.
314 315 APENDIX APENDIX BIO_BOT 2.0 BIO_BOT 2.0
Fig. 81. This figure illustrates the selected pool of individuals, particularly Pareto Front solutions.
Fig. 82. Best individuals for 3 Fitness Criteria. The graphs plot all three fitness objectives. The red dots and curves show the selected solution in the entire simulation. It shows how successfully or unsuccessfully simulation optimised this solution for the three fitness objectives.
FITNESS CRITERIA 3
FITNESS CRITERIA 2
APENDIX B
FITNESS CRITERIA 1
Fig.87. This figure illustrates the selected pool of individuals, particularly Pareto Front solutions.
EVOLUTIONARY OPTIMISATION
The result of the algorithm produced 1000 phenotype solutions with three fitness values per solution, totalling 3000 values. The simulation performed well under optimisation as can be observed in Fig.XX showing the Parallel Coordinate Plot graph. From the Pareto Front solutions (Fig..87), it can be observed that the simulation produced a limited variety of phenotypes in terms of the morphology of water collection surface. A high level of visual geometrical variation can be observed in the morphological organisation of water collection channels that direct water into collection pockets. Due to the genes involved in the optimisation process, water collection channels vary in terms of lengths, their offsets from the surface and the patterns, which allow further optimisation in terms of the production process. The simulation showed vital connections between gene values that emerged at later stages of the simulation for further implementation.
EVOLUTIONARY OPTIMISATION


Fitness criteria 1 (FC1)- the most optimised phenotype evolved from generation 45 individual 2 (G45I2).
The criteria was formulated as a ratio between volume and the surface of the water collection structure. The simulation produced 29 phenotypes with rank 0 for FC1. This individual depicts the highest surface of the water collection pockets compared to other individuals which aids in directing water most efficiently.


Fitness criteria 2 (FC2)- the most optimised phenotype evolved from generation 28 individual 1 (G28I1).
The criteria was set to maximise the surface area of water collection channels. The simulation produced 48 phenotypes with a rank of 0 for FC2. From the visual analysis of the phenotype, it can be seen that water collection channels have geometrical intersections which should be addressed in the post-simulation optimization process.
Fitness criteria 3 (FC3)- the most optimised phenotype evolved from generation 48 individual 1 (G48I1 )
The criteria was set as a parameter that should increase the length and number of simulated rain lines. The simulation produced 45 phenotypes with rank 0 for FC3. The post analysis shows that individuals
316 317 APENDIX APENDIX BIO_BOT 2.0 BIO_BOT 2.0
Fig. 88. Best individuals for 3 Fitness Criteria. The graphs plot all three fitness objectives. The red dots and curves show the selected solution in the entire simulation. It shows how successfully or unsuccessfully simulation optimised this solution for the three fitness objectives.
FITNESS CRITERIA 3
FITNESS CRITERIA 2
APENDIX C
FITNESS CRITERIA 1

