Best Excel Dashboards for Professional & Business Intelligence and Analytics


Knowing key business analytics about your organization is vital to the growth and success of the organization.
Business analytics involves tracking and identifying the KPI’s or metrics about an organization and helps managers and business leaders make decisions.
KPI’s (key performance indicators) provide targets for teams to aim for, milestones to track progress, and insights that help people across the organization make better decisions.
So how are these key performance indicators organized in a way to help these key players make informed and accurate decisions?
The answer is – through dashboards.
To understand how dashboards come into play, let’s go over a simple real world example.
Let’s say you were recently promoted to a managerial position in the sales department at a large corporation.
You need to make a very important decision and need to know the latest data on revenue, performance by salesperson, as well as a few other key metrics.
Your assistant sends you a large excel workbook with several tabs and thousands of rows of data.
Do you start looking for the information you need by scrolling through individual rows and sheets?
Most likely not, and if you are, you need to consider getting a new assistant.
This is where dashboards come into play!
Dashboards are a powerful tool for organizing, pulling data metrics, and presenting them in a clear and concise manner.
A well-made dashboard can have a powerful impact on decision making.
If you didn’t already know this, Microsoft Excel actually has some really powerful dashboard making tools.
Many organizations like to use Excel for creating dashboards because it is a universally used tool and it is an affordable business intelligence software.
While yes, there are business intelligence software providers that specialize in dashboard creation, Excel has everything you need and more.
In today’s article we are going to cover five powerful Excel Dashboard templates that will blow your mind and make your skills as an analyst shine.
What is an Excel Dashboard?
Before we get into the specific types of Excel dashboards, let’s first better define what a dashboard actually is.
An Excel dashboard is a One Page Overview of Data that assists Business Owners, Managers and Employees by tracking key Metrics in their Business to assist them in their decision making process. These Dashboards contain well laid out Data, Reports, Graphs and Views that are all data-backed.
Here is a modern day example of a dashboard that is being used by millions of people all over the world every day – the Covid-19 Tracker.
![]()
![]()
As you can see, the above dashboard provides key metrics about certain data points.
This dashboard is used to understand the Covid-19 data of a country, state, and city.
The dashboard gives users the flexibility to choose specific cumulative data information that is updated on a daily basis.
This dashboard is clean and intuitive, which means that users can easily see the information they are looking for and are able to drill down for more specific data.
A well designed dashboard will be clean, intuitive and provide a high-level overview of your organization.
The dashboard will comprise of different types of charts, tables, and other visualization tools that are easy to interpret and understand.
The contents and design of the dashboard are readily available at the click of a button for quick decision making.
For example, let’s say that as the newly promoted sales manager you want to view the sales your organization made in the current quarter.
You discover that 70% of sales made in the current quarter came from the same state.
To find out which locations within that state are generating the most sales, you can drill down even further at a city-level.
These examples should have given you a better understanding about dashboards and their importance.
Now let’s get into the Excel dashboards so that you can start creating your own!
Online Sales Tracking Excel Dashboard
![]()
![]()
For anyone in online sales, this Online Sales Tracking dashboard provided by Microsoft is crucial to decision making!
Whether you are a small online business just selling a few products or are a larger online retailer looking to get a better grasp on your sales data, this template can easily do that for you.
The online sales tracking dashboard keeps track of sales and profits and automatically calculates the percentage of income per product, among other things.
This dashboard template is great for beginners because it is simple to setup and use, yet can grow with you as your business grows.
Marketing Analytics Excel Dashboard
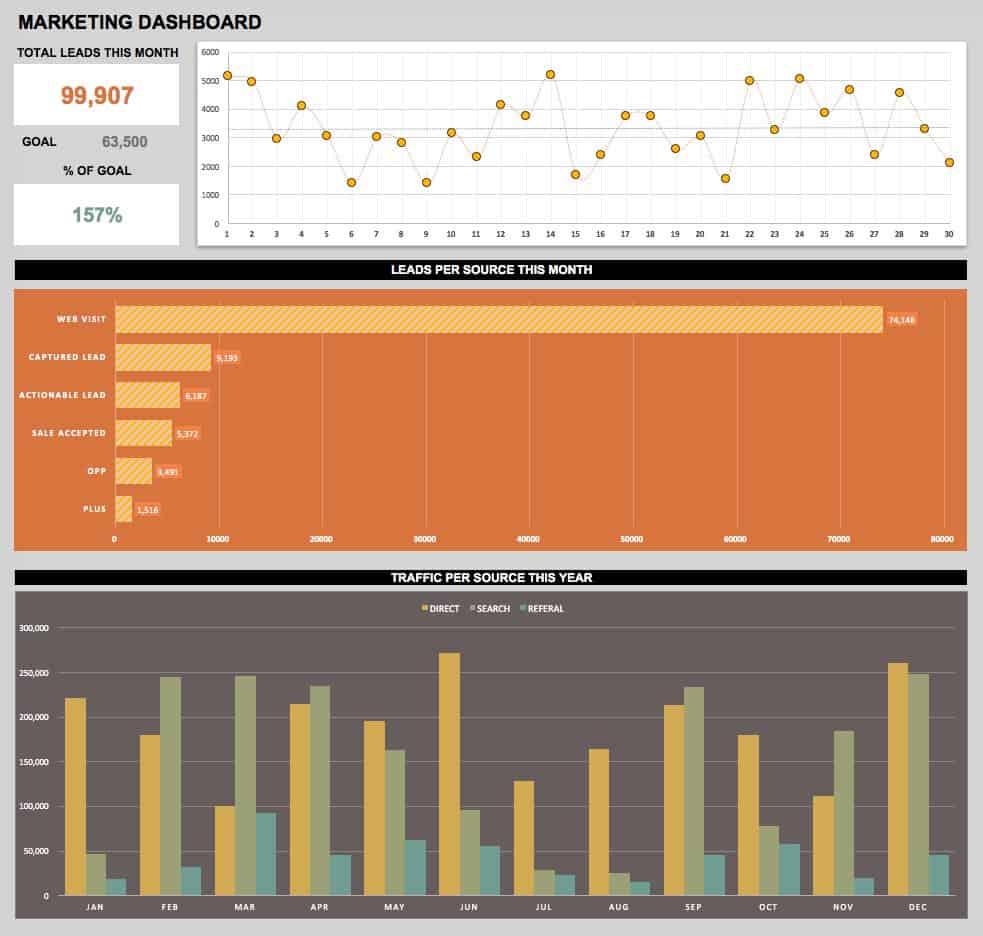
Generating leads is a huge part of a growing business but in order to generate leads, the marketing team needs to understand key metrics about their customers, market trends, and the overall business.
This Marketing Dashboard Template gives information on the KPIs your marketing team needs to close leads and generate more business.
This simple template provides at-a-glance data about your marketing campaigns including behavior and intent of your leads.
Leads can express intent in many ways such as direct contact, website visits, adding products to shopping carts, etc.
This data helps marketing executives make decisions based on trends and behavior.
Project Management Excel Dashboard
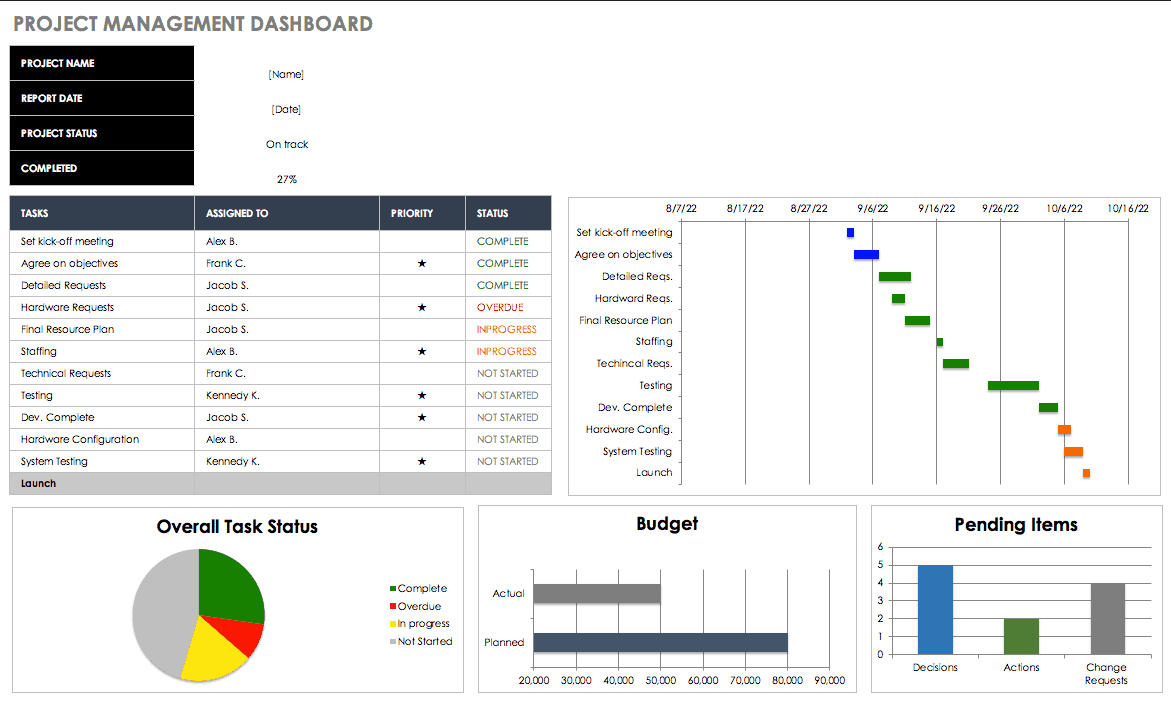
Project managers have a very complex role to play in their organization with several moving parts that need to be watched and tracked.
This Project Management Dashboard for Excel is pretty amazing and will help any project manager keep track of their projects.
This dashboard does it all by keeping track of tasks, timelines, budgets, as well as any pending items.
You can keep track of all of the moving parts while sticking to constraints such as budget and time.
It even incorporates several helpful visualization tools such as Gantt charts, task status charts, and more.
Revenue Tracking Excel Dashboard
![]()
![]()
For those with a little bit of dashboard experience under their belt, the Operational Dashboard Report is a little more advanced and is used to track a company’s revenue.
What is really helpful about this dashboard is that it provides a view of expenses and revenue of the company from an operational perspective.
The one page dashboard provides an overview of revenue and you can drill-down for more specific company data.
HR Management Excel Dashboard

If you are looking for a dashboard that can provide you with all of the general key metrics you would need as an HR manager, this is it.
This Human Resources Dashboard provides information by region (country) or department and you can drill down to specific individuals within the organization.
It can be customized with various charts and colors.
Key Takeaways
- Dashboards are used globally and can provide the necessary data for organizations to make key decisions.
- Dashboards are a powerful tool for organizing, pulling data metrics, and presenting them in a clear and concise manner.
- A well designed dashboard will be clean, intuitive and provide a high-level overview of your organization with the options to drill down for more detailed data.
- Dashboards comprise of different types of charts, tables, and other visualization tools that are easy to interpret and understand.
- The contents and design of the dashboard are readily available at the click of a button for quick decision making.
- Excel is a popular tool used for creating Dashboards because it is a universally accessible tool and is more affordable than many other business intelligence software providers.
- Analysts should be well-educated on Dashboards and how to create them.