 Takashi Asaeda
 Mizanur Rahman
 Xia Liping
 Jonas Schoelynck
- 1Hydro Technology Institute Co, Ltd., Tokyo, Japan
- 2Research and Development Center, Ibaraki, Japan
- 3Department of Environmental Science, Saitama University, Saitama, Japan
- 4Department of Biology, University of Antwerp, Wilrijk, Belgium
In vegetation management, understanding the condition of submerged plants is usually based on long-term growth monitoring. Reactive oxygen species (ROS) accumulate in organelles under environmental stress and are highly likely to be indicators of a plant’s condition. However, this depends on the period of exposure to environmental stress, as environmental conditions are always changing in nature. Hydrogen peroxide (H2O2) is the most common ROS in organelles. The responses of submerged macrophytes, Egeria densa, to high light and iron (Fe) stressors were investigated by both laboratory experiments and natural river observation. Plants were incubated with combinations of 30–200 μmol m–2 s–1 of photosynthetically active radiation (PAR) intensity and 0–10 mg L–1 Fe concentration in the media. We have measured H2O2, photosynthetic pigment concentrations, chlorophyll a (Chl-a), chlorophyll b (Chl-b), carotenoid (CAR), Indole-3-acetic acid (IAA) concentrations of leaf tissues, the antioxidant activity of catalase (CAT), ascorbic peroxidase (APX), peroxidase (POD), the maximal quantum yield of PSII (Fv Fm–1), and the shoot growth rate (SGR). The H2O2 concentration gradually increased with Fe concentration in the media, except at very low concentrations and at an increased PAR intensity. However, with extremely high PAR or Fe concentrations, first the chlorophyll contents and then the H2O2 concentration prominently declined, followed by SGR, the maximal quantum yield of PSII (Fv Fm–1), and antioxidant activities. With an increasing Fe concentration in the substrate, the CAT and APX antioxidant levels decreased, which led to an increase in H2O2 accumulation in the plant tissues. Moreover, increased POD activity was proportionate to H2O2 accumulation, suggesting the low-Fe independent nature of POD. Diurnally, H2O2 concentration varies following the PAR variation. However, the CAT and APX antioxidant activities were delayed, which increased the H2O2 concentration level in the afternoon compared with the level in morning for the same PAR intensities. Similar trends were also obtained for the natural river samples where relatively low light intensity was preferable for growth. Together with our previous findings on macrophyte stress responses, these results indicate that H2O2 concentration is a good indicator of environmental stressors and could be used instead of long-term growth monitoring in macrophyte management.
Introduction
Submerged macrophytes are exposed to various abiotic and biotic stressors in their natural environment. Flow rates, metal ion concentrations, water temperature, light conditions, eutrophication, allelopathy, and pathogens are common environmental stressors. Recent studies have suggested that salinity (Khalid et al., 2020, 2021), conditions in flume facilities of submerged freshwater macrophytes (Vettori and Rice, 2019) can also play a major role in plant environmental stress. Plant cells exhibit a variety of responses to radicals, depending on their intracellular level. ROS levels ranging from 0.02 to 0.05 μM are involved in a normal signal transduction mechanism and could be beneficial with different Fe and light conditions (Kovalchuk, 2010). The accretion of reactive oxygen species (ROS) is prevented by antioxidant activities under usual conditions (Caverzan et al., 2012). However, under environmental stress, the ROS levels overcome the defense mechanism and create oxidative stress in plants (Gill and Tuteja, 2010). Although ROS are the essential byproducts of photosynthesis, an excess amount of solar energy generates ROS superoxide radicals, affecting the photosystem II (PSII) (Pospíšil, 2016). These superoxide radicals are catalyzed by superoxide dismutase (SOD), generating H2O2 (Prasad et al., 1994, 2015; Asada, 1999).
Under abiotic or biotic stress, plants generate physiological responses, including the accumulation of ROS in the organelles of their cells. The accumulation of ROS is harmful to plants; its presence in cells and tissues can cause oxidative stress, which denatures proteins, lipids, and DNA. ROS are also important for growth regulation and signaling mechanisms (Gapper and Dolan, 2006; Einset et al., 2007; Shetty et al., 2008; Salleh et al., 2016).
Macrophytes are sensitive to even minor changes in light intensity (Rae et al., 2001; Imamoto et al., 2008). As submerged macrophytes are usually exposed to relatively weak light, even moderate light in terrestrial areas may be a stress source for them. Therefore, the water depth, which is strongly correlated with the incident light intensity, is an important factor for the growth of macrophytes (Liu et al., 2018; Asaeda et al., 2020). Further, plants—including submerged macrophytes—have a defense capacity against stress, depending on their physiological status. Thus, plants under various light conditions, including variational characteristics, may have different capacities to respond to stressors.
Fe is an essential element, particularly as it is important for the electron transport chain in photosynthesis as well as in antioxidant enzymes (Rabotti et al., 1995; Becana et al., 1998; Connolly and Guerinot, 2002). However, the excessive presence of Fe in the environment is toxic and is one of the major oxidative stress sources for plants. Because of its strong reactivity with oxygen, Fe is a difficult element for aerobic organisms to handle. Fe can catalytically promote the generation of hydroxyl radicals through Fenton’s reaction (Graf et al., 1984; Pinto et al., 2003; Halliwell, 2006). Thus, both high and low concentrations of Fe cause problems in plants, including submerged macrophytes (Bakker et al., 2016). The Figure 1 shows an overview of stress mechanism based on light intensity and Fe.
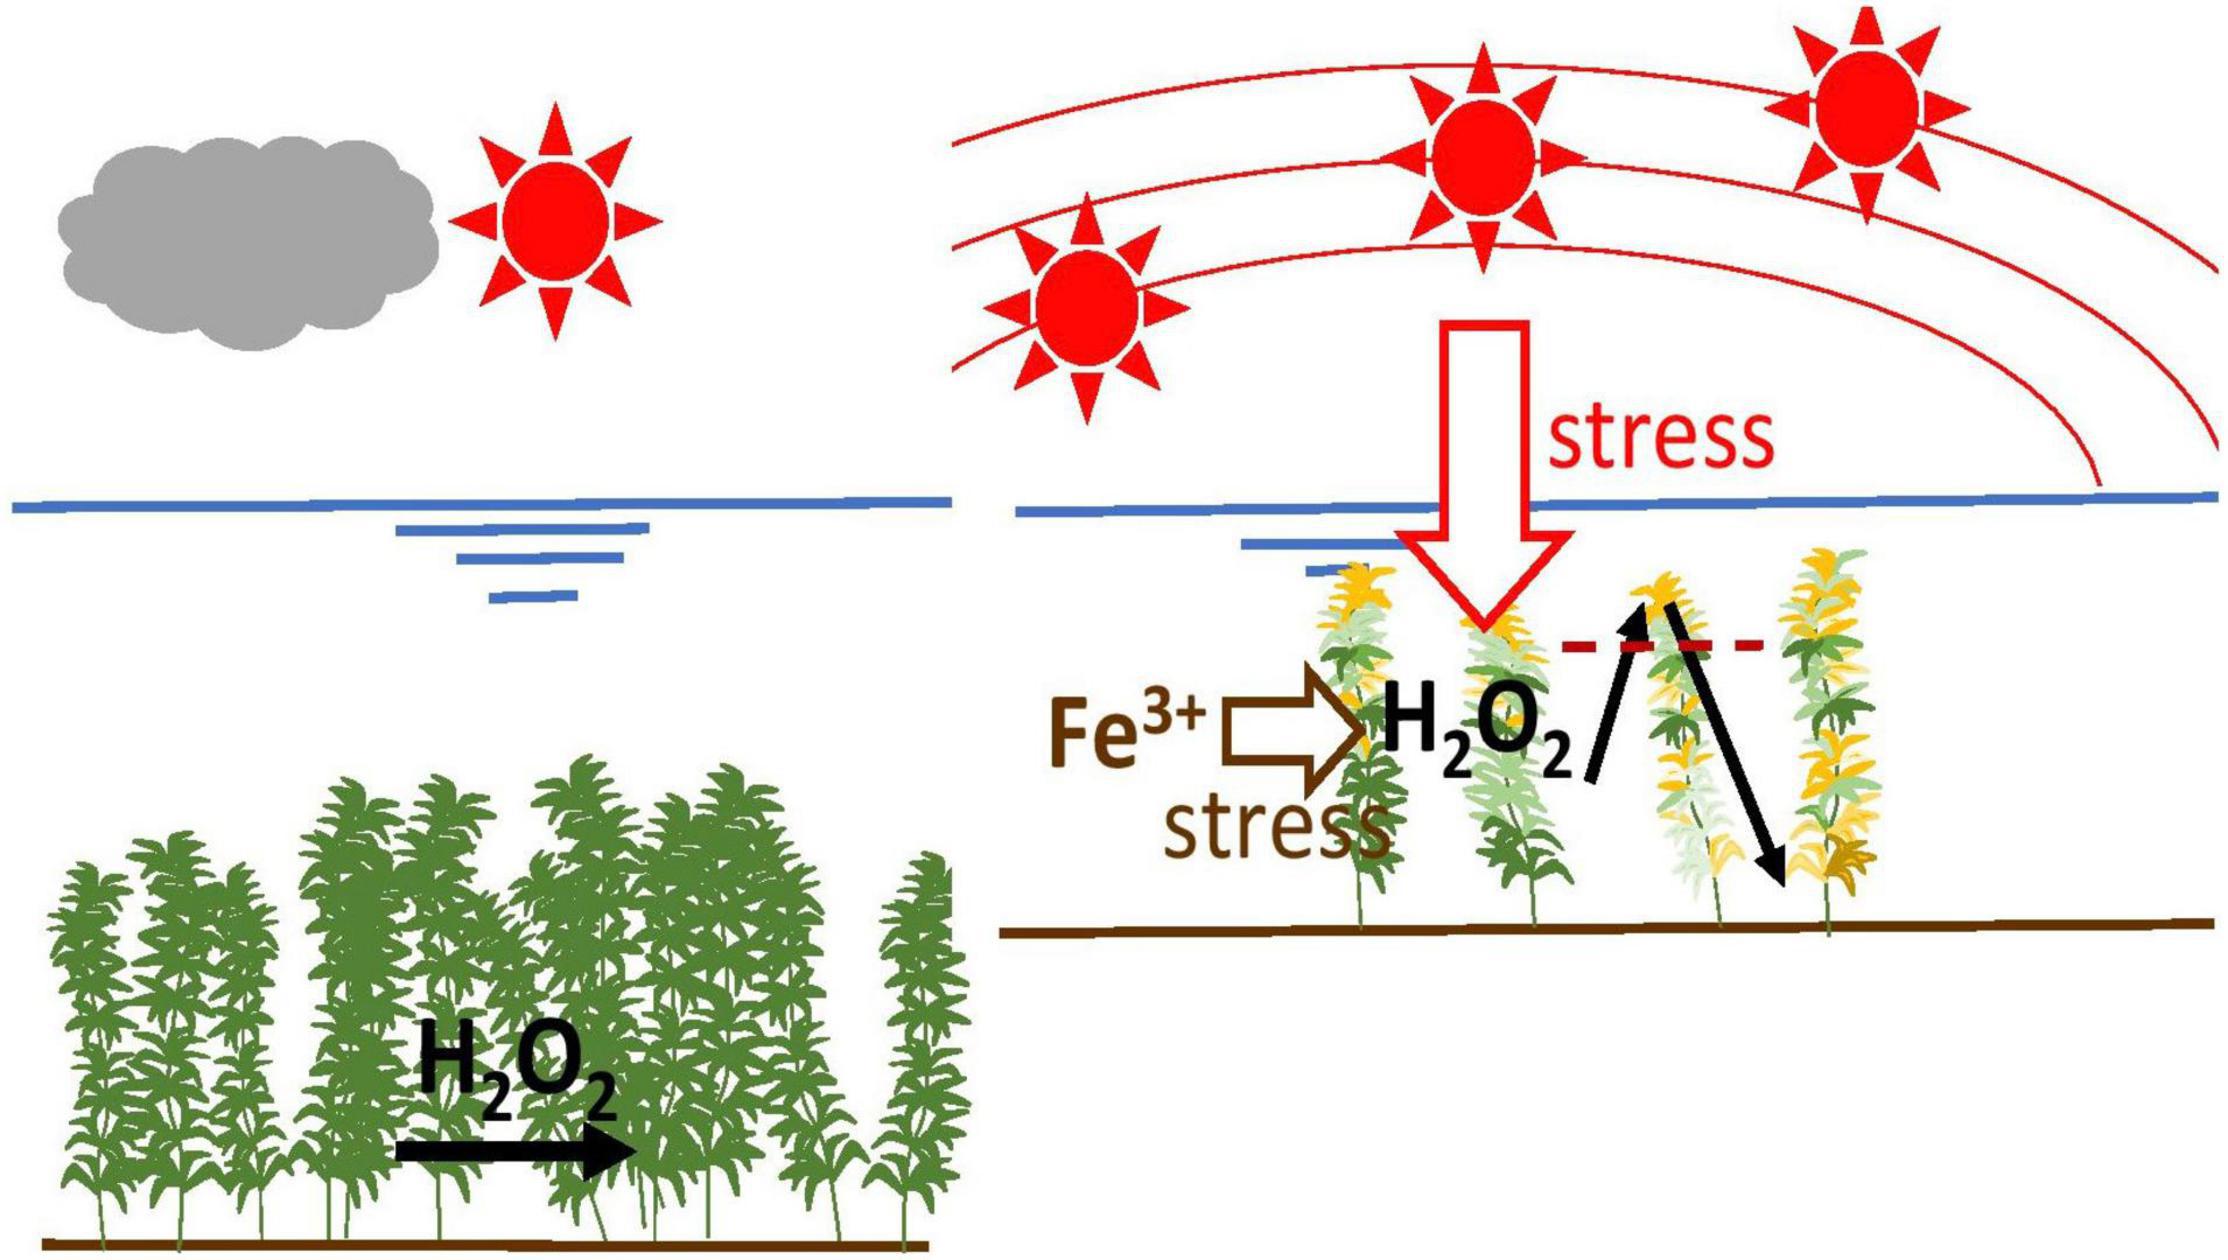
Figure 1. Overall overview of stress mechanism based on light intensity and Fe.
In plant management, the condition of plants is investigated mainly by the long-term casual observation and monitoring of growth parameters after treatment. It normally takes several months or years to identify the difference in the vegetation condition compared with the target condition. The longer it takes to recognize this shift, the more costly it becomes to reform the management plan. If a method could be applied to measure the plant’s condition directly by physiological factors, this time-consuming process in plant management could be avoided.
Among ROS, the accumulation of H2O2 is being widely adopted as a stress indicator in various plant stress studies, such as trees, shrubs, crops, and macrophytes (Kuźniak and Urbanek, 2000; Mittler, 2002; Suzuki et al., 2014; Zhang et al., 2014; Niu and Liao, 2016; Parveen et al., 2019; Asaeda et al., 2020). Compared with other ROS, H2O2 is relatively stable (Sharma et al., 2012) and can be quantified chemically with minimum losses (Satterfield and Bonnell, 1955). Therefore, the H2O2 concentration in the plant tissues was considered in the present research in order to review the possibility of H2O2 concentration as an indicator of stress intensity in vegetation management.
Our previous studies on abiotic stress (turbulence, heat, hypoxia, H2S) on aquatic macrophytes revealed that each stressor in the their habitat’s normal condition has the tendency to enhance the plant’s H2O2 concentration proportionately to the stress intensity (Ellawala et al., 2011; De Silva and Asaeda, 2017a,b; Parveen et al., 2017). With a combination of stressors, the H2O2 accumulated for each stressor is estimated as the sum of each component and allows one to estimate the stress level compared with the threshold H2O2 level. The H2O2 contents have a high correlation to the chlorophyll contents, the growth rate, and the colony formation; thus, it is possible to estimate the stress level to make colonies based on the H2O2 concentration (Asaeda et al., 2020, 2021). It is extremely beneficial if we can evaluate the effect of different stressors by a single parameter. However, a low H2O2 concentration was also observed under an excessively high intensity of stresses present for a long period (Asaeda et al., 2020). Particularly in the field observation, stress intensity frequently changes, and it is difficult to evaluate the equivalent intensities from the different exposure period to the stressors and the experienced intensities.
In the present study, therefore, the variational trend of H2O2 and photosynthetic pigments was investigated, depending on the exposure period to single or combined stressors, with the aim of discovering the proper management procedure of macrophytes.
Experimental Design
Laboratory Experiments
A healthy stock of Egeria densa was collected from the Moto-Arakawa River in southern Saitama, Japan. The collected plants were cleaned with water to remove debris, and the attached algae were carefully separated by tweezers. Then, the plants were cultured in several glass tanks under laboratory conditions (25 ± 2°C, 12/12 h. photoperiod, PAR intensity 100–150 μmol m–2 s–1 using fluorescent lighting) for several months. Commercial sand (D50 < 0.2 mm) was used as a substrate, and a 5% Hoagland solution was provided as the nutrient media. Algae-free stocks were selected for the experiments.
The experiments were conducted by growing E. densa cuttings (7 cm long) in 500-mL narrow glass beakers (13.6 cm height × 7.5 cm outside diameter) without a substrate. Each beaker was wrapped with a reflective sheet so every part of plant tissue was homogeneously exposed to the same intensity of light. Two cuttings were firmly attached to a sponge and fixed to the bottom of each beaker. A Hoagland solution (5%) was provided as the nutrient source. Three light intensities (30, 100, and 200 μmol m–2 s–1 PAR intensity) and six concentrations of Fe (0, 0.5, 3, 5, 7, and 10 mg L–1) were chosen in order for the experiment to range from natural to extreme conditions. The light was provided by LED straight lights (Model LT-NLD85L-HN; OHM Electric Inc., Japan) with a 12/12 h photoperiod. The Fe concentration in the media was adjusted by adding the required FeCl3 amount to the tank. The control condition was maintained by keeping the plants in a 5% Hoagland solution (0.13 mg L–1 Fe) without any further treatment. Stress assays were performed after three or seven days of exposure.
Several sets of additional conditions were added to obtain the different patterns of solar radiation.
With 5% Hoagland media at 25 ± 2 or 20 ± 2°C, E. densa was grown in 30 × 18 × 20 cm reflective sheet-wrapped glass tanks under four PAR densities of 50, 100, 200, and 300 μmol m–2 s–1. In this set of experiments, analyses of the samples were conducted every 5 days for 30 days in order to observe the transition from the start of the experiment.
In another set of experiments, the E. densa-grown tanks were located outdoors and exposed to solar radiation for three consecutive clear days. Three tanks were prepared for each of either 20 ± 2 or 30 ± 2°C water temperature for the replicates. On the third day, every 3 h., from 6 am (just after sunrise) to 6 pm (slightly before sunset), samples were taken from the three tanks of each temperature and were subjected to analyses. The solar radiation intensity was measured at each sampling time.
Field Sampling
Field sampling of E. densa was conducted in western Japan’s Saba River, midstream. Sampling was conducted on clear days with less than 20% cloud cover in August 2018. Plant conditions at river reaches were surveyed beforehand. Five to ten representative sites of healthy mono species communities of E. densa were selected from nearly stagnant water (less than 5 cm s–1 mean velocity) upstream of weirs.
Light intensity was measured from the surface to the bottom of the river at 10cm intervals.
Then, the canopy top shoots were carefully sampled, tightly sealed in plastic bags, and stocked in a frozen storage box with dry ice until they were brought to the laboratory for chemical analysis (H2O2, Chl-a, Chl-b, and CAR). The comparison with non-frozen samples indicated that the freezing process did not have any effect on the chemical composition. The water depth of the sites ranged from 0.25 to 1.0 m. The water quality parameters were within the common range for the area: temperature, 20–25°C; pH, 6.8–7.0; dissolved oxygen, 9.0 mg L−1; salinity, 0 ppt; turbidity, 0–35 NTU; and electrical conductivity, 5–11 ms m–1.
Chemical Analyses
Plant lengths were measured using a millimeter scale at 5–7-day intervals. The SGR was calculated as the difference in the shoot length between two observations. The SGR was obtained by dividing the length by the duration and was expressed in cm day–1. At the end of the experiment, the plants were oven-dried at 70°C for 72 h. The dry weight (DW) of the shoots was measured to confirm the reliability of the shoot length as a reference parameter of the growth rate. The weight length−1 ratio was 4.0 ± 1.0 mg DW cm–1, regardless of conditions, except for the dying samples; thus, SGR values were used as the reference growth rate (Ellawala et al., 2011).
The Chl-a, Chl-b, and total CAR contents were spectrophotometrically (UV Mini 1210; Shimadzu, Japan) determined by extracting pigments of N, N-dimethylformamide after keeping dark for 24 h. The results were expressed in fresh weight (FW) (Porra et al., 1989). The chlorophyll fluorescence parameters were measured by fluorescence imaging (FC 1000-H; Photon Systems Instruments, Czech Republic) with auto image segmentation. Initially, the plants were dark-adapted for 20 min, and the maximum quantum efficiency of PSII (Fv Fm–1) was obtained.
Apart from IAA, the stress assay compounds H2O2, CAT, APX, and POD were extracted by grinding the freeze-dried (with liquid nitrogen) fresh plant sample (∼500 mg) with an ice-cold, pH 6.0, 50 mM phosphate buffer. Polyvinylpyrrolidone (PVP) was added to the extraction to mask the effect of phenolic compounds in the plant materials. The sample extraction for endogenous IAA was performed by following a similar procedure, but distilled water was used as the extraction media. Then, the extractions were centrifuged at 5,000 × g and 4°C for 15 min, and the supernatant was separated and incubated at −80°C for further analysis. In each treatment, the extractions were performed in triplicate. All the results were expressed in FW.
The H2O2 contents were determined colorimetrically following the TiSO4 method (Satterfield and Bonnell, 1955), with modifications. The reaction mixture contained 750 μL of enzyme extract and 2.5 mL of 1% TiSO4 in 20% H2SO4 (v/v), which was centrifuged at 5,000 × g and 20°C for 15 min. The optical absorption of the developed yellow color was measured spectrophotometrically at a wavelength of 410 nm. The H2O2 concentrations in the samples were determined using the prepared standard curve for known concentration series. The H2O2 contents were expressed in μmol g–1 FW.
The absorption at 410 nm includes the effect of other soluble compounds (Cheeseman, 2006; Queval et al., 2008). Thus, the H2O2 concentration was calculated from the slope of the standard curve obtained from the known H2O2 concentration, which was offset, derived by the intercept absorption rate with zero H2O2 concentration samples (Cheeseman, 2006). The results were compared with those of the e-FOX method (Queval et al., 2008), and a suitable correlation (R2 = 0.98) was obtained. The results were presented as μmol g–1 FW.
The CAT activity was measured as follows: 100 μL of 10 mM H2O2 and 2.0 mL of 100 mM potassium phosphate buffer (PH 7.0) were added to the cuvette before 500 μL of enzyme extract was added to initiate the reaction. The optical absorbance reduction at 240 nm was recorded every 10 s for 3 min. Finally, the CAT activity was obtained using an extinction coefficient of 40 mM–1 cm–1 (Aebi, 1984). The APX activity was determined as follows: the reaction mixture contained 100 μL of enzyme extract, 200 μL of 0.5 mM ascorbic acid in 50 mM potassium phosphate buffer (PH 7.0), and 2 mL of 50 mM potassium phosphate buffer (PH 7.0). The reaction was initiated by adding 60 μL of 1 mM H2O2. The decrease in absorbance at 290 nm was recorded every 10 s. The APX activity was calculated using an extinction coefficient of 2.8 mM–1 cm–1 (Nakano and Asada, 1981). The POD activity was spectrophotometrically measured based on the oxidation of guaiacol with the presence of H2O2. The reaction mixture contained 3.0 mL of pH 6.5 potassium phosphate buffer, 40 μL of 30 mM H2O2, and 50 μL of 0.2 M guaiacol. The reaction was initiated by the addition of 100 μL of crude enzyme extract, and the increase in absorbance at 420 nm was recorded every 10 s for 3 min. Then, the absorbance change rate and POD activity were calculated using an extinction coefficient of 26.6 mM–1 cm–1 (Goel et al., 2003).
The concentration of endogenous IAA was also determined using a prepared standard curve for known concentration series. The reaction mixture contained an aliquot of enzyme extract (1.00 mL) and 2.00 mL of modified Salkowski’s reagent (1.00 mL of 0.5 M FeCl3 in 50 mL of 35% perchloric acid) (Gordon and Weber, 1951). The resultant color intensity was measured as absorbance after a 1 h incubation period at 25°C at a wavelength of 530 nm, and the results were presented as μg g–1 FW.
Chlorophyll fluorescence was measured using a chlorophyll fluorescence imaging technique (FC 1000-H; Photon Systems Instruments, Czech Republic) with auto image segmentation. The Fv Fm–1 value became highest 20–30 min. after darkening (20 min. is sufficient; Hubbart et al., 2012). Thus, plant segments were dark-adapted for 20 min. before measurement. The maximum quantum efficiency of PSII photochemistry (Fv Fm–1) was calculated using the equation Fv Fm–1 = (Fm - Fo) Fm–1, where Fv, Fm, and Fo are the variable, maximum, and minimum fluorescence in the dark-adapted state, respectively.
The initial and final lengths of apical tips were measured using a ruler. The relative SGR was calculated with the formula SGR = (FL - IL) days–1, where FL is the final length and IL is the initial length.
Statistical Analyses
The collected data were tested for normality with the Shapiro–Wilk test before the statistical analyses were performed. All results were presented as the mean ± SD of three replicates. The data were subjected to a one-way analysis of variance (ANOVA) with Tukey’s post hoc test for mean separation. The t-test was performed where necessary. Bivariate analysis was used and followed by Pearson’s correlation method to evaluate the relationship between parameters. Statistical analyses were performed with IBM SPSS V25.
Results
All samples from the laboratory experiments were in good condition at the end of the experiment, except for those exposed to an Fe concentration of 7–10 mg L–1 and a PAR intensity of 200 μmol m–2 s–1, which included samples that were almost dying. Therefore, these dying samples were excluded from the analyses. The growth media contained 0.13 mg L–1 of Fe by default, displayed as 0 mg L–1 in all figures for clarity, and other concentrations were scaled to it. With increasing Fe concentration and PAR intensity, the condition of the plants became worse. The conditions of the plants after 7 days are shown in Figure 2.
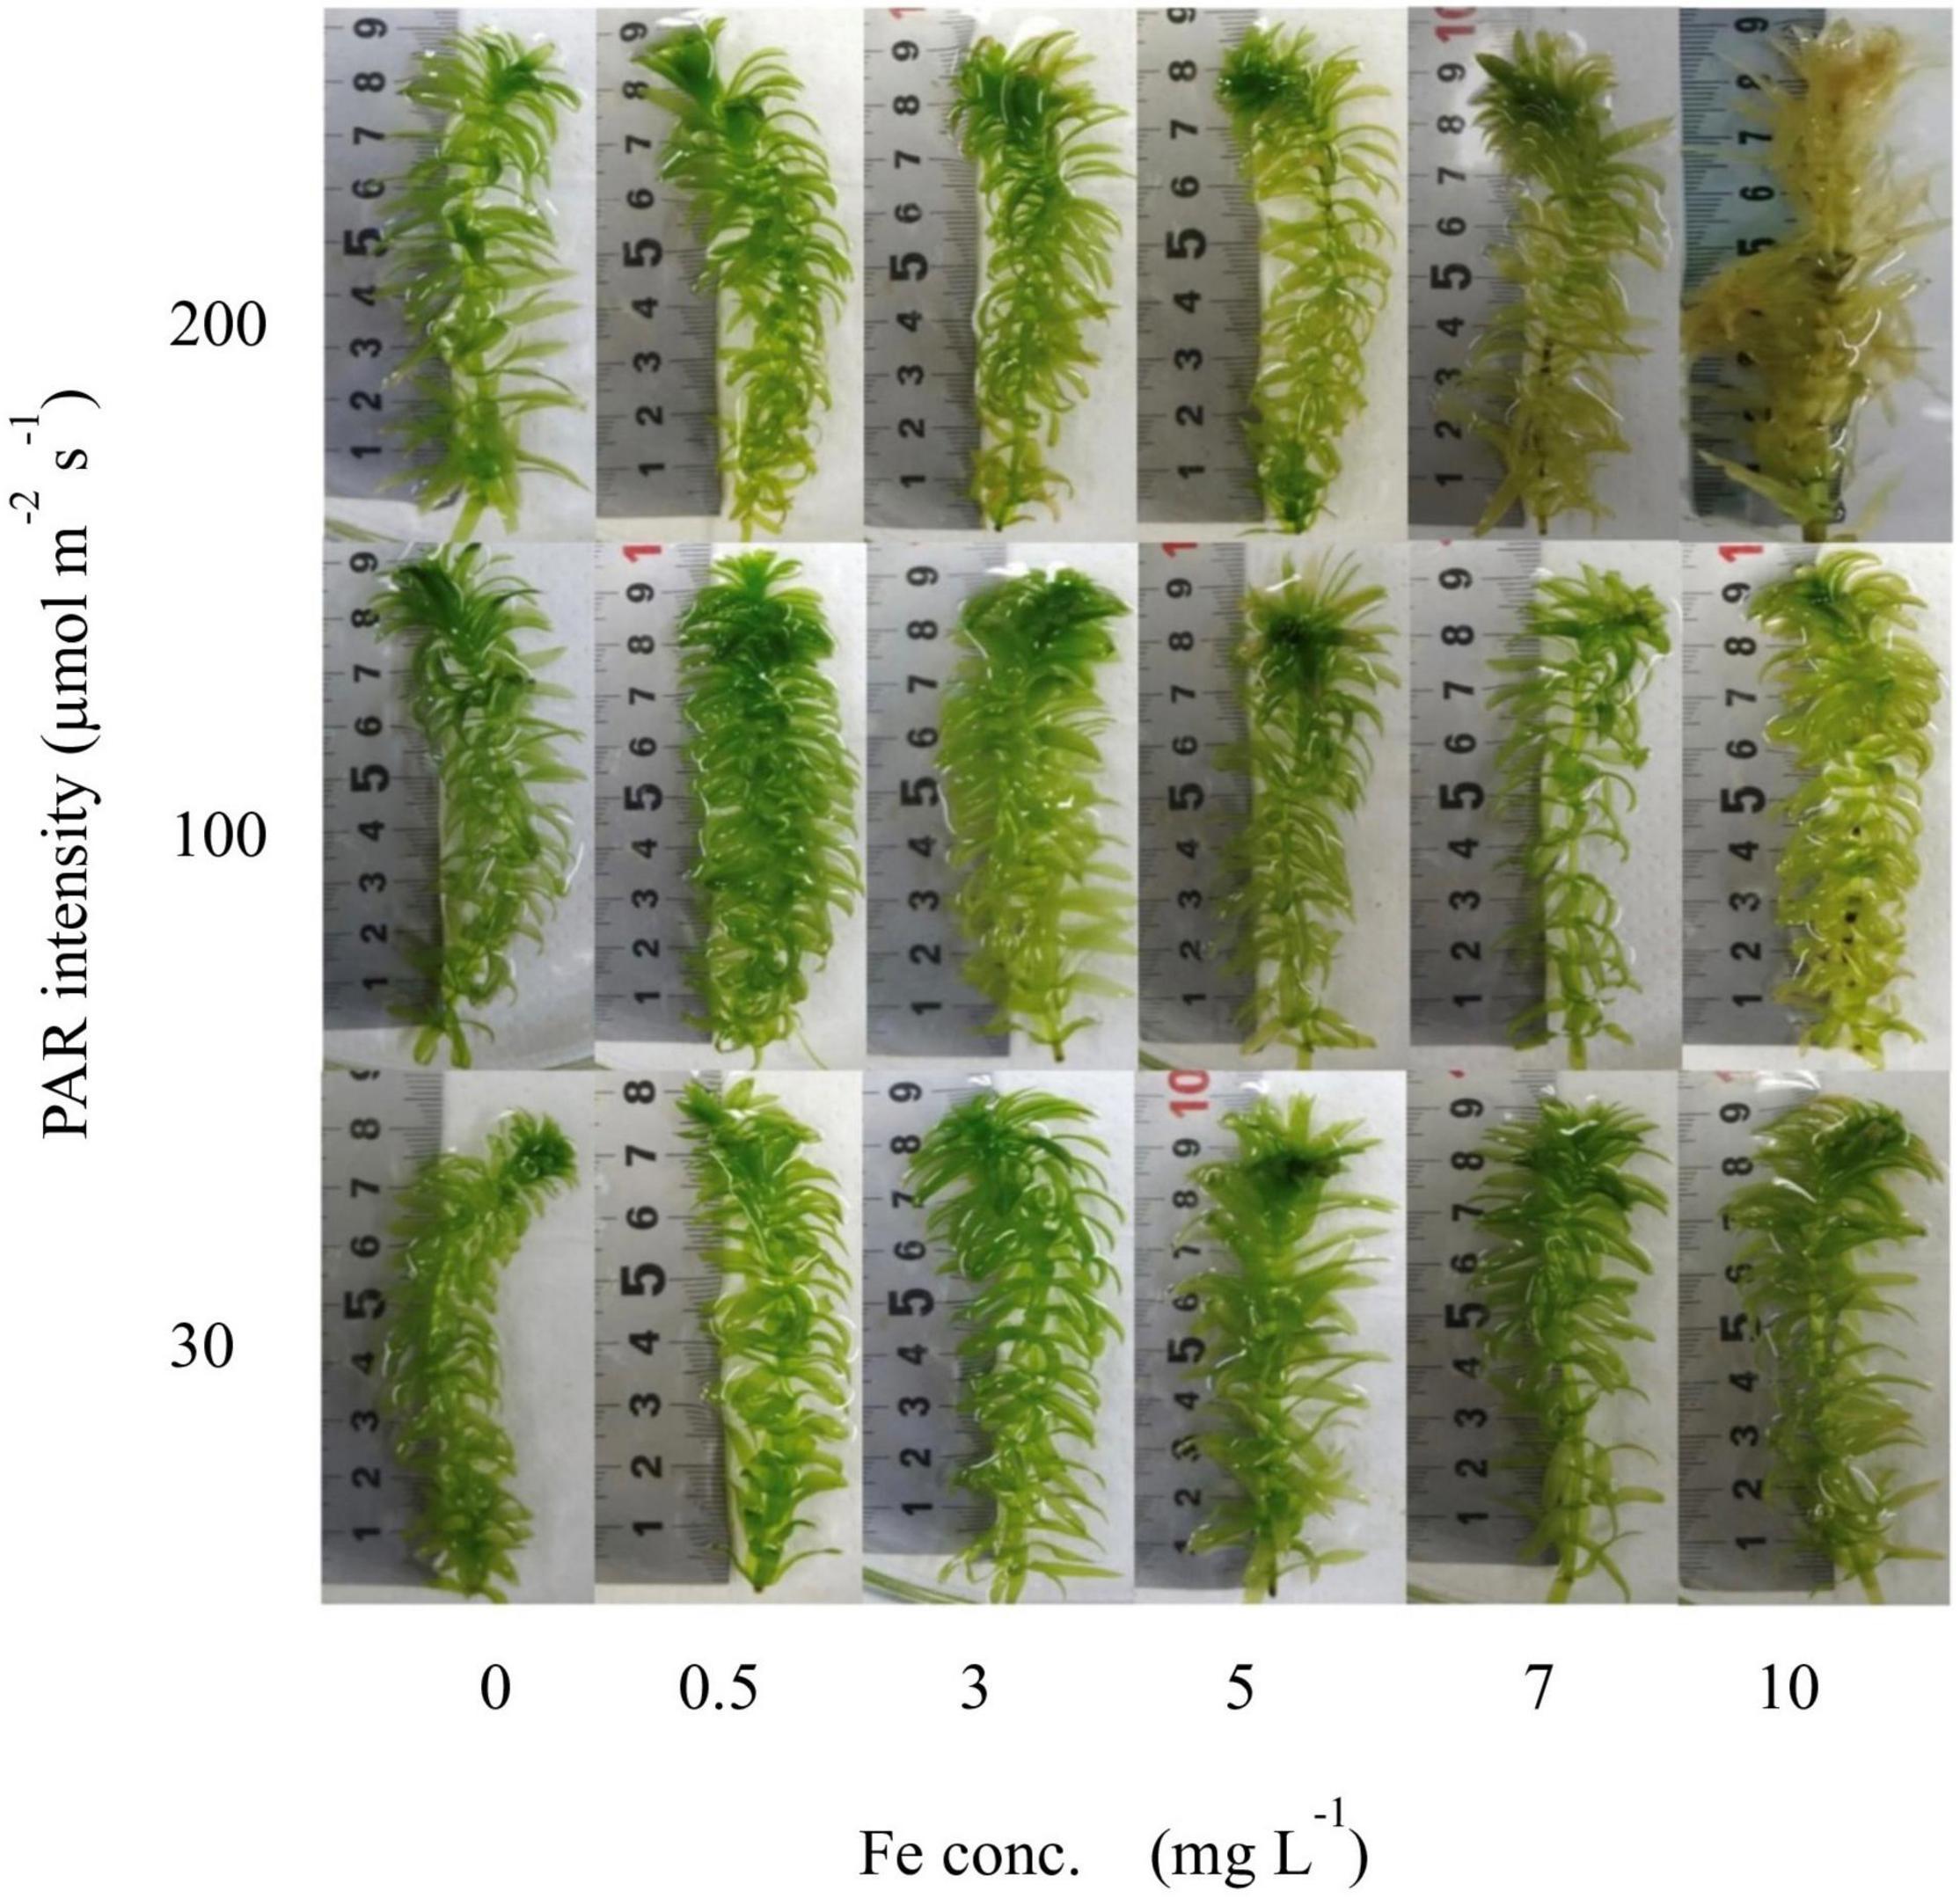
Figure 2. Visual conditions of plant shoots from the laboratory experiment after 7 days’ exposure to different light intensity and Fe conditions.
The H2O2 concentration and Chl-a concentration of tissues after 7 days are shown in Figure 3 as a function of Fe concentration. The H2O2 formation was the same regardless of PAR, with less than 0.5 mg L–1 Fe in the media. With the Fe concentration increasing from 0.5 mg L–1 Fe, the H2O2 concentration, which was higher with a higher PAR intensity, gradually increased for each PAR intensity group until reaching 7 mg L–1 of Fe concentration shown in Table 1. However, with 200 μmol m–2 s–1 of PAR, the H2O2 concentration suddenly declined at 10 mg L–1 Fe. The Chl-a concentration, which is low with higher light intensity, had a negative relation with the Fe concentration (Table 1).
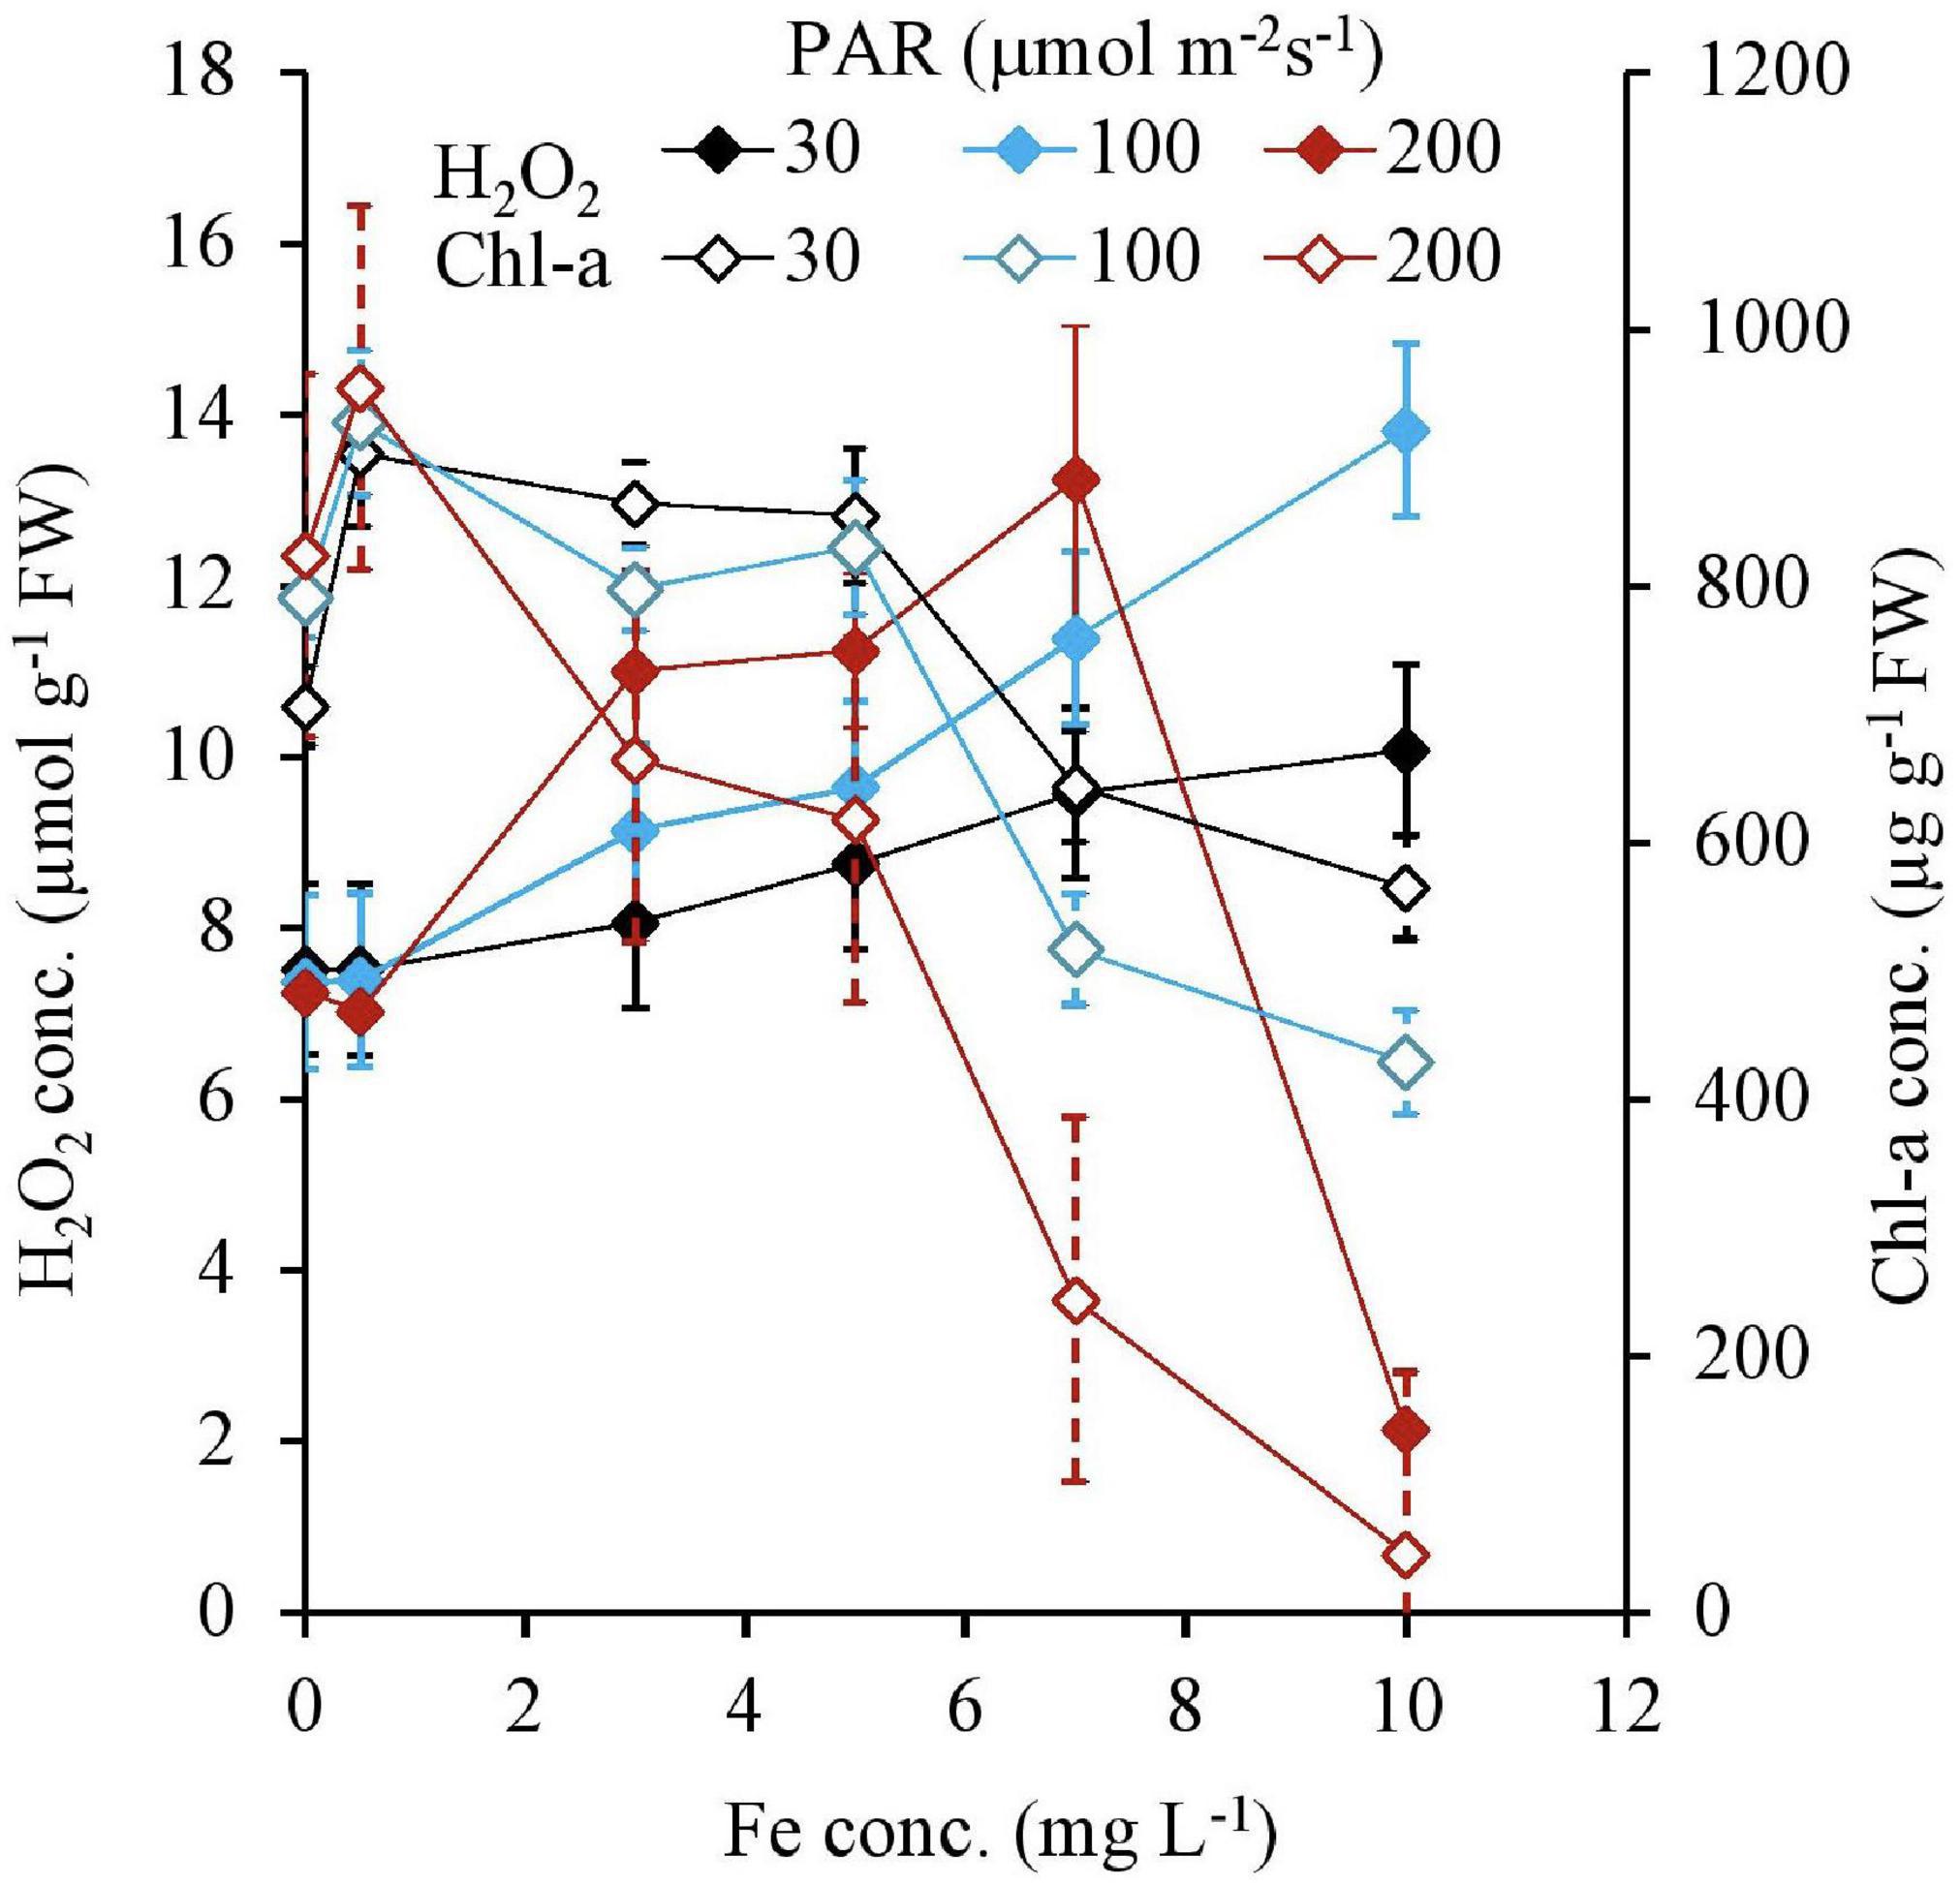
Figure 3. H2O2 and Chl-a concentrations of plant tissues after 7 days of the experiment as a function of Fe concentration in water and PAR intensities.
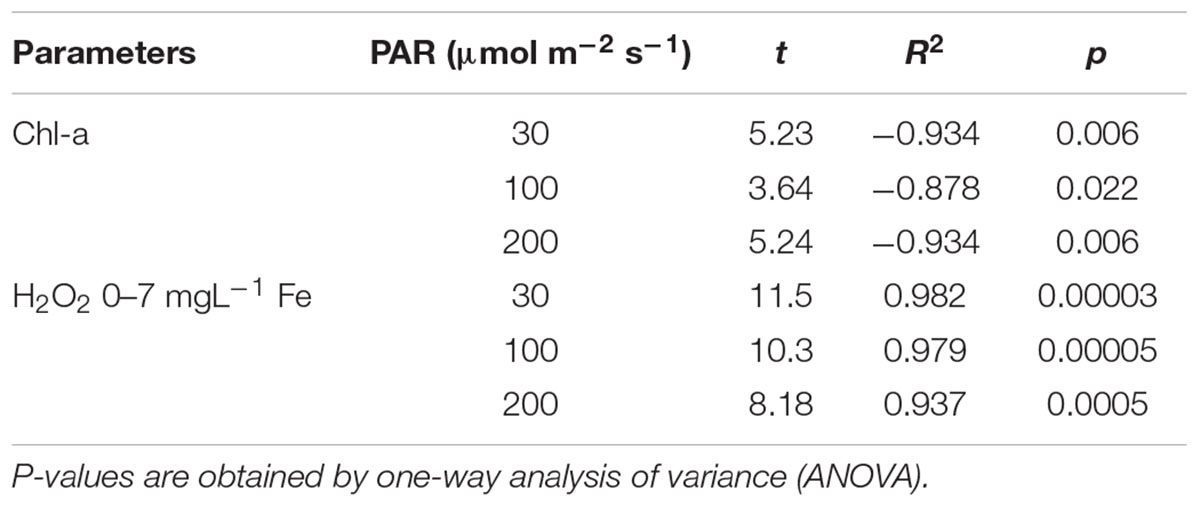
Table 1. Relationship between Fe concentration and parameters for different light intensities.
Both the Chl-a and Chl-b concentrations had high negative relationships with the H2O2 concentration, except for 0 and 10 mg L–1 Fe; however, they were not affected by the light intensity. In contrast, the CAR concentration did not have a high negative correlation with H2O2 (Table 2). All pigment concentrations significantly declined with 200 μmol m–2s–1 PAR and 10 mg L–1 Fe, which was associated with low H2O2 concentration (Figure 4).
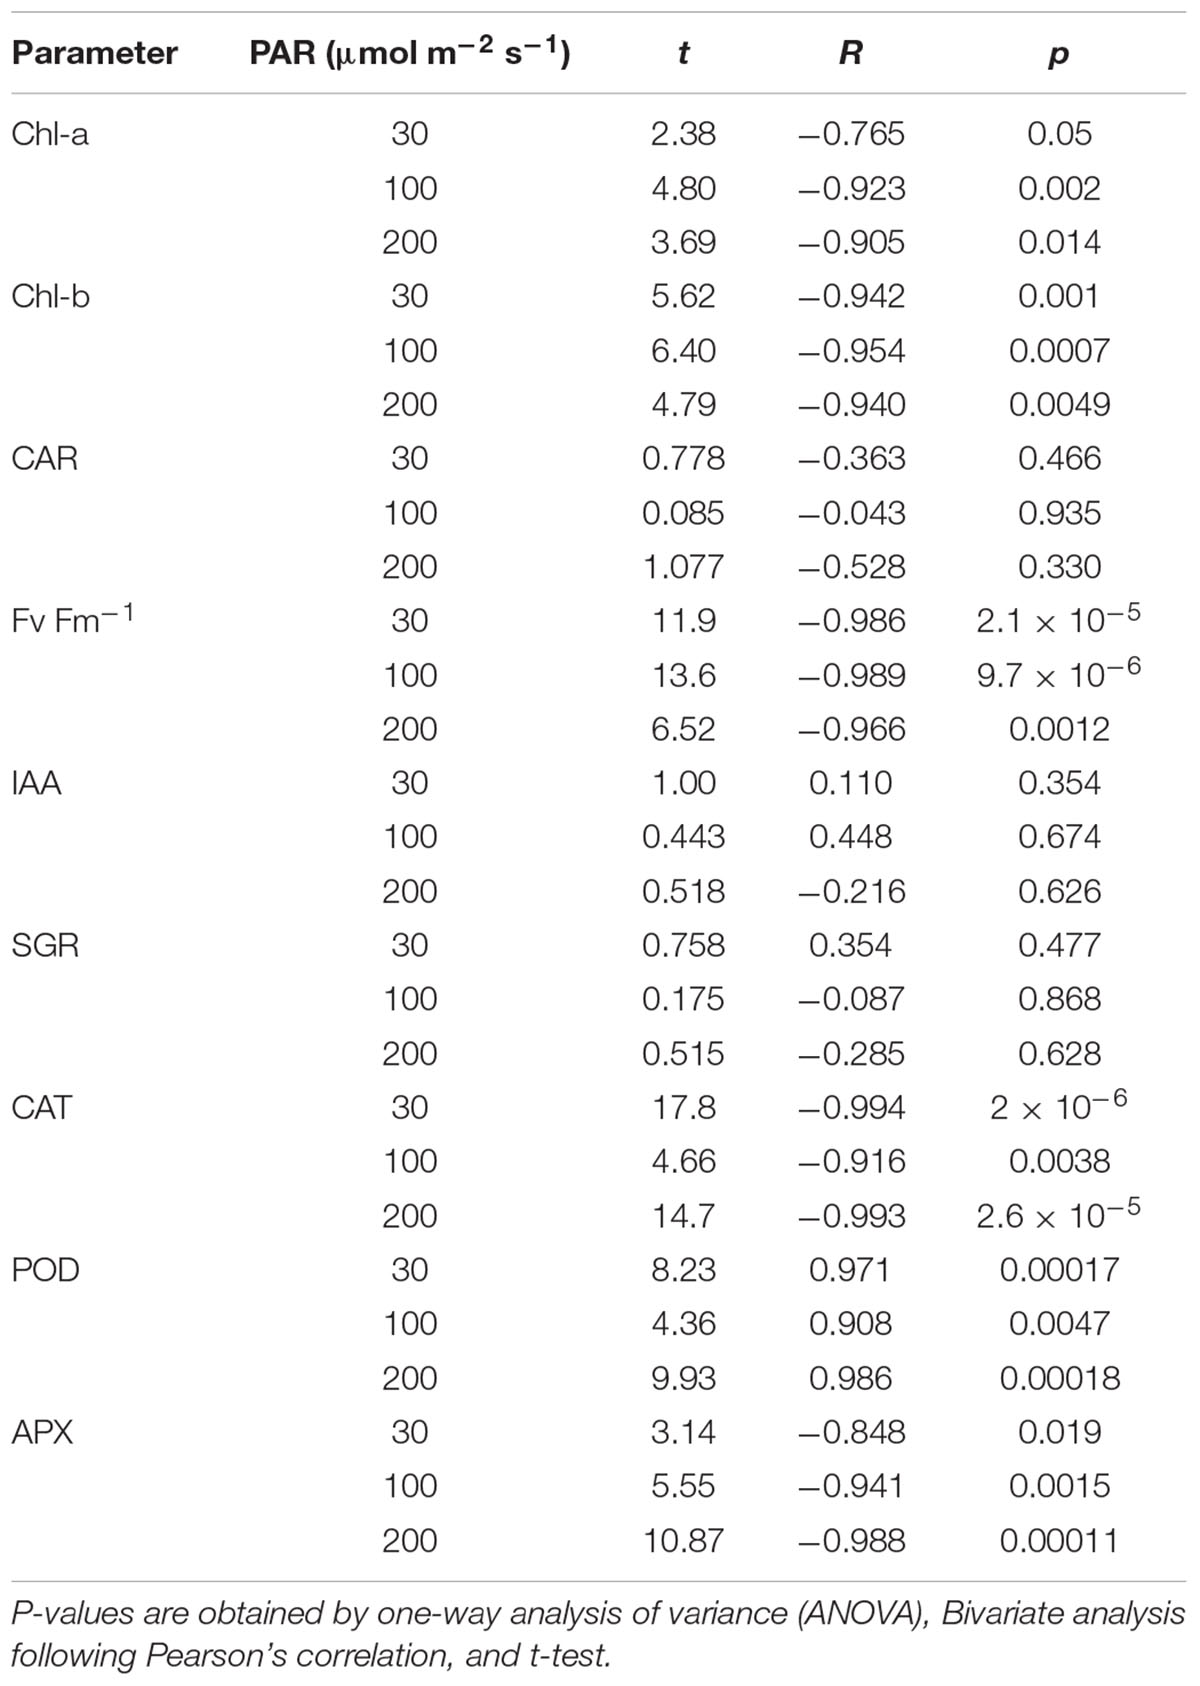
Table 2. Relationship between H2O2 concentration and parameters for different light intensities.
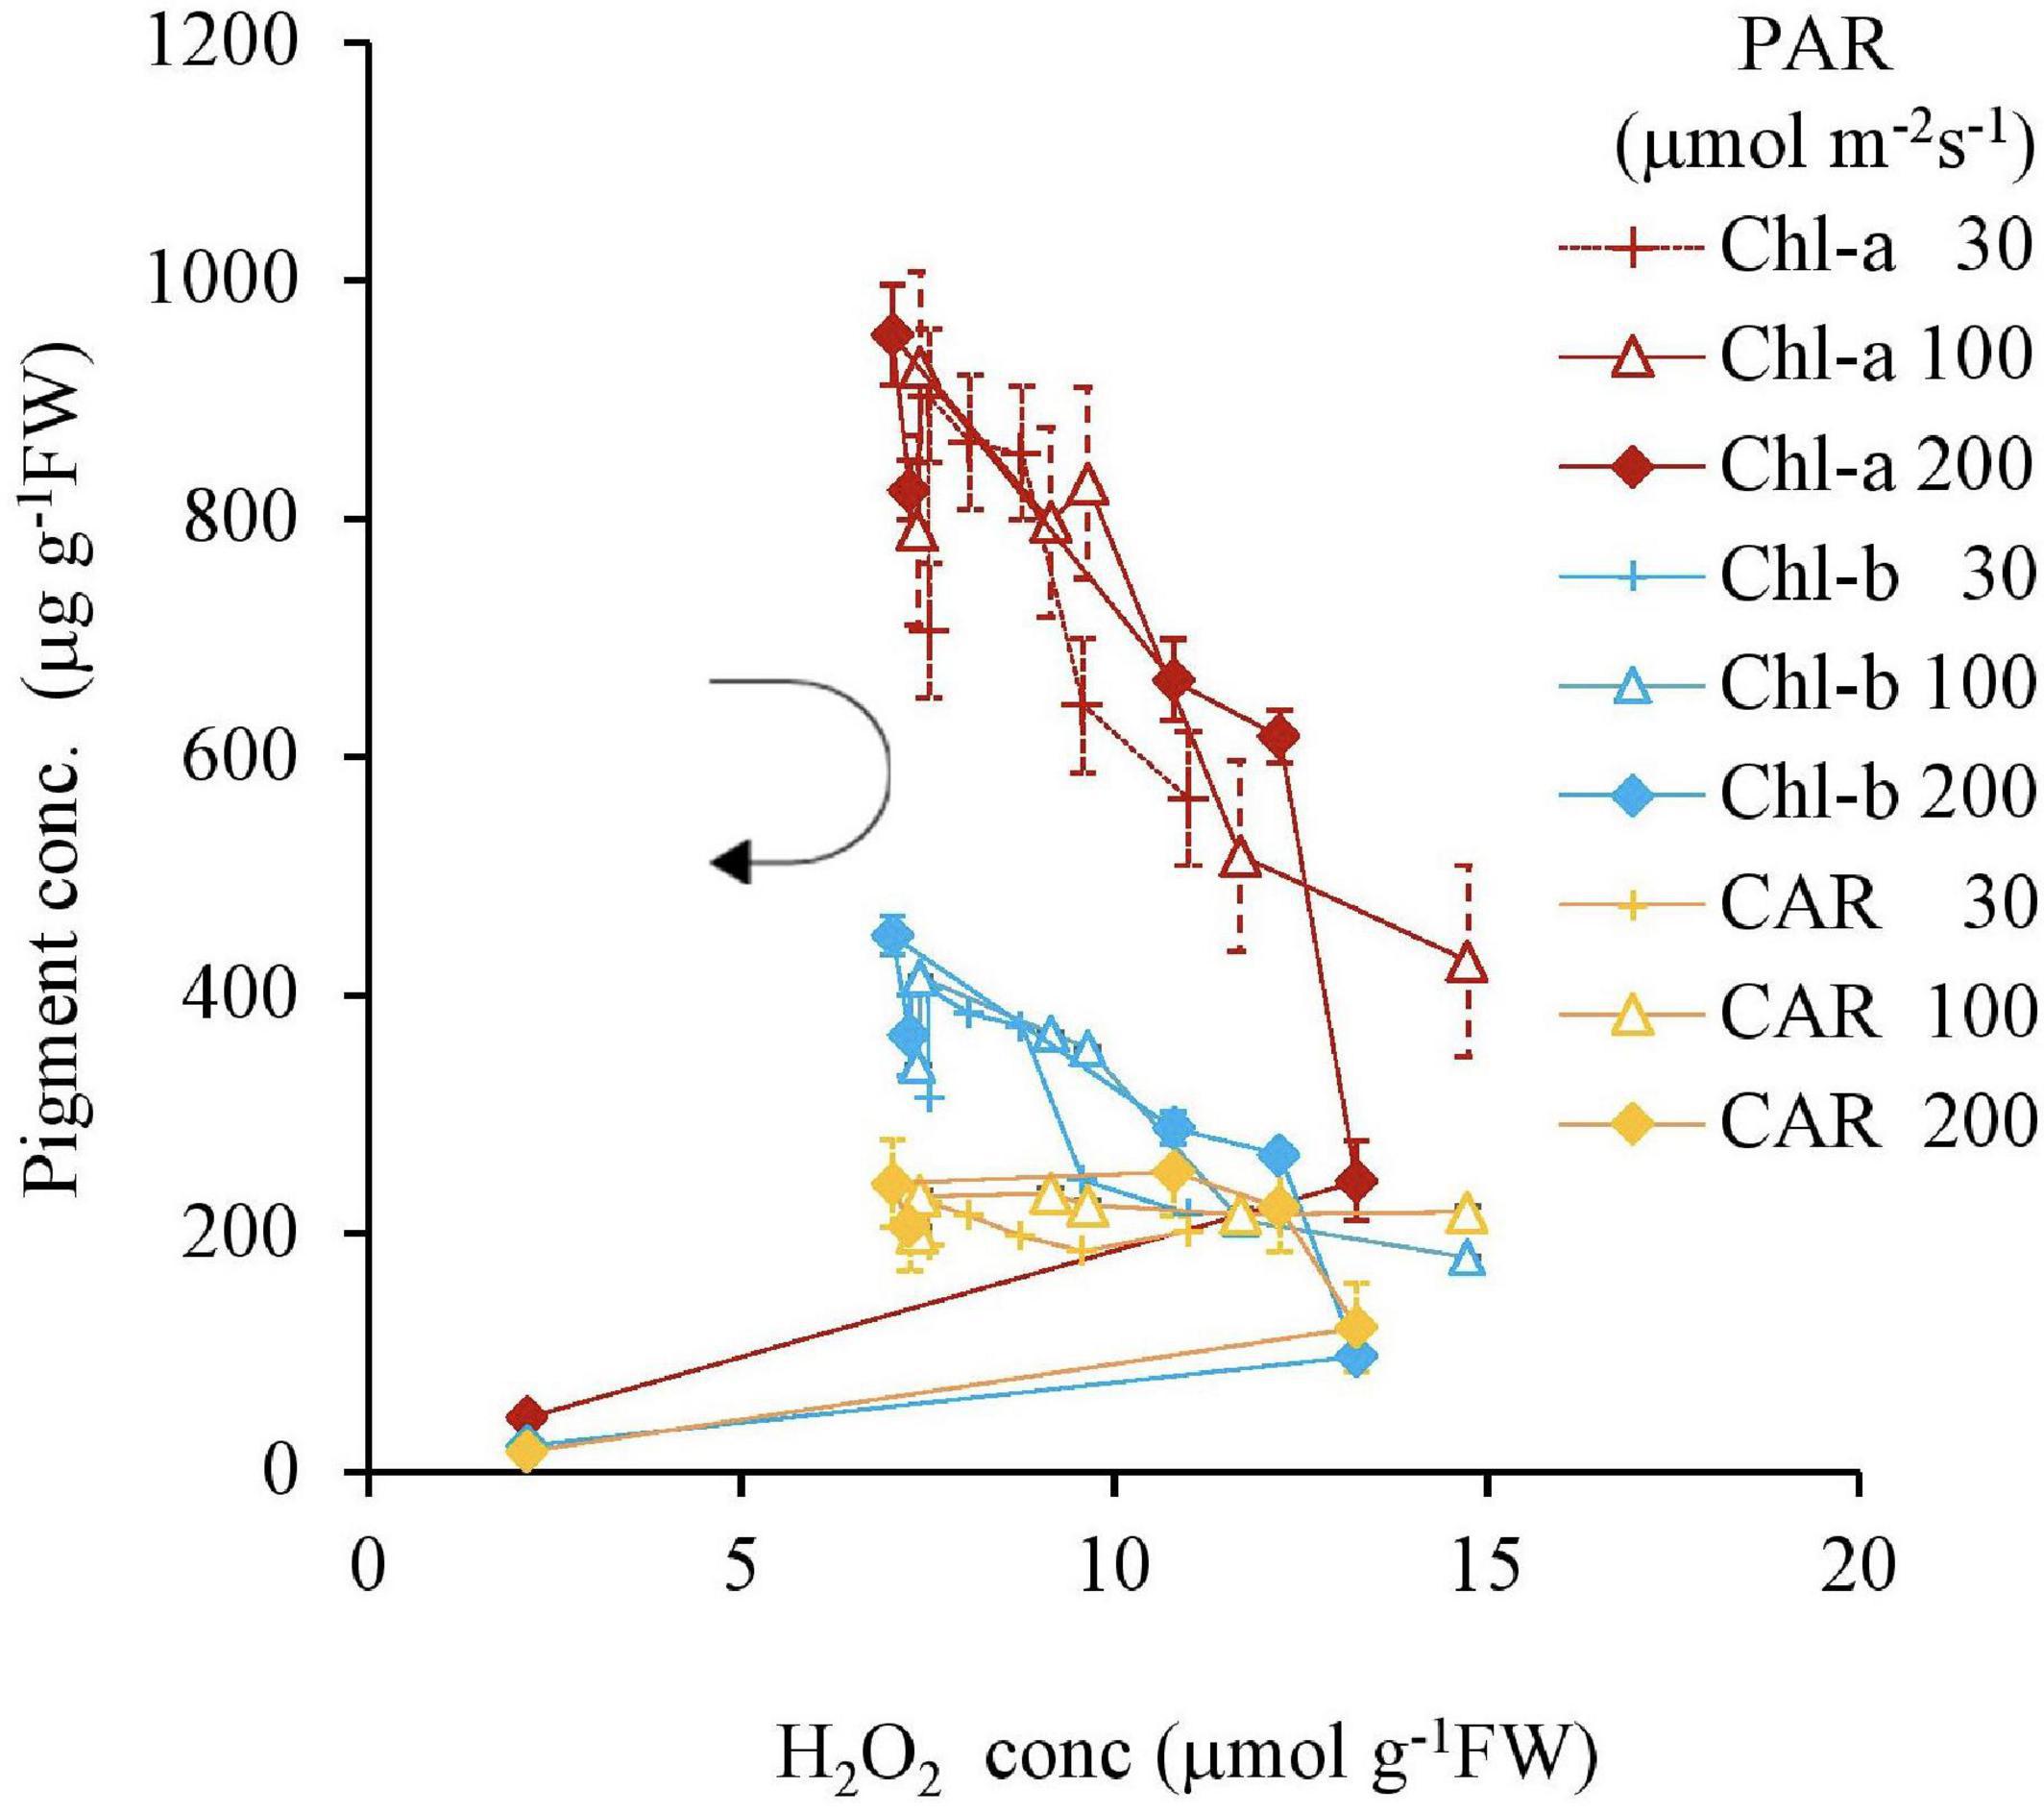
Figure 4. The relation between H2O2 and pigment concentrations of plant tissues after 7 days experiment as a function of Fe concentration in water and PAR intensities. The round arrow indicates the variational trend with increasing Fe concentration. Vertical bars indicate the standard deviation.
Similar to this trend, the Fv Fm–1 value had a unique negative correlation with the H2O2 concentration, except for the 200 μmol m–2s–1 of PAR and the 10 mg L–1 Fe condition (Table 2 and Figure 5). Both IAA and SGR had a similar relationship with the H2O2 concentration and had a significantly high correlation to each other, except for the 200 μmol m–2s–1 of PAR and the 10 mg L–1 Fe condition (Table 2 and Figures 6, 7).
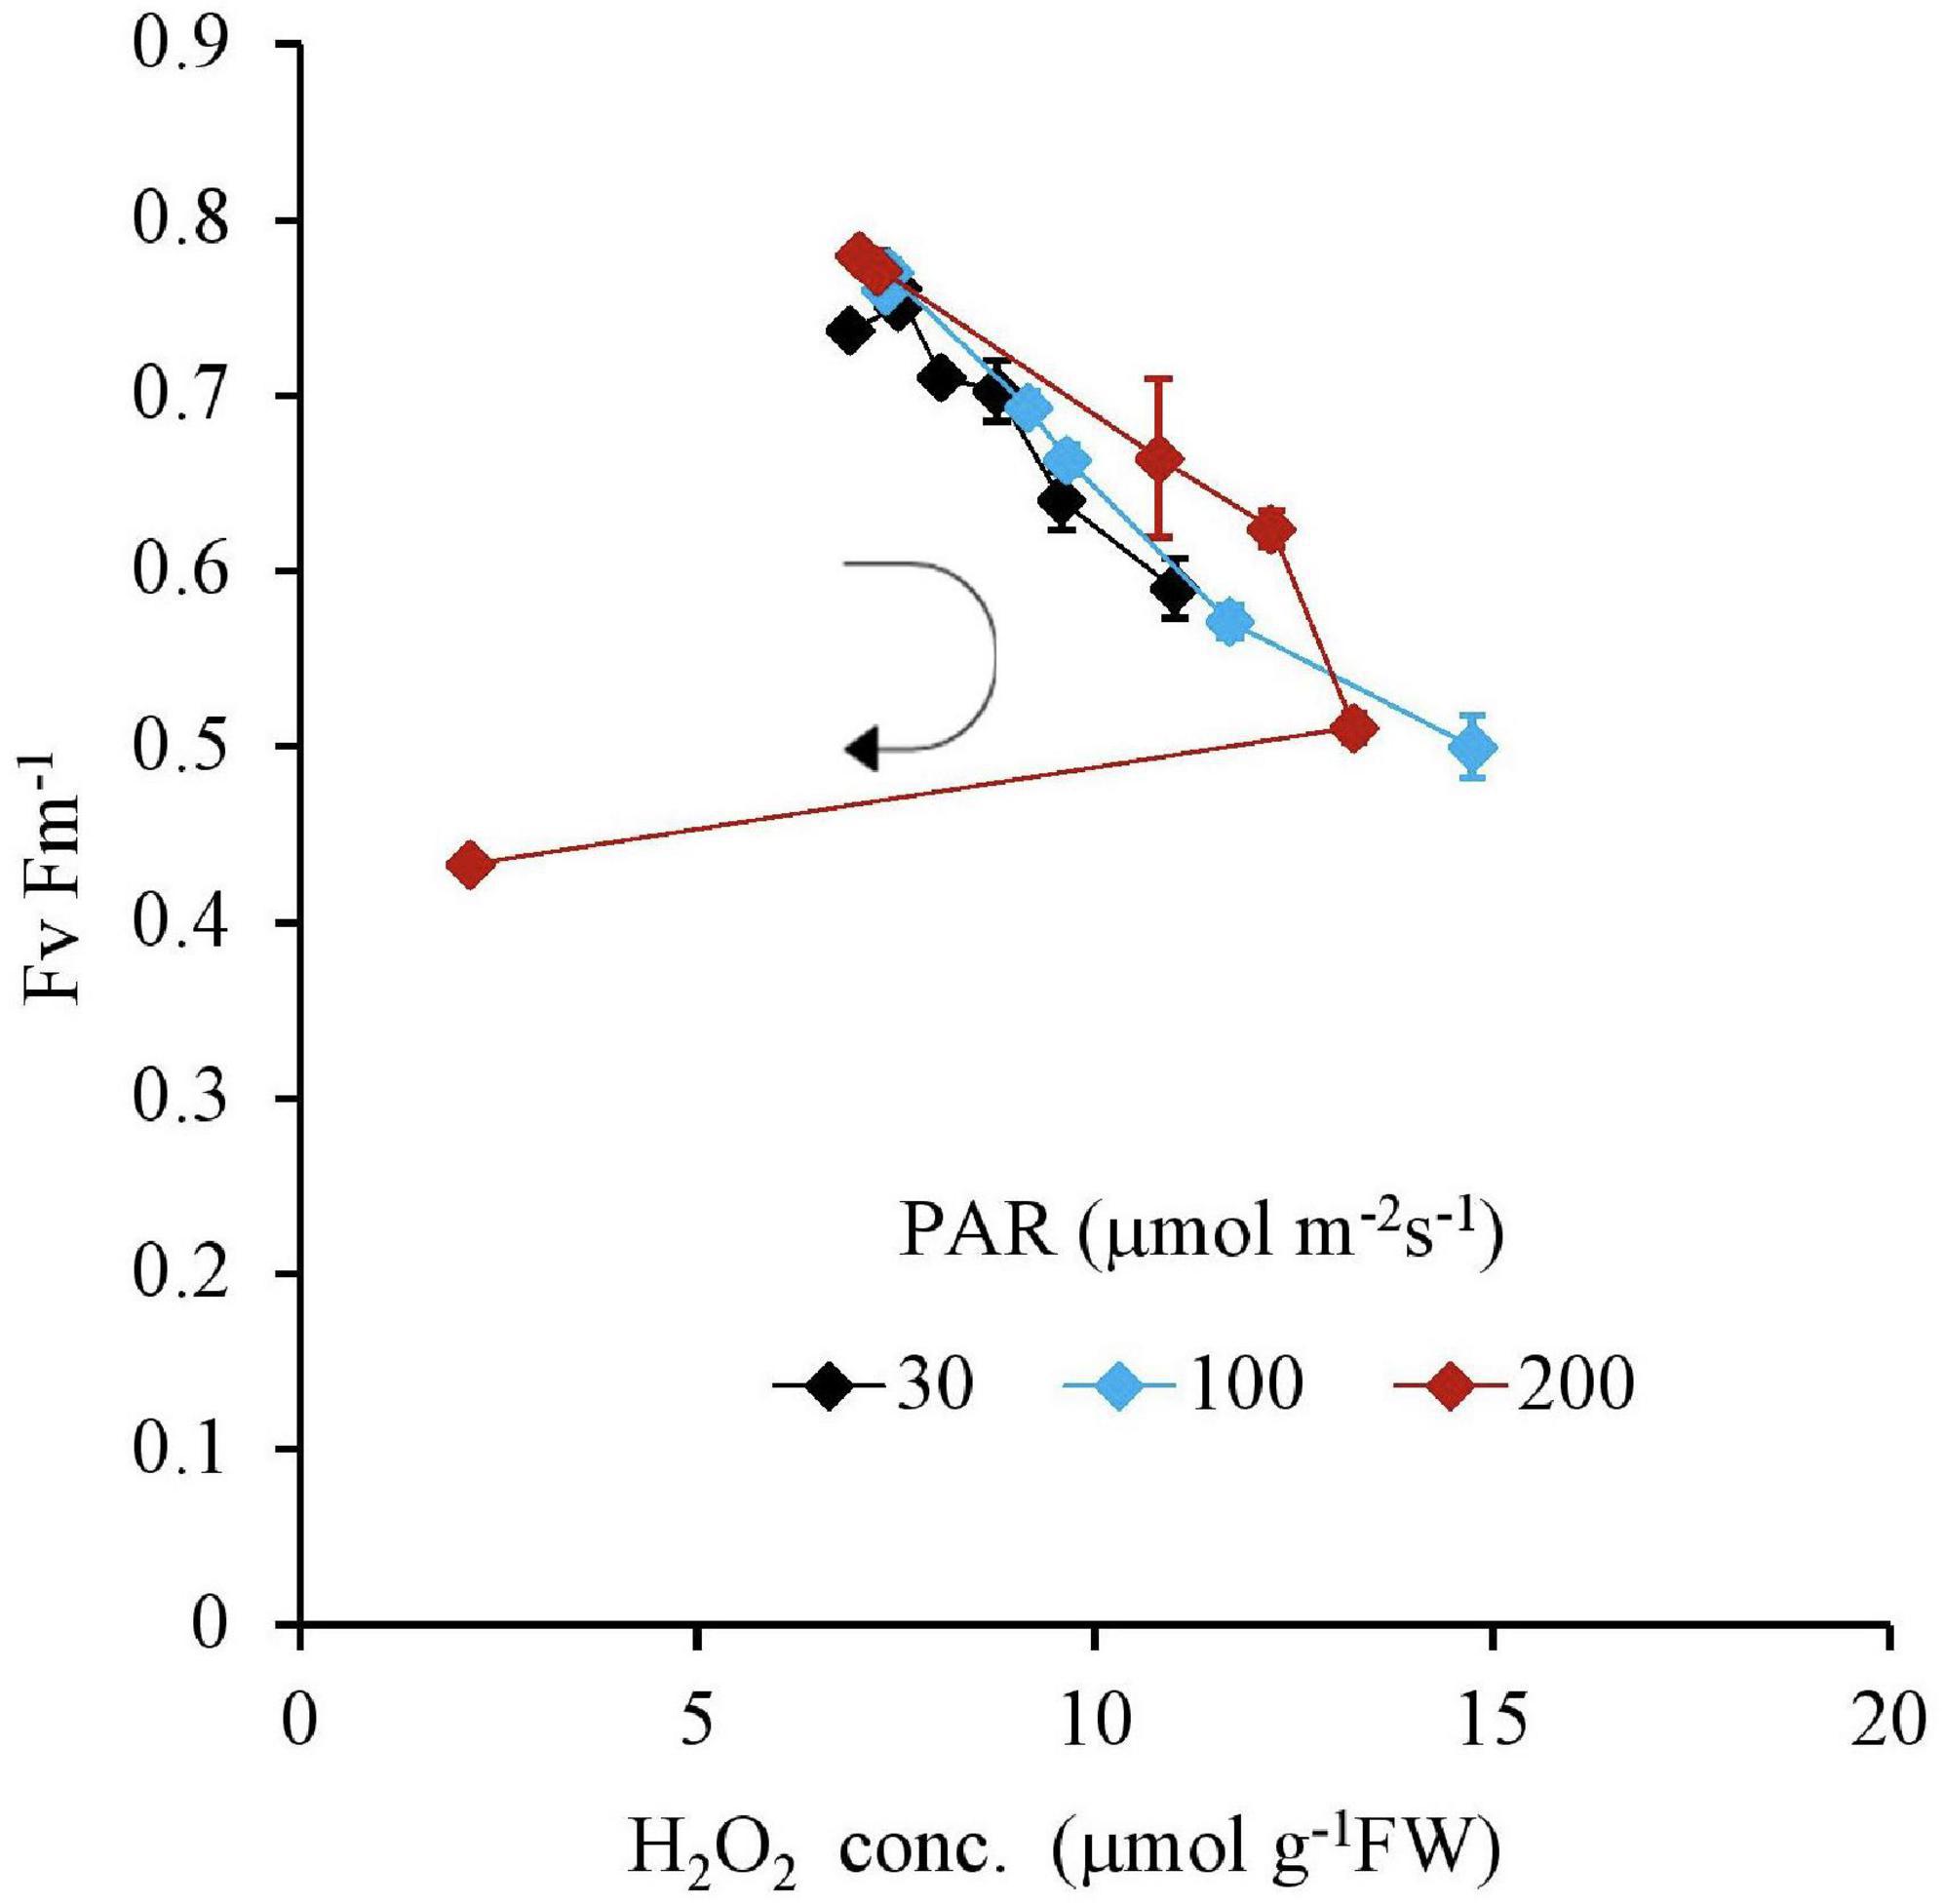
Figure 5. The relation between H2O2 and Fv Fm– 1 of plant tissues after 7 days as a function of Fe concentration in water and PAR intensities. The round arrow indicates the variational trend with increasing Fe concentration. Vertical bars indicate the standard deviation.
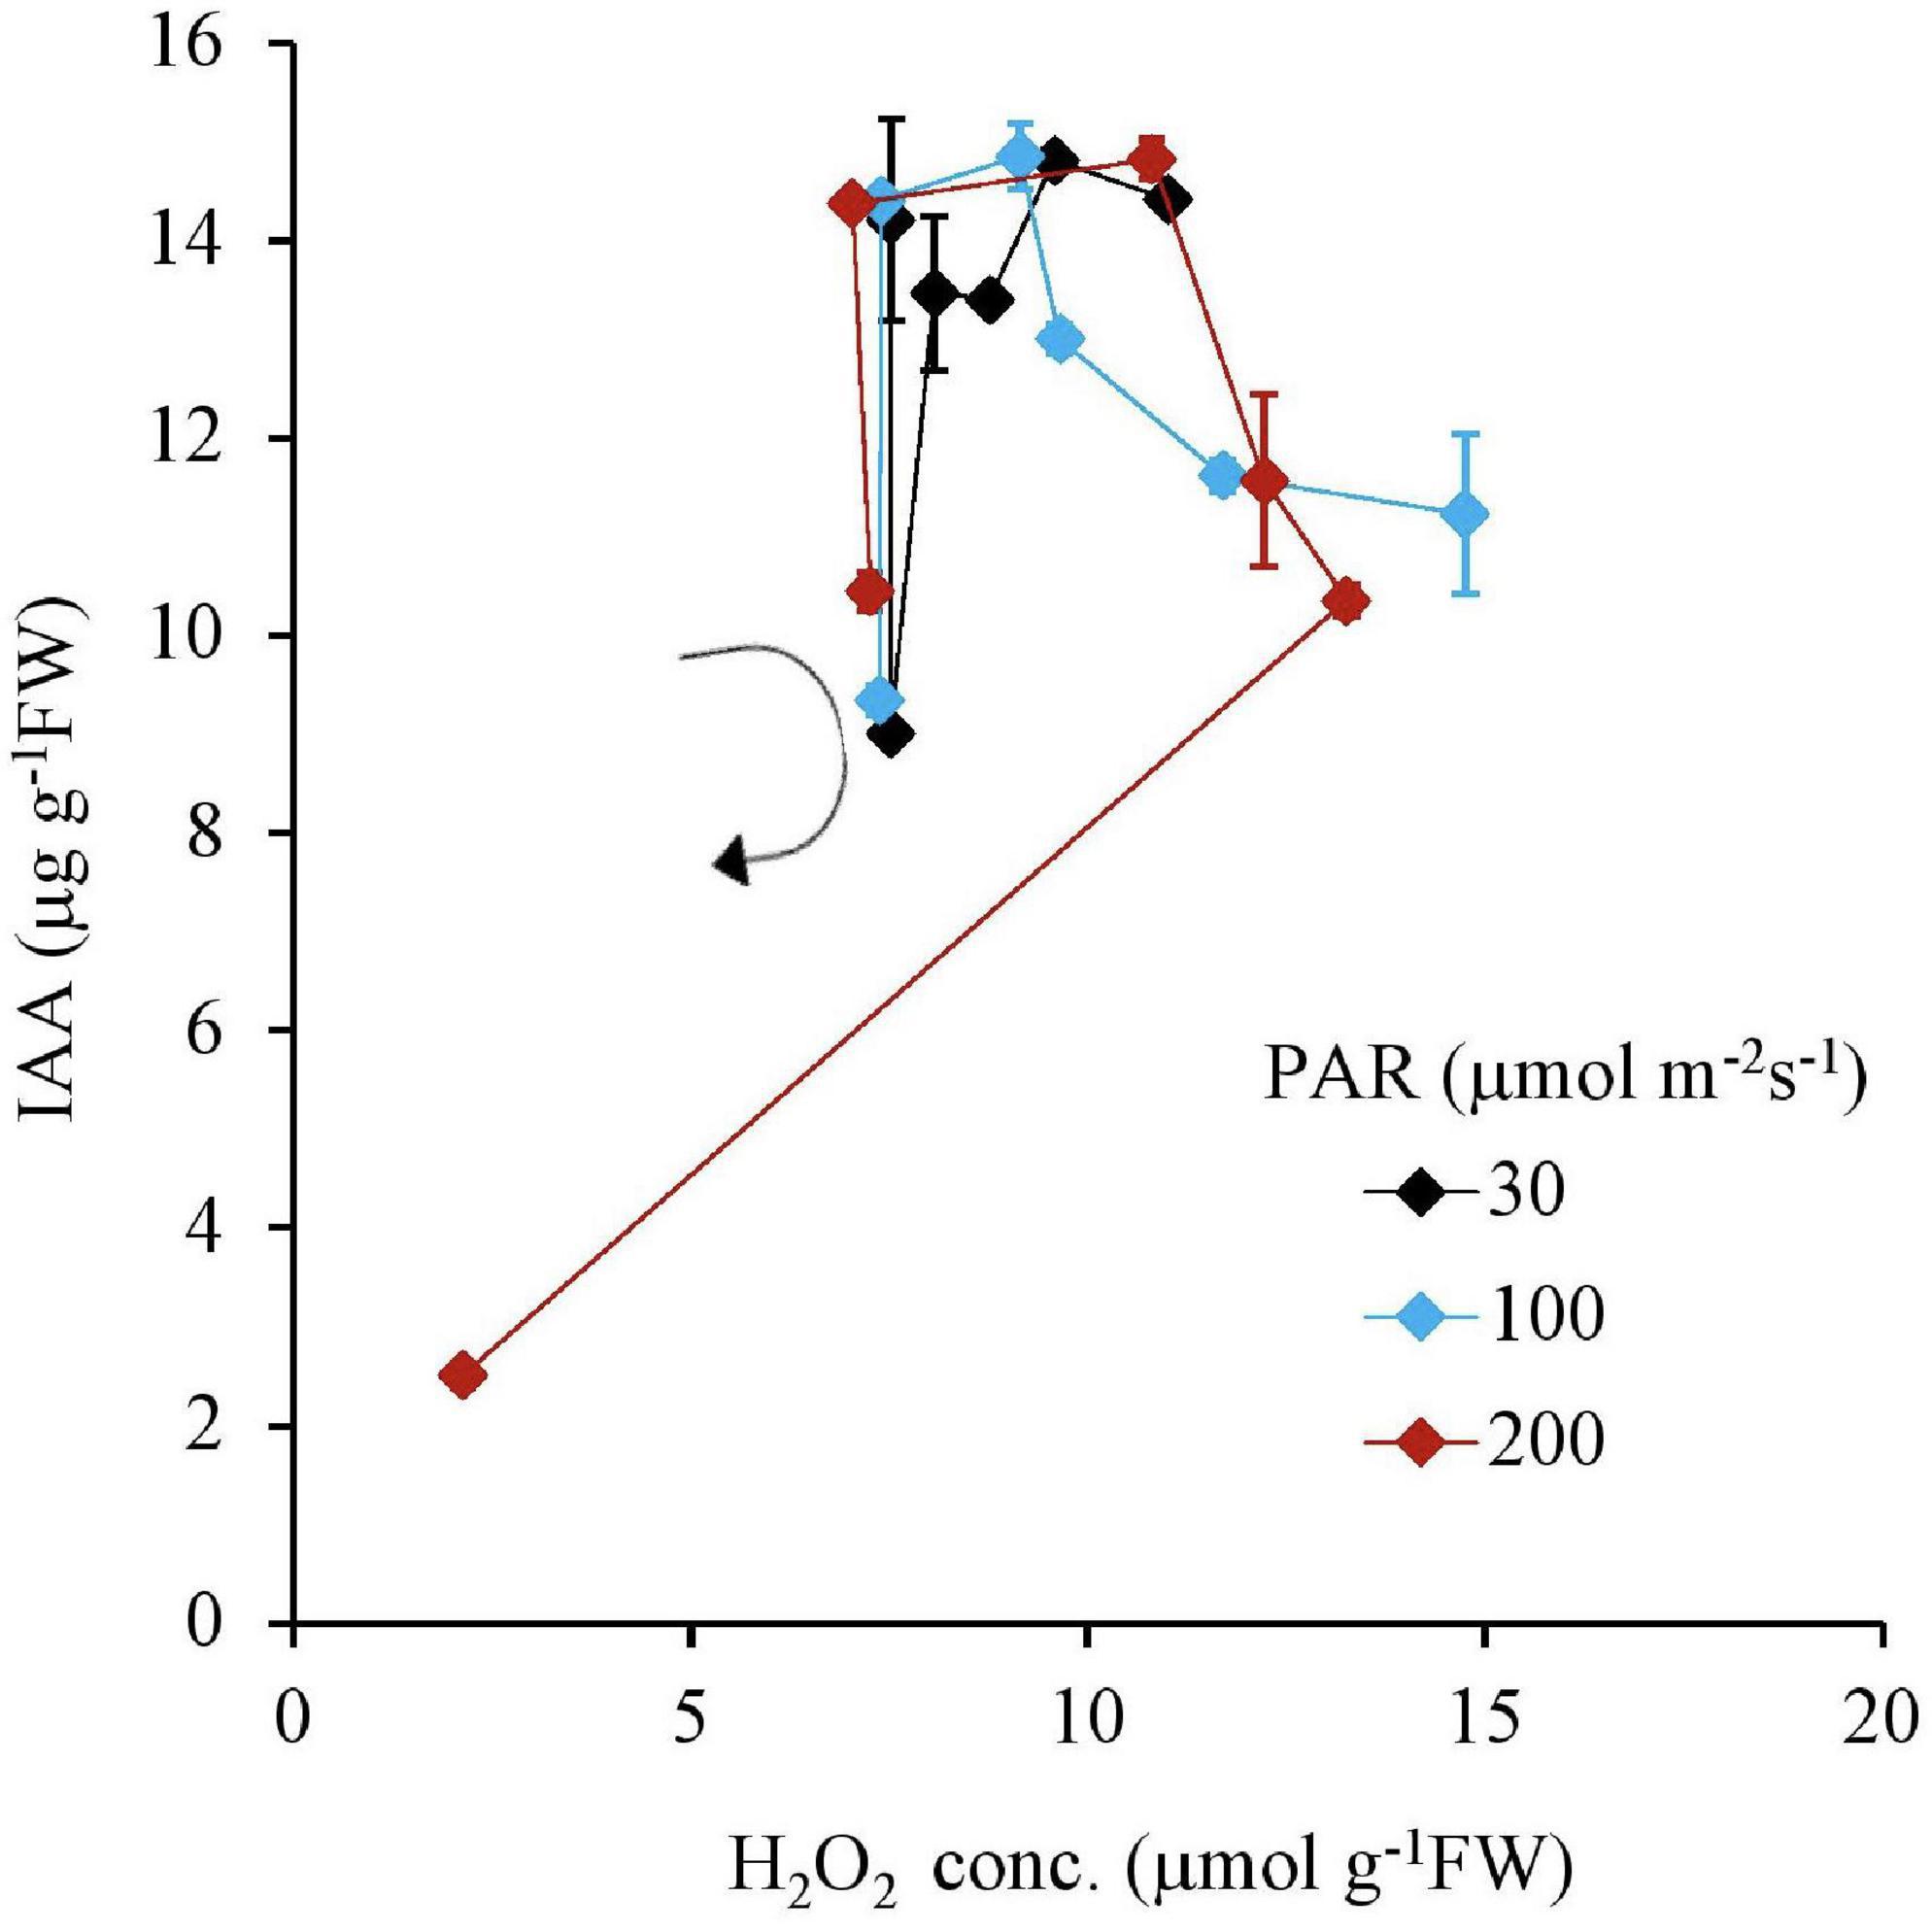
Figure 6. The relation between H2O2 and IAA concentrations of plant tissues after 7 days experiment as a function of Fe concentration in water and PAR intensities. The round arrow indicates the variational trend with increasing Fe concentration. Vertical bars indicate the standard deviation.
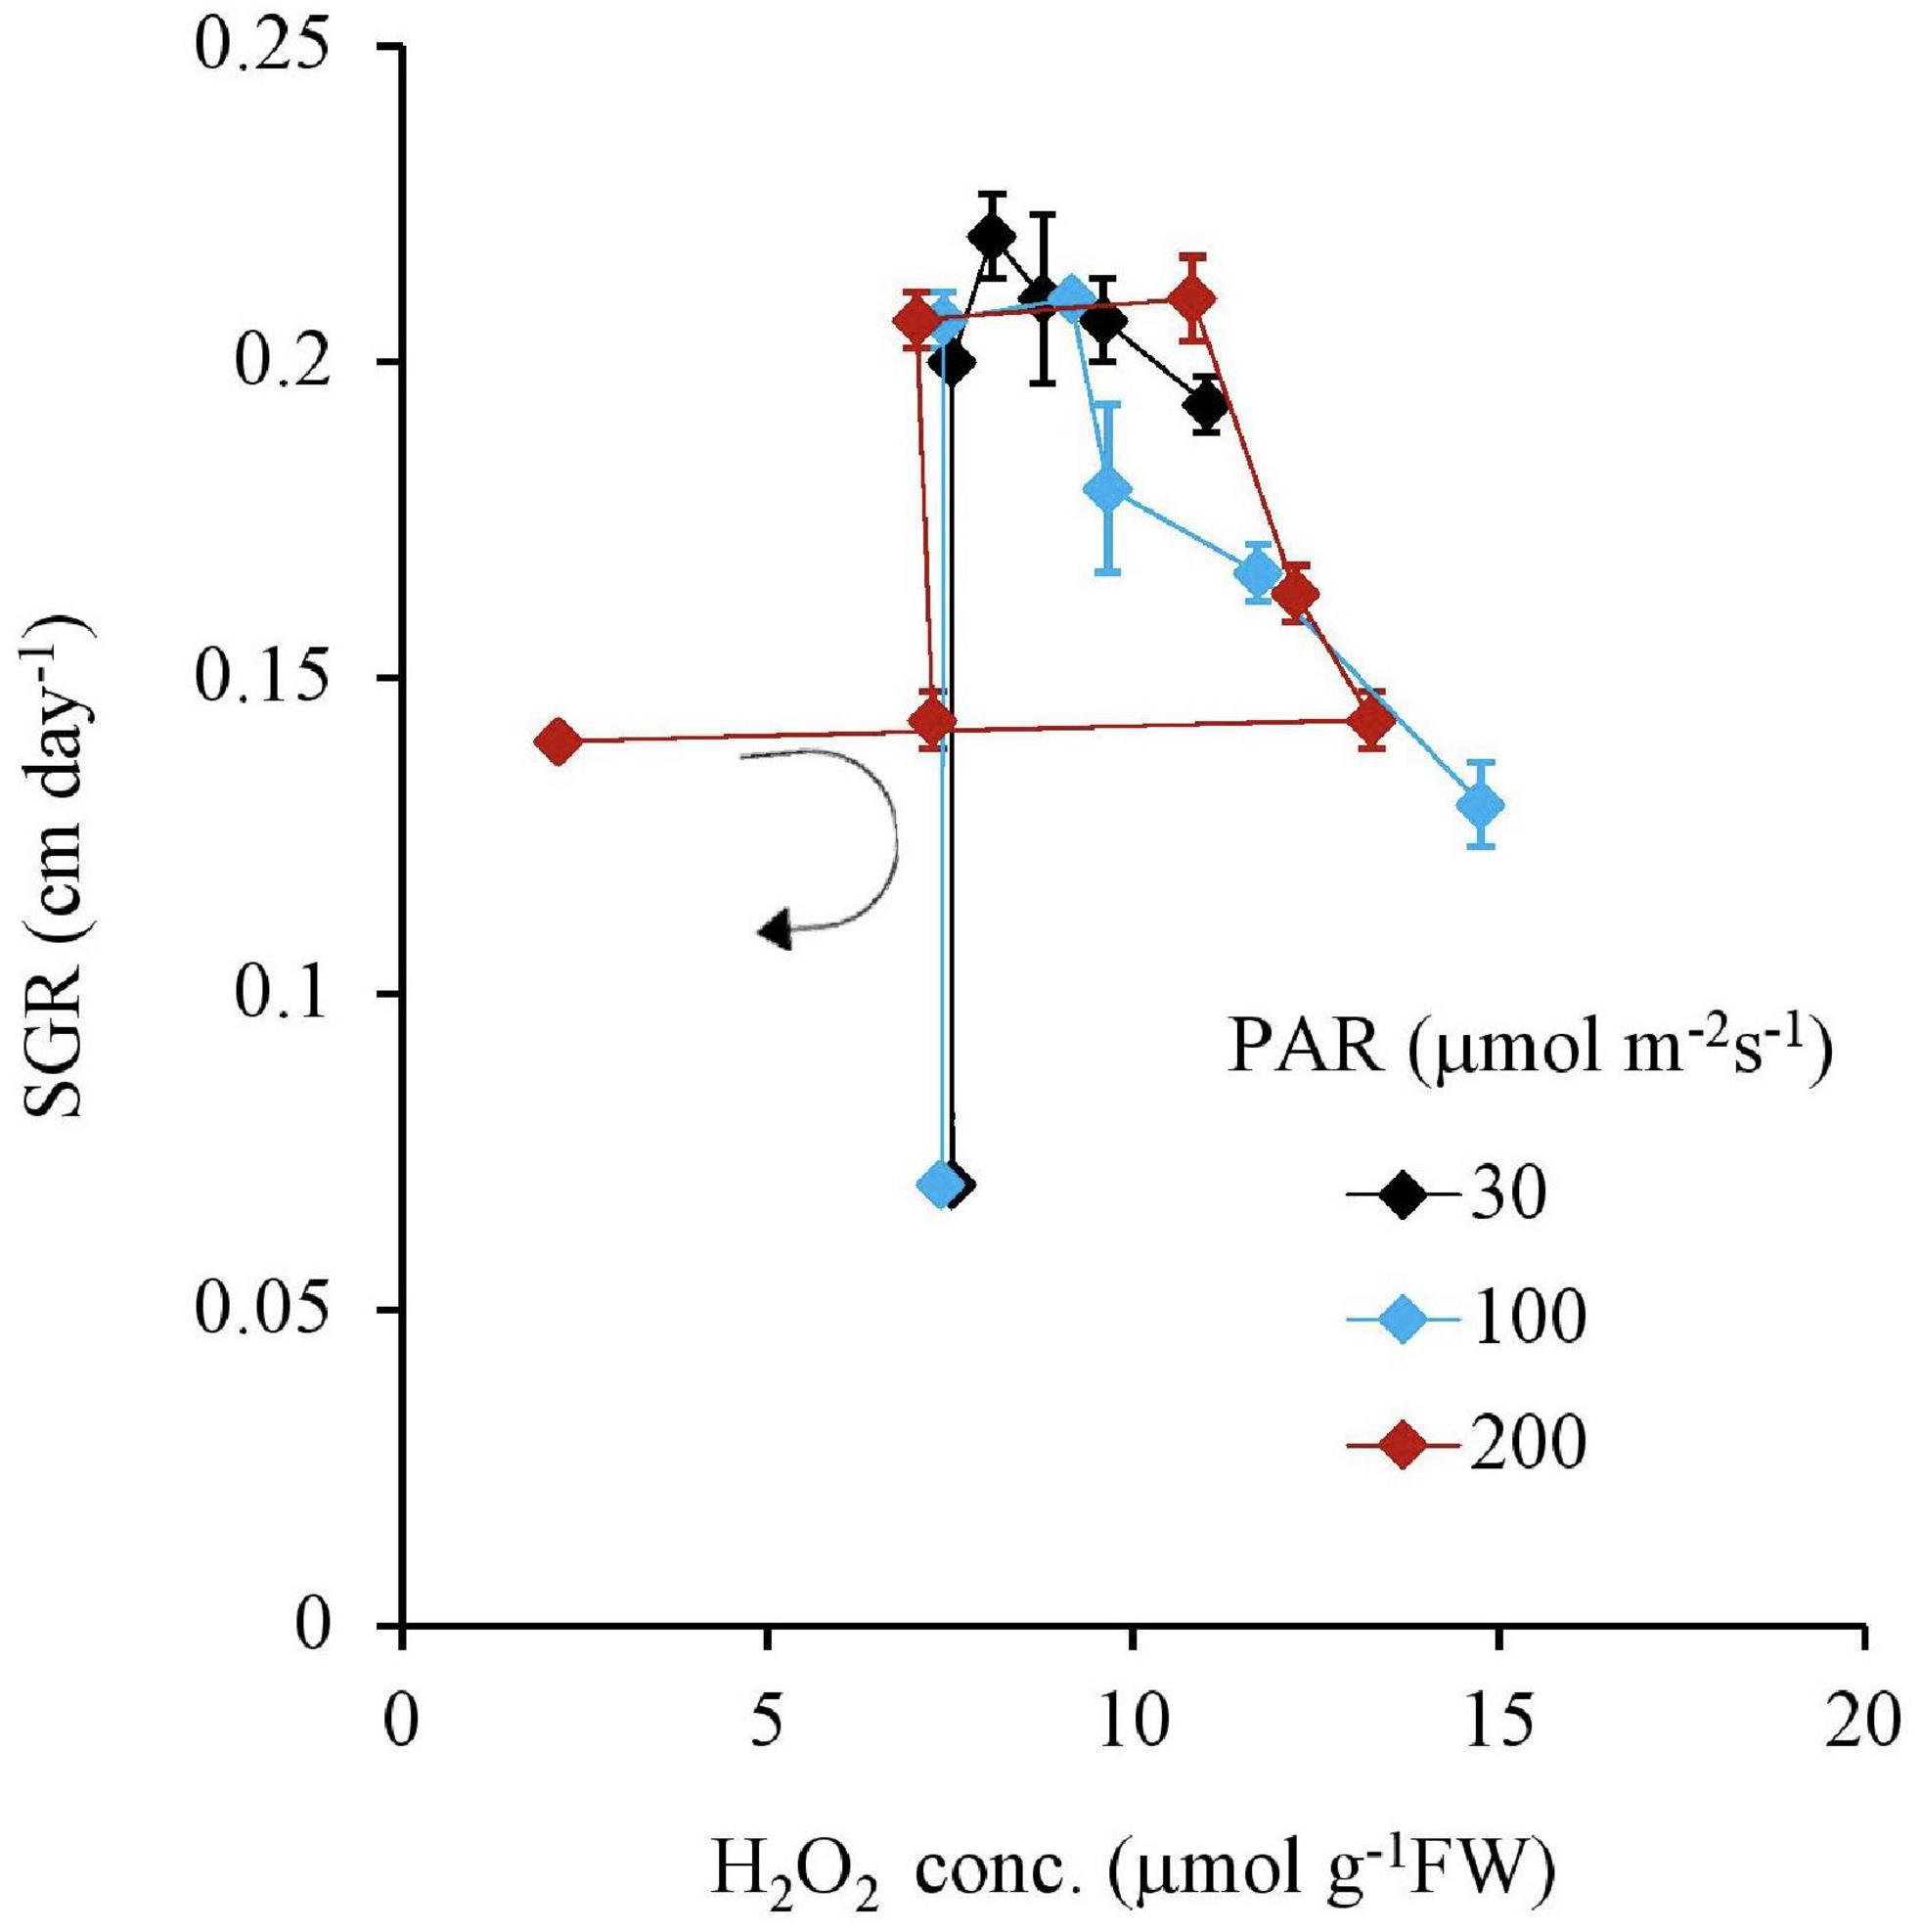
Figure 7. The relation between the H2O2 concentration of plant tissues and SGR after 7 days experiment as a function of Fe concentration in water and PAR intensities. The round arrow indicates the variational trend with increasing Fe concentration. Vertical bars indicate the standard deviation.
For 30, 100, and 200 μmol m–2s–1 of PAR, a negative correlation was found with an increasing Fe concentration for CAT and APX in Table 2 except for 0 mg L–1 Fe concentration and 10 mg L–1 and 200 μmol m–2 s–1 PAR; however, there was a positive correlation for POD (Table 2 and Figure 8).
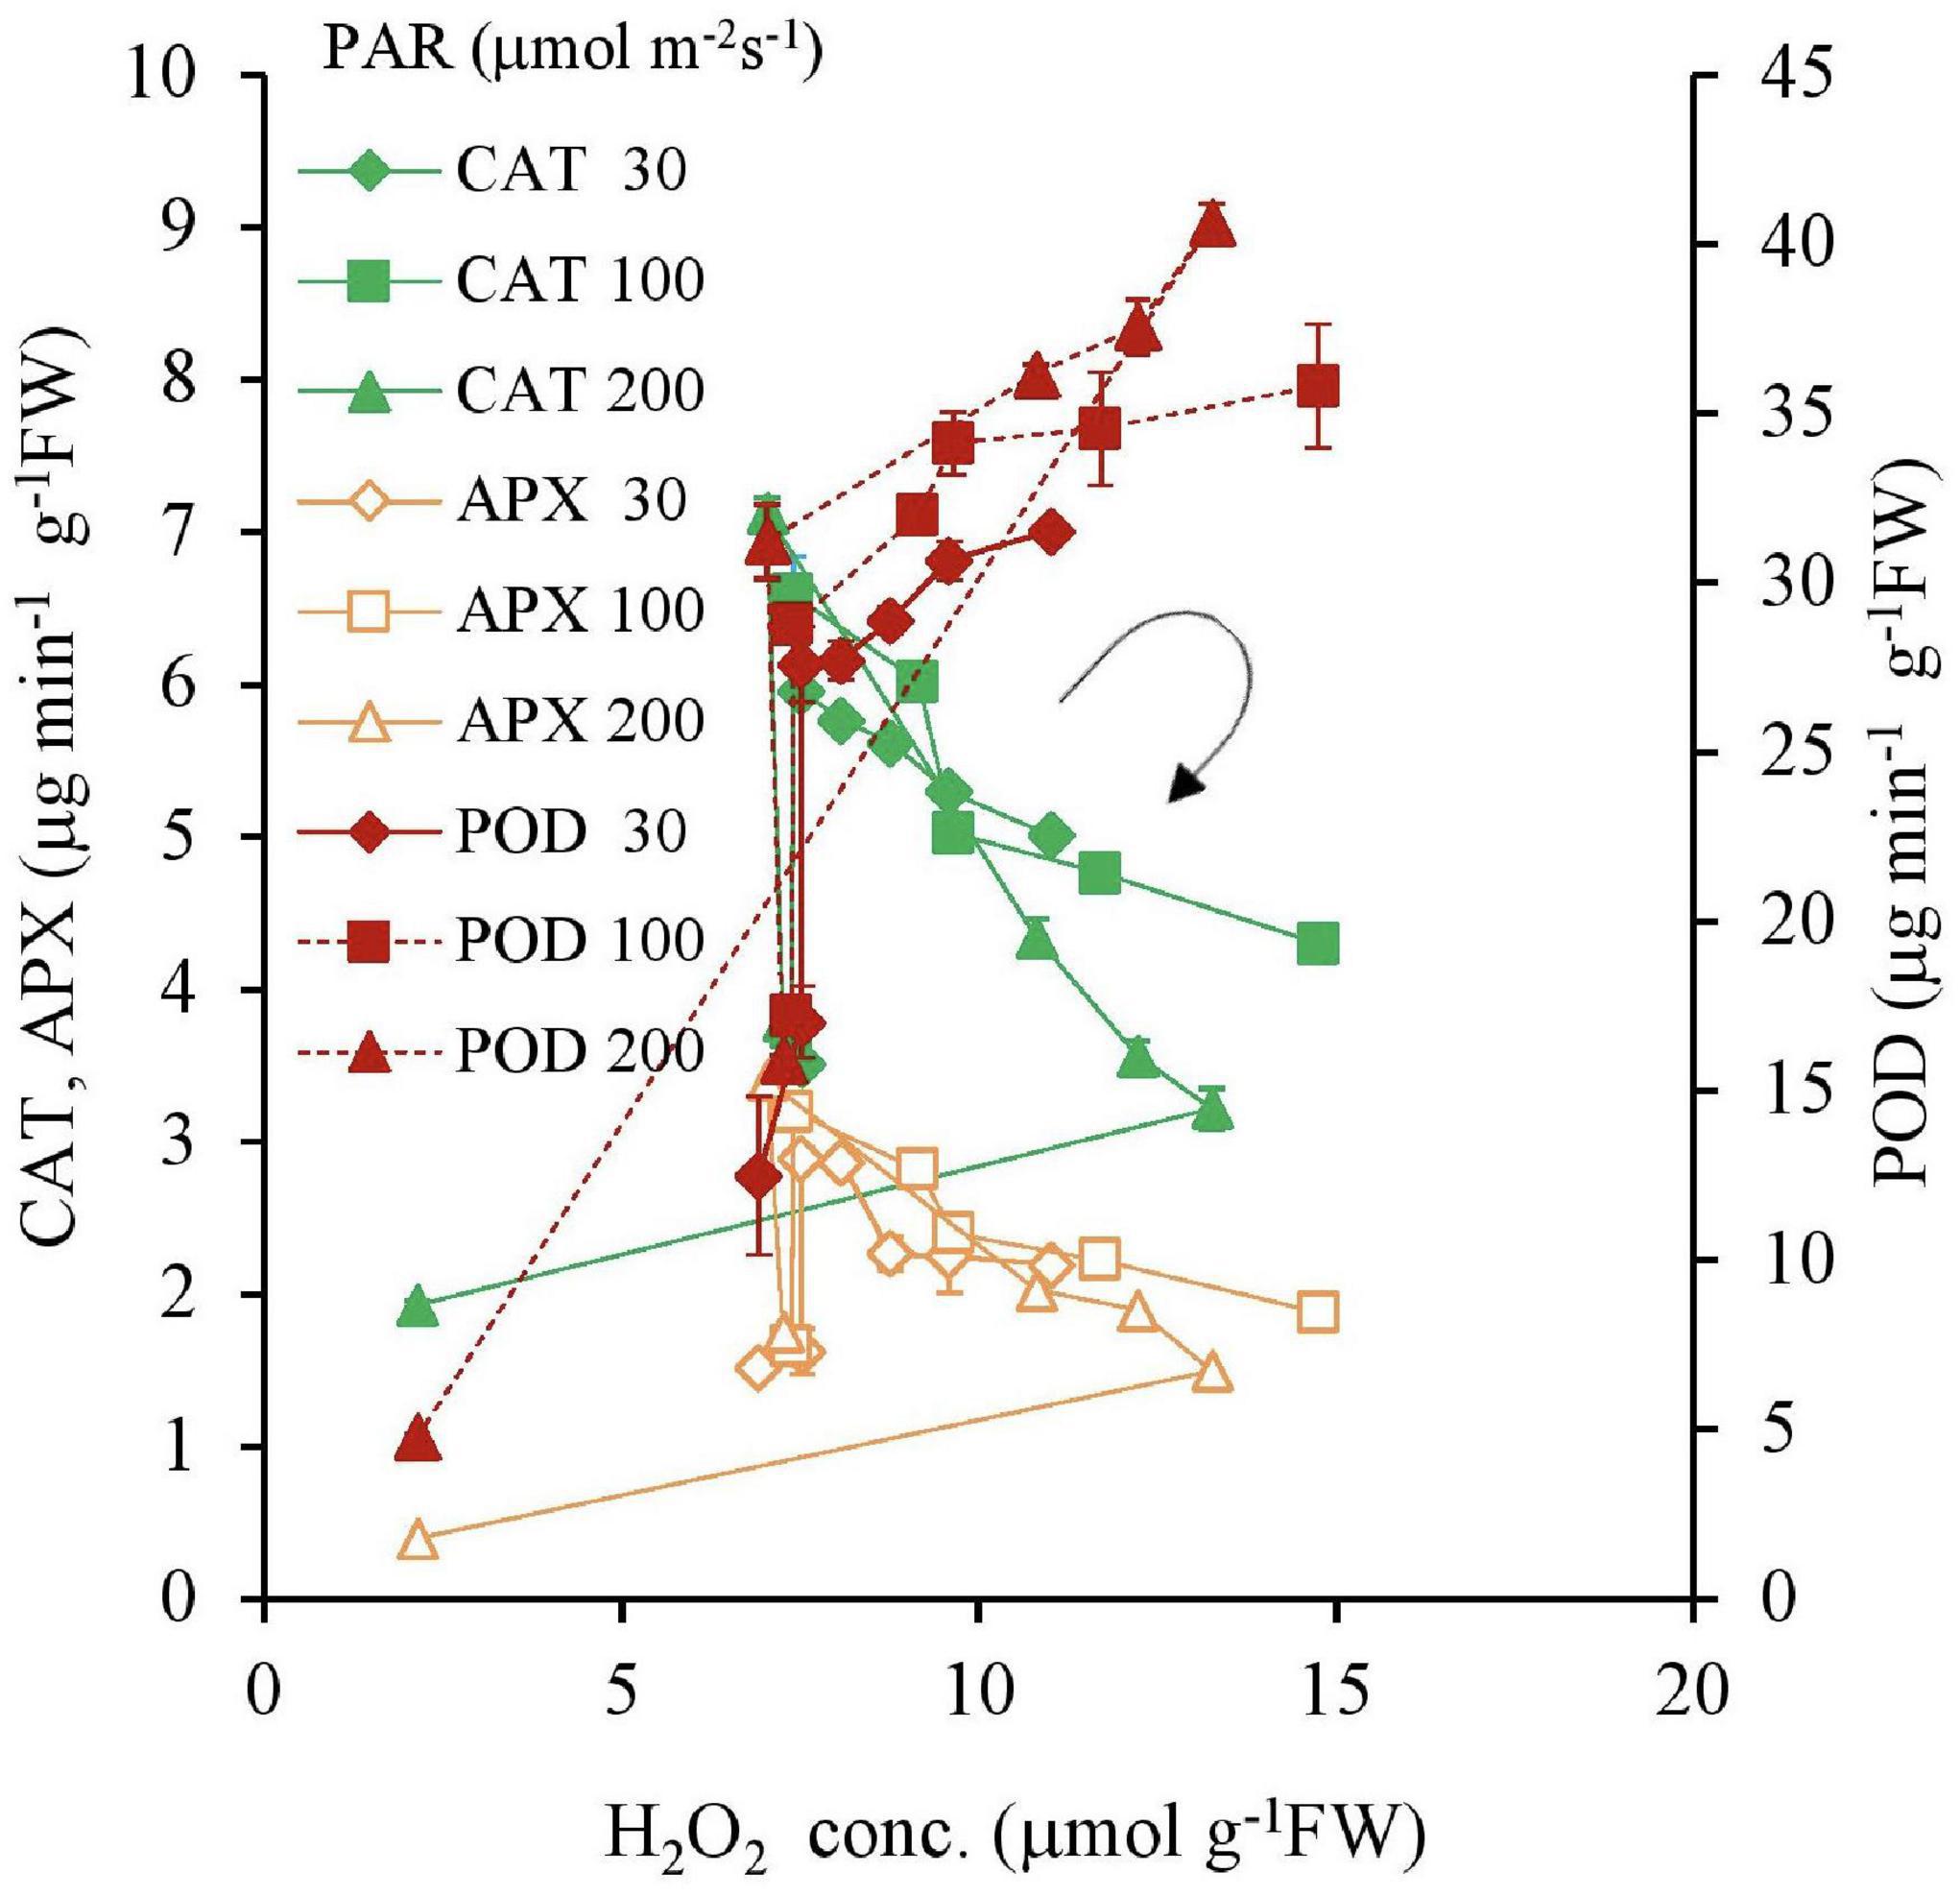
Figure 8. The relations between H2O2, CAT, POD, and APX concentrations of plant tissues after 7 days experiment as a function of Fe concentration in water and PAR intensities. The round arrow indicates the variational trend with increasing Fe concentration. Vertical bars indicate the standard deviation.
Long-Term Response to the Different Light Intensities
The H2O2 concentration variation from the beginning of the experiment to 30 days after its commencement shown in Figures 9, 10 with different light intensities. Regardless of temperature, the H2O2 concentration was higher with low PAR for 50–200 μmol m–2s–1 of PAR (Table 3). Although the H2O2 concentration rose after the experiments began, it declined afterward until the 15th day with 50–100 μmol m–2s–1 of PAR and then became stable; there was no significant correlation with time (p > 0.7 for 50–100 μmol m–2s–1 of PAR). However, the H2O2 concentration continued to decline slightly with 200 μmol m–2s–1, and the H2O2 concentration for 15–30 days had a significant negative correlation with PAR in 50–200 μmol m–2 s–1 [Table 3; empirically given by H2O2 (μmol g–1FW) = 0.025*PAR (μmol m–2s–1) + 14.9 for 20°C, and H2O2 (μmol g–1FW) = 0.025*PAR (μmol m–2s–1) + 11.1 for 25°C].
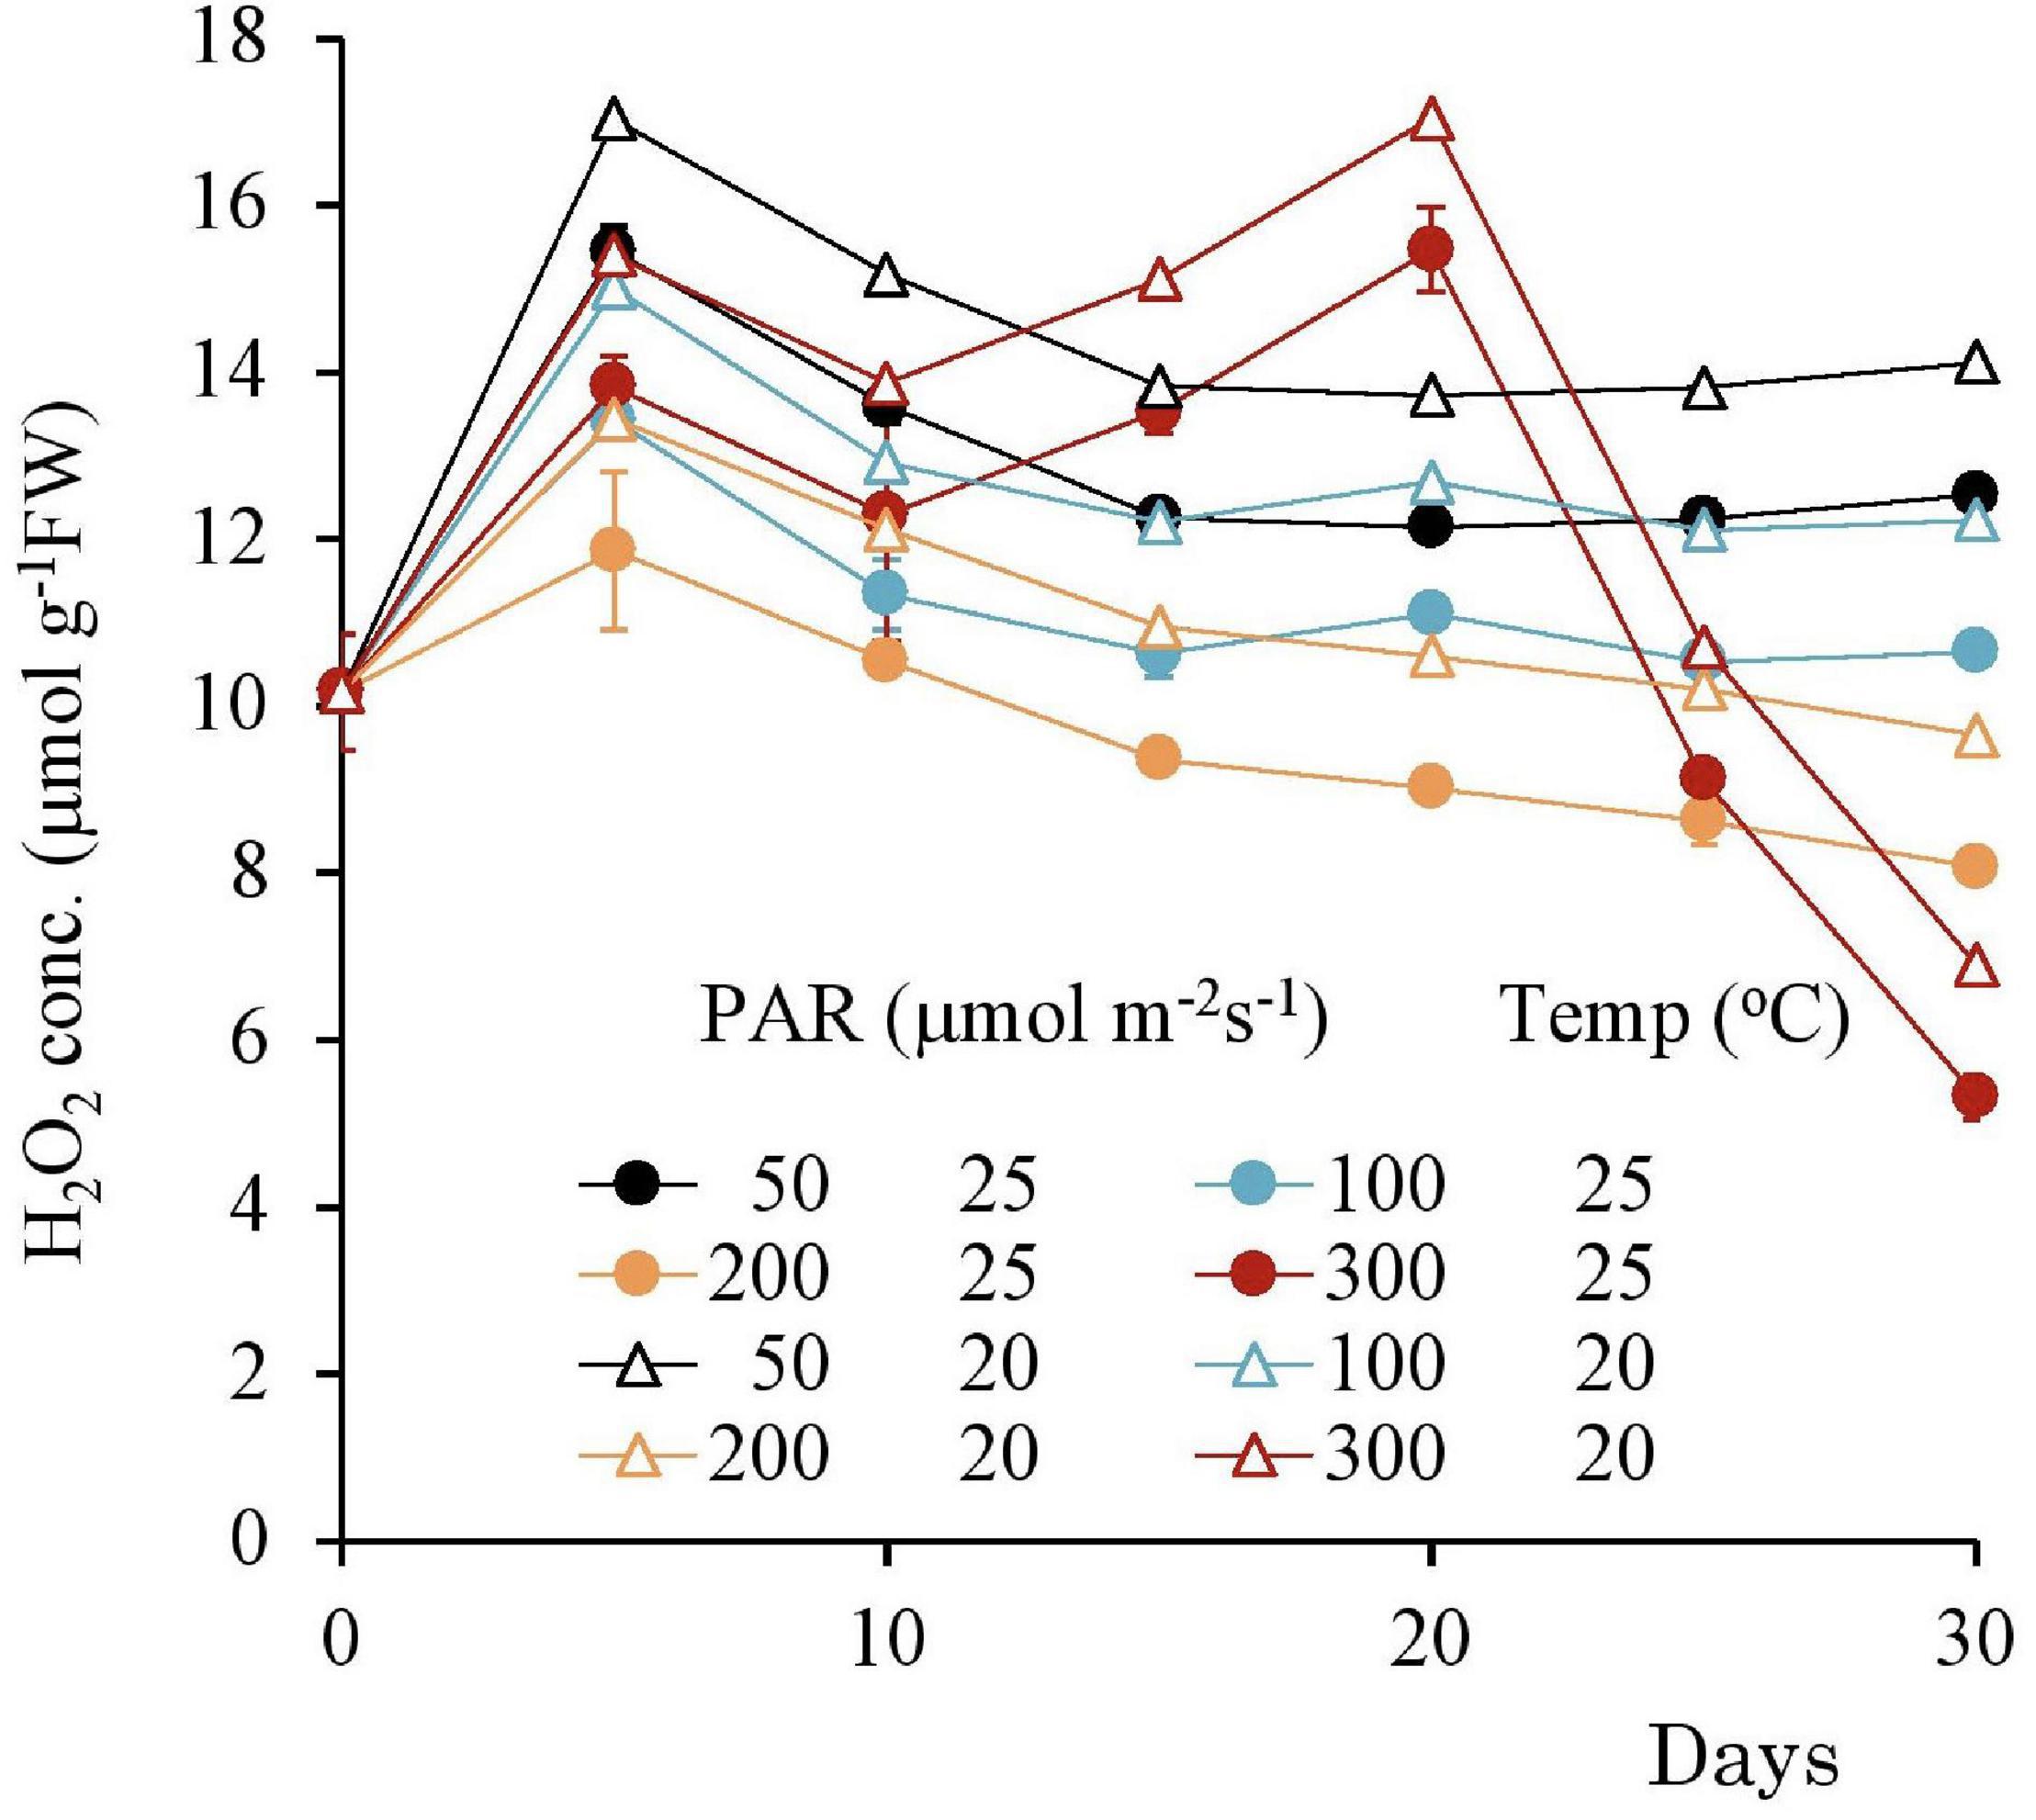
Figure 9. The variational trend of the H2O2 concentration of plant tissues after 7 days experiment with respect to different PAR. Vertical bars indicate the standard deviation.
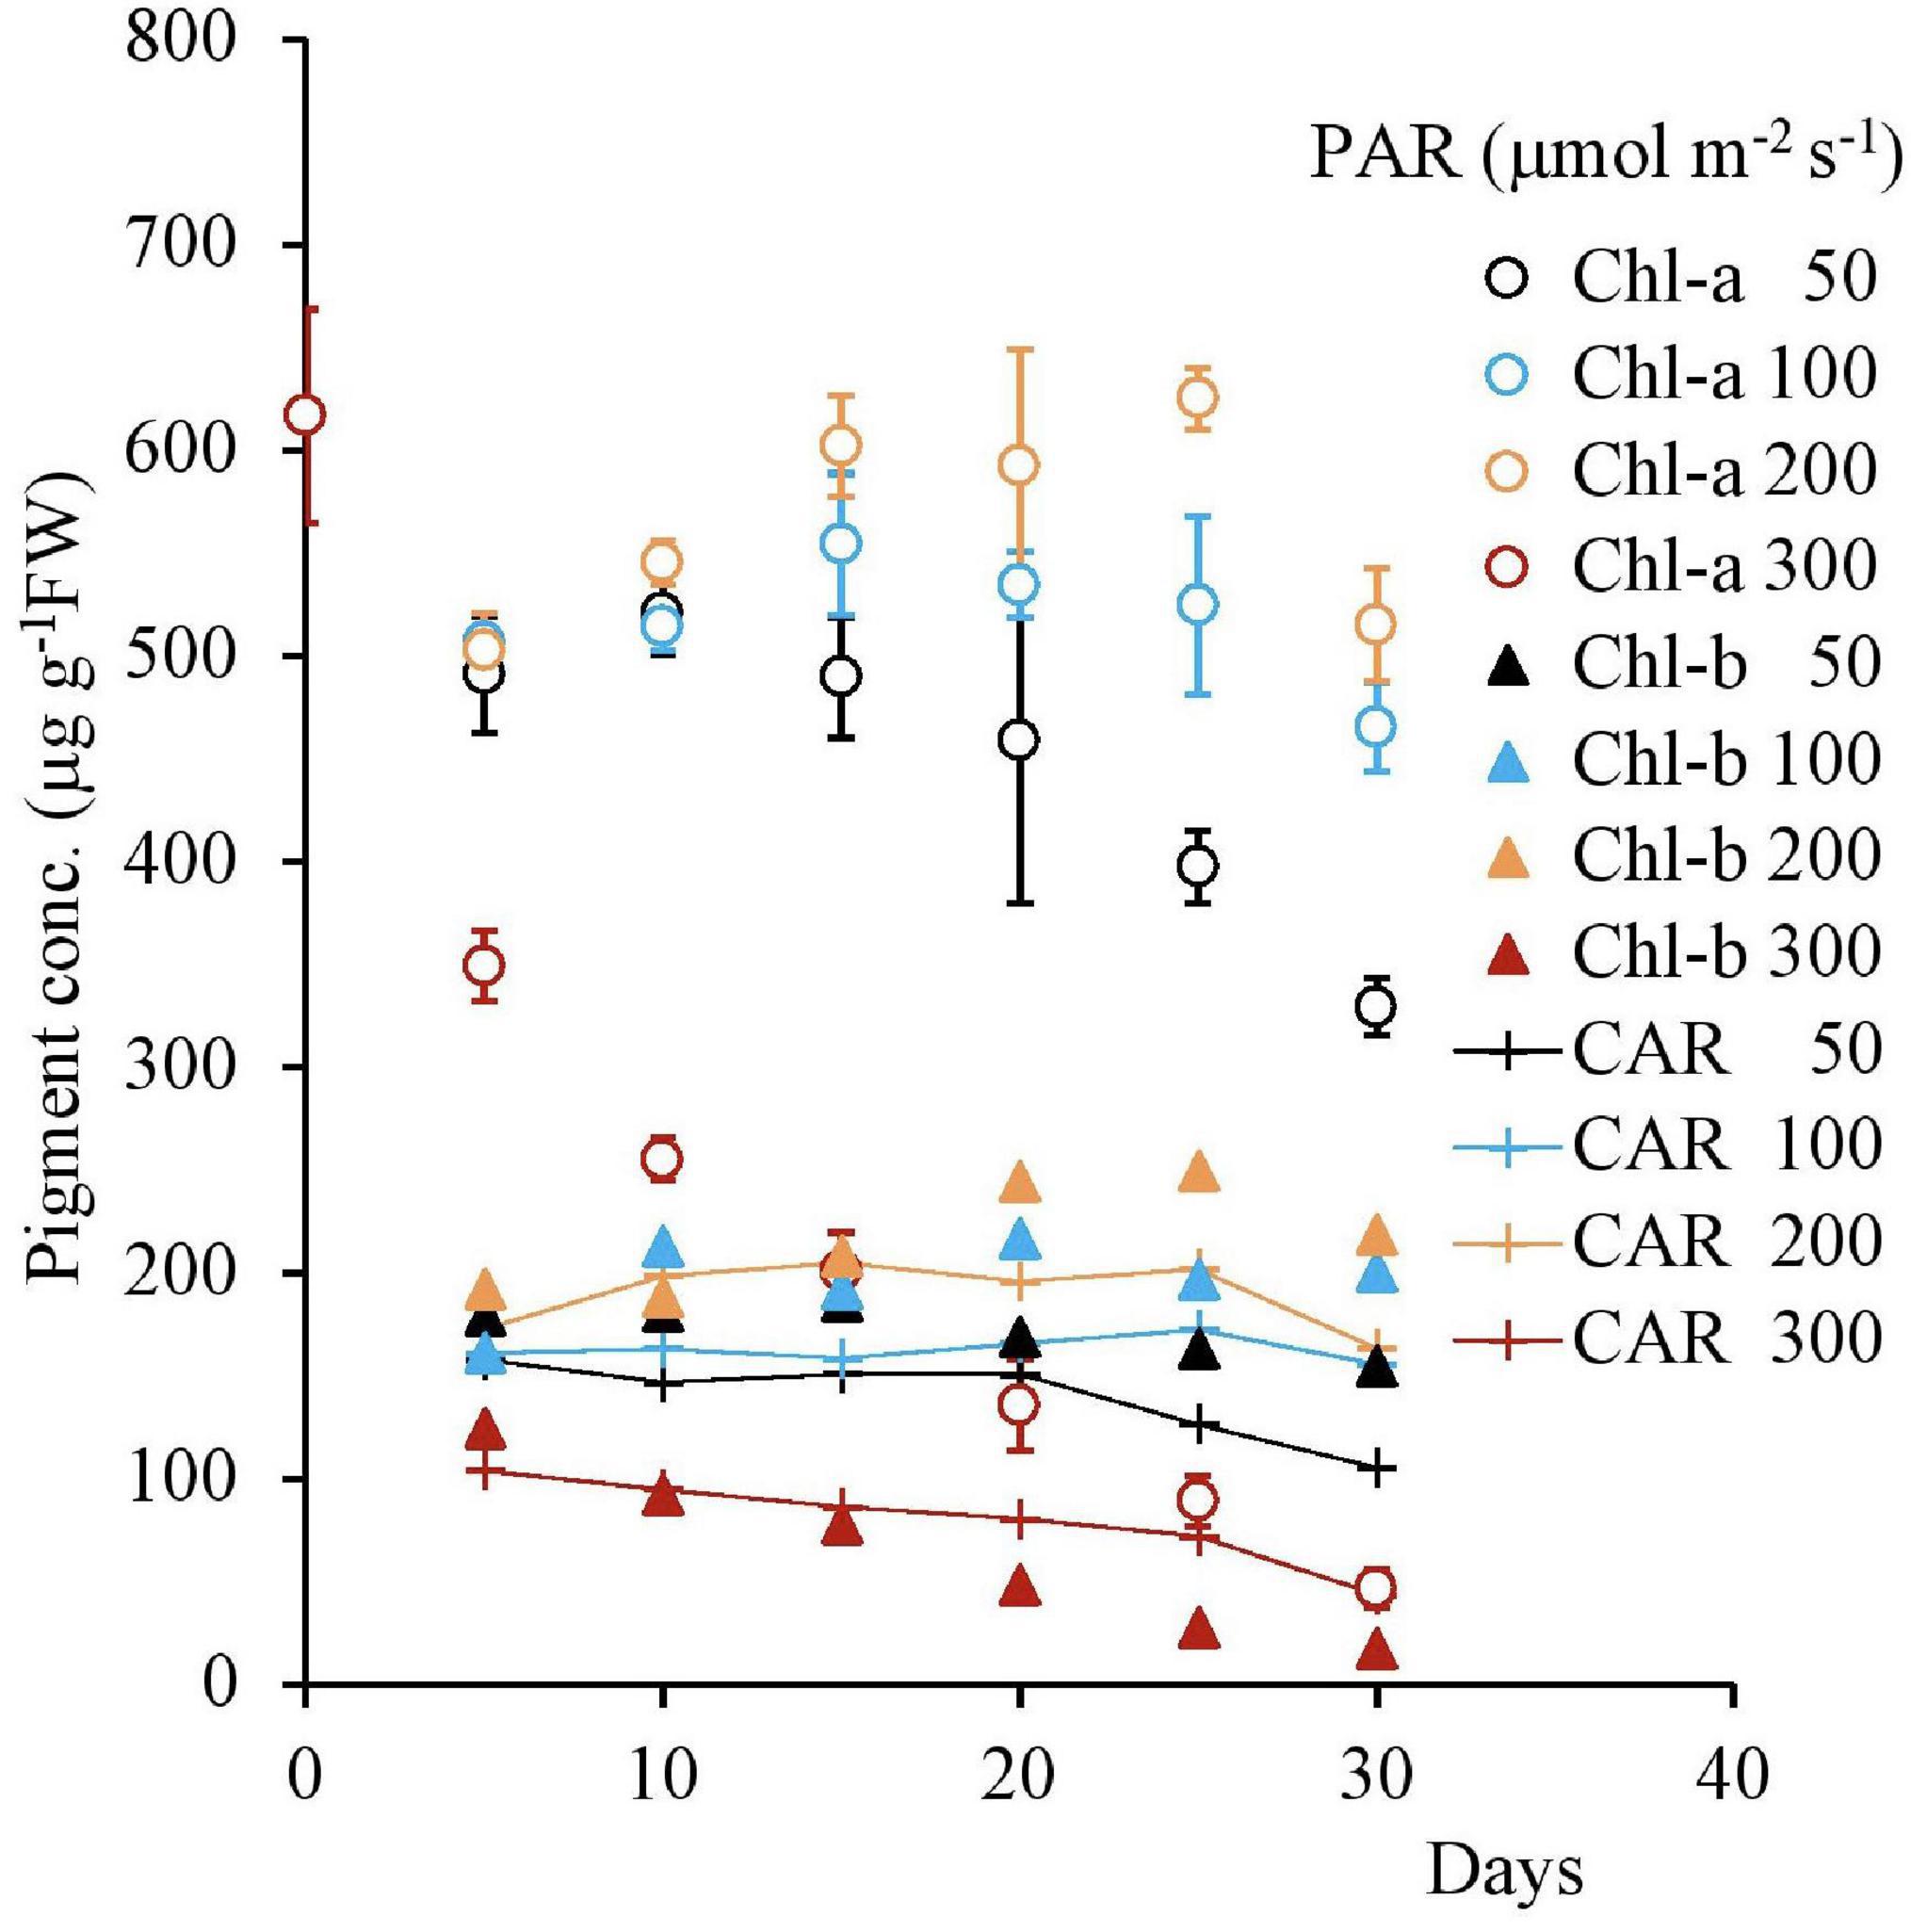
Figure 10. The variational trend of the pigment concentration of plant tissues with respect to various light intensities. Vertical bars indicate the standard deviation.
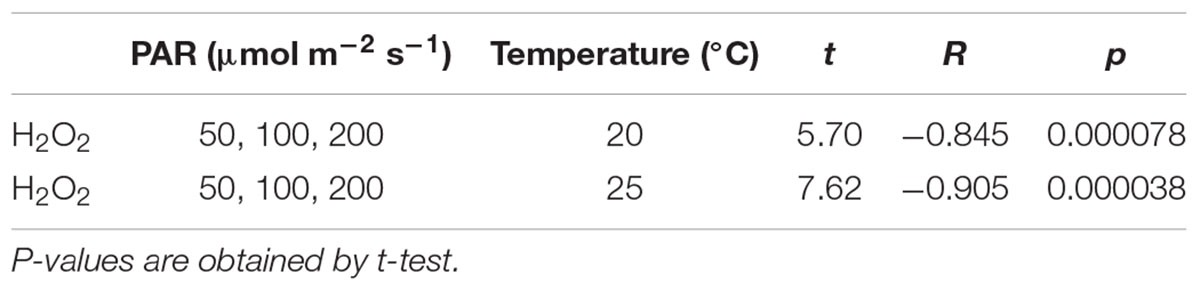
Table 3. Relationship between PAR and H2O2 concentration in 30 days experiment.
In contrast, with 300 μmol m–2s–1, the H2O2 concentration tended to increase after 10 days until reaching 17 μmol g–1FW then, it significantly declined (Table 4).
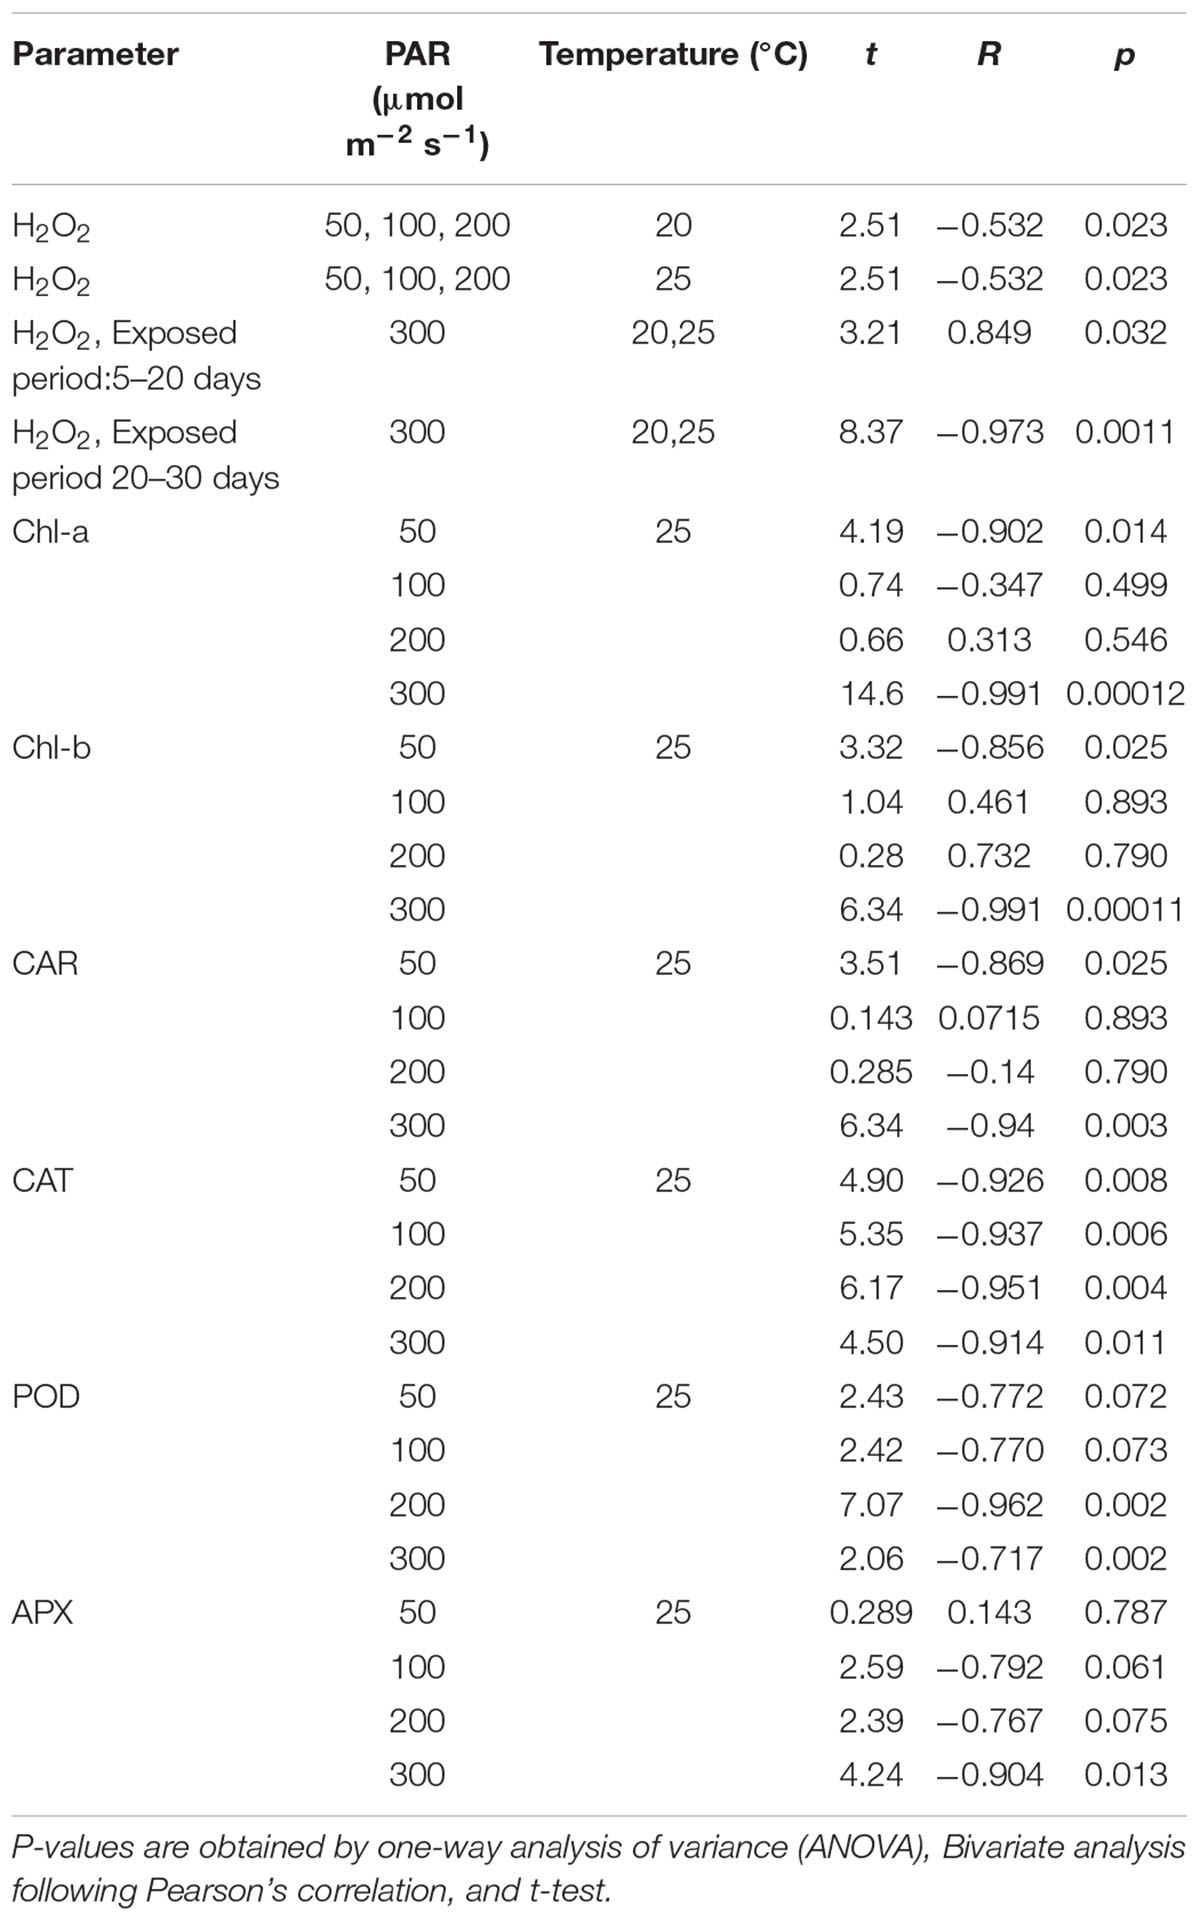
Table 4. Relationship between parameters and the exposed period in 30 days experiment.
The pigment concentration steadily declined after the beginning of the experiment, with 300 μmol m–2s–1 of PAR Shown in Table 4. However, with other PAR intensities, the pigment concentration did not indicate significant change. As the days progressed from 1 to 30, increasing PAR affected the pigment concentration, which in turn, gradually decreased the Chl-a, Chl-b, and CAR levels.
Response to the Diurnal Variation of the Solar Radiation
The diurnal variation is shown in Figure 10. Following the variation of PAR, the H2O2 concentration and Chlorophyll concentrations varied, increasing in the morning and decreasing in the afternoon. The H2O2 concentration varied in a single day at different temperatures. A similar trend is also observed in the Chlorophyll concentrations. However, compared with the symmetrical change in Chlorophyll, the H2O2 concentration was higher in the afternoon, compared with the morning changes (Figure 11 and Table 4).
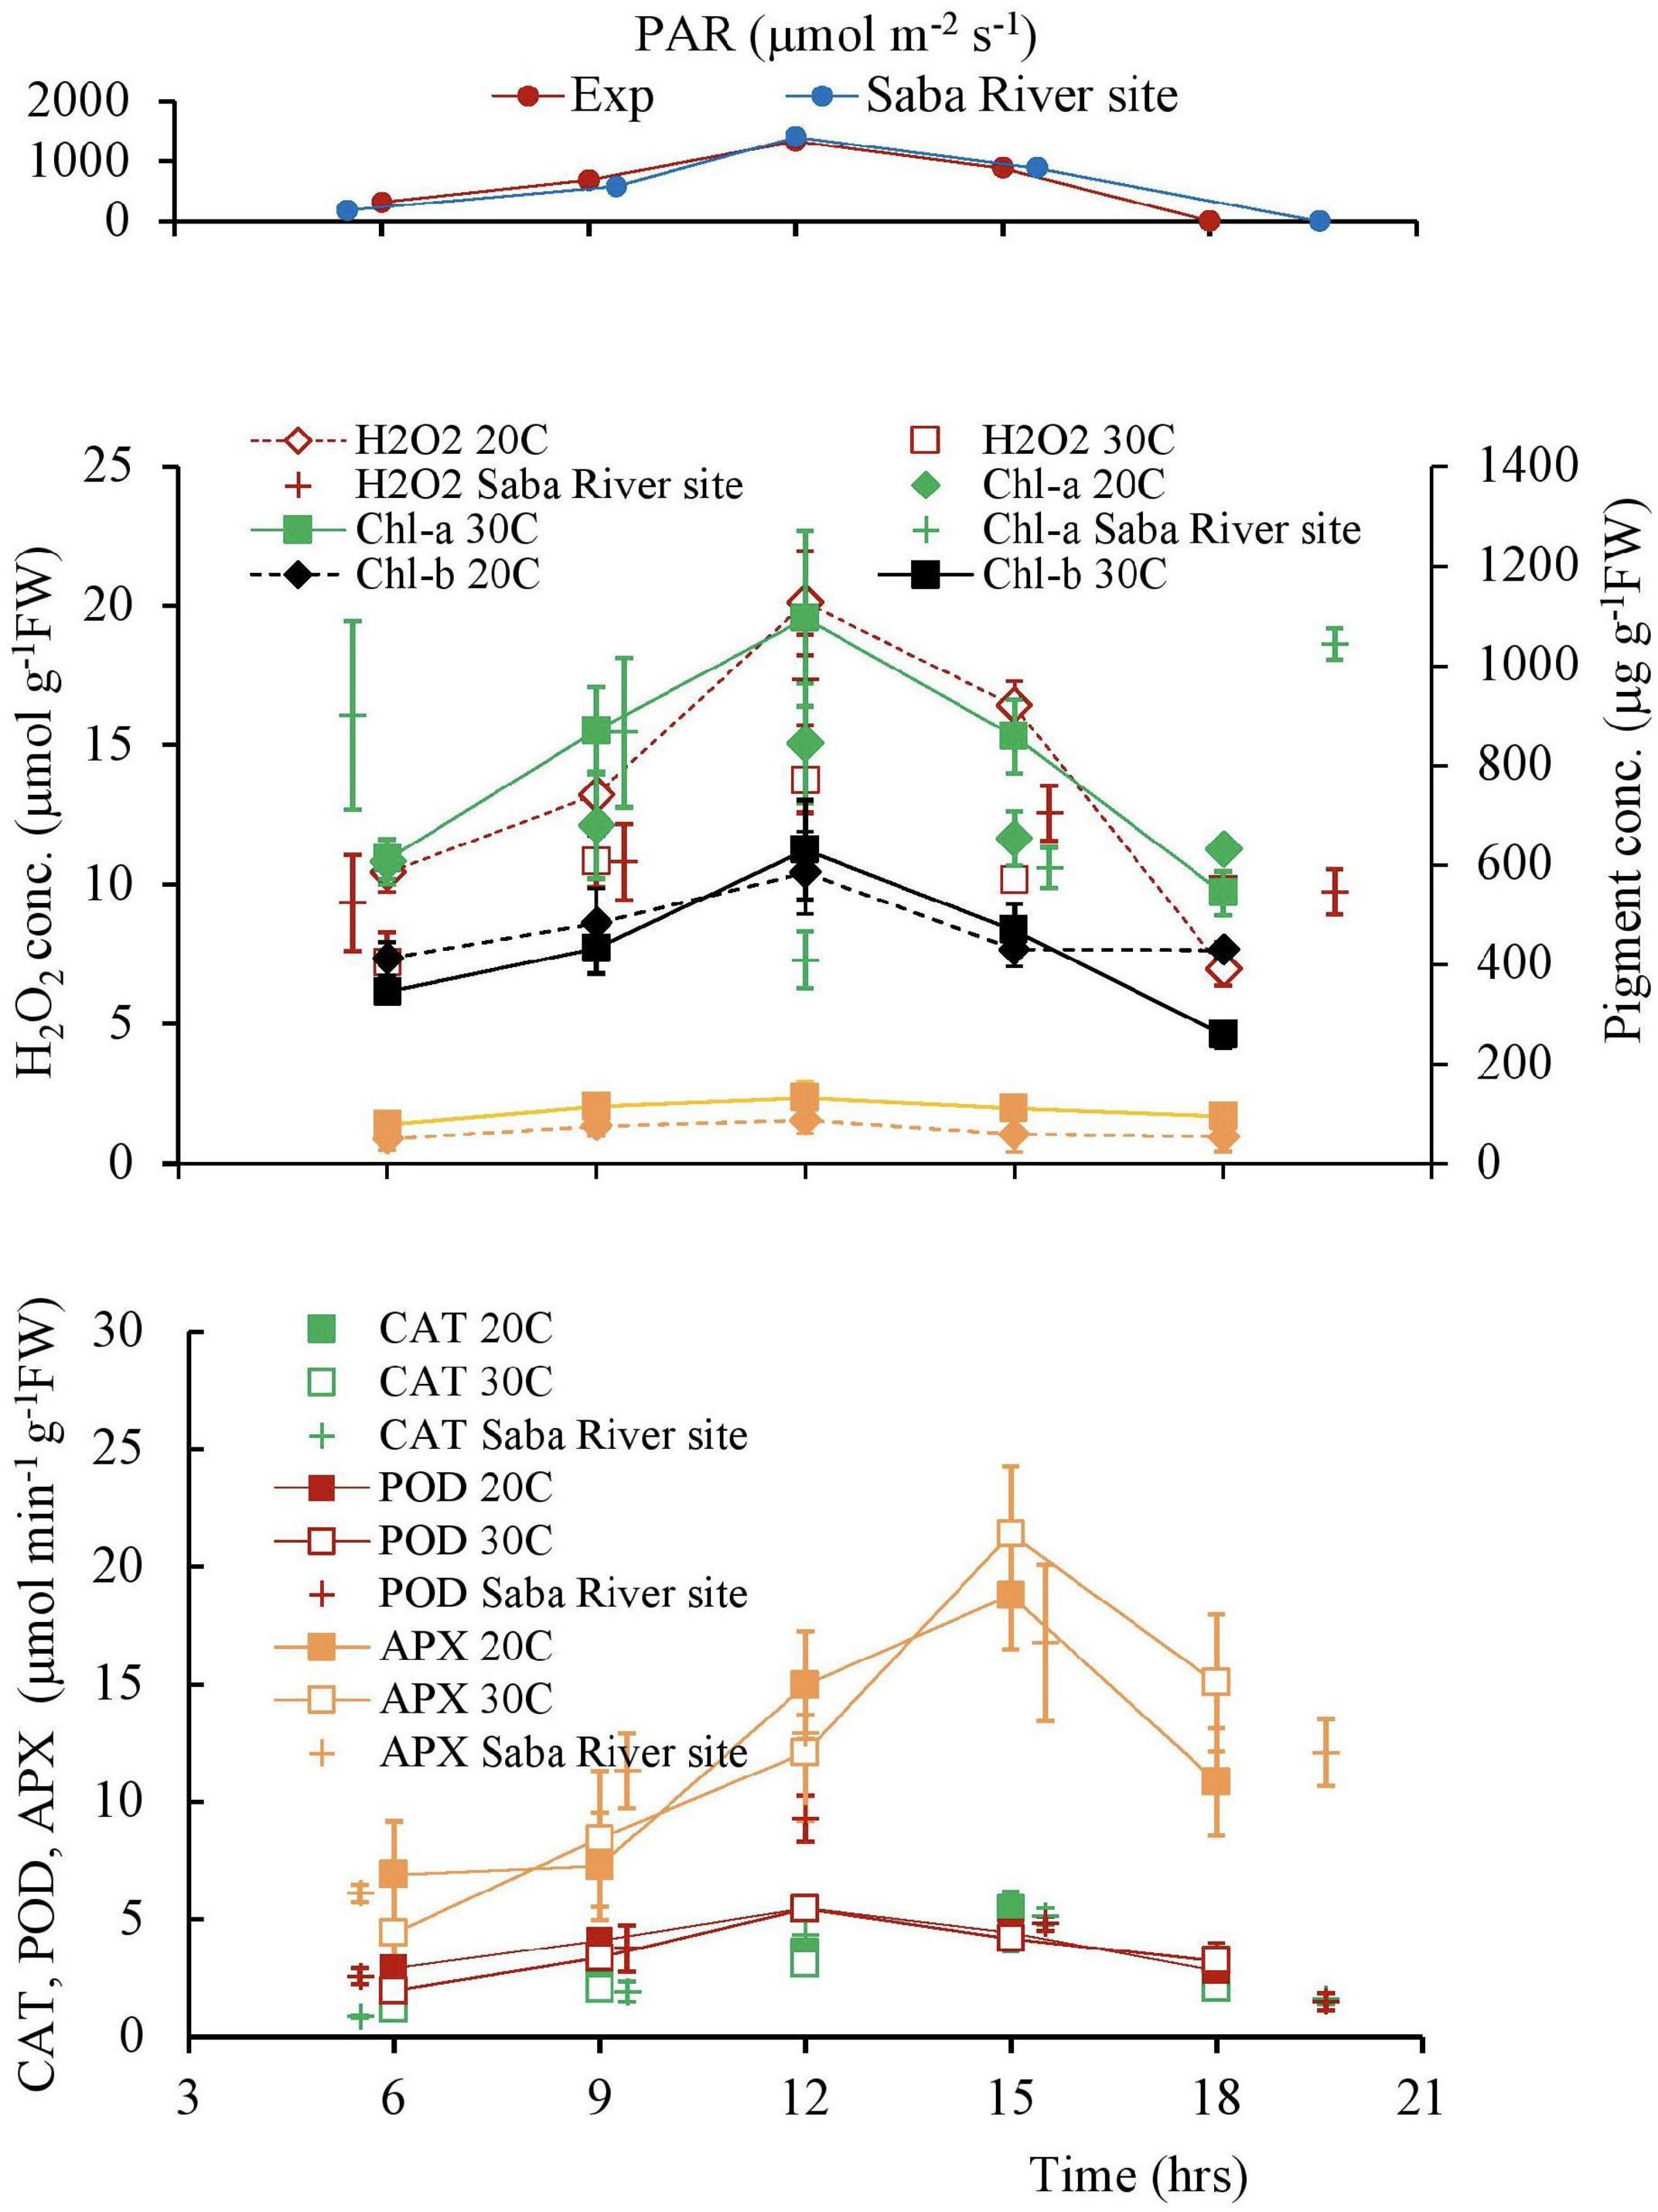
Figure 11. The variation patterns of the solar radiation, H2O2 concentration, and antioxidant activities of plant tissues in a day. Vertical bars indicate the standard deviation.
The activities of CAT and POD are also shown in Figure 11. POD showed high fluctuation day time experiment compared with CAT. Although the POD activity followed the PAR and H2O2 variations, the CAT activity delayed approximately 3 h of the variational patterns of the PAR and H2O2 concentrations because CAT got the optimal concentration of H2O2 to react and give a maximum yield (Scandalios et al., 1997).
Discussion
Apart from the present study, laboratory experiments were previously conducted to obtain the relationship between the H2O2 concentration and various types of stressors (Asaeda et al., 2017; Asaeda and Rashid, 2017; De Silva and Asaeda, 2017a; Parveen et al., 2017). These experiments showed a positive correlation between the H2O2 concentration and stress intensity. The present study clearly indicates that the accumulation and destruction processes of H2O2 and photosynthetic pigments in the tissues are positively or negatively proportionate to the stress intensity. Further, the presence of a combination of factors (Fe and light), which are common stressors, reveals the significant effects of two stressors on aquatic plants.
Effect of Light on Stress Intensity
In the natural environment, an E. densa colony can be formed in lower light intensity, having a low level of H2O2 concentration within a few days. The threshold value for E. densa is 16 μmol g−1FW in the daytime (Asaeda et al., 2020), which is observed in high solar radiation and indicates plant tissue damage due to oxidative stress. It was observed that E. densa prefers a light intensity < 200 μmol m–2 s–1. When the light intensity is over 200 μmol m–2 s–1, plant tissues tend to show signs of H2O2 accumulation. High solar radiation disrupts plant metabolism, creating hypoxic conditions. As a result, E. densa plants deteriorate (Asaeda et al., 2020).
In the laboratory studies, it was confirmed that E. densa has a preferred PAR intensity ranging from 30 to 200 μmol m–2 s–1. This indicates the light tolerance of E. densa and its preferred environmental conditions.
The H2O2 concentration slightly declined and then stabilized when exposed to less than 200 μmol m–2s–1 of PAR intensity. However, with 300 μmol m–2s–1, H2O2 gradually increased to ∼14 μmolg–1FW of H2O2 concentration and then suddenly declined to the lower level. On the other hand, the Chl-a concentration steadily declined with 200 μmol m–2s–1 of PAR after the experiment began, although there was almost no effect with lower light intensity. Therefore, slightly less than 200 μmol m–2s–1 of PAR seems to be the optimal light intensity for this species.
In diurnal changes of solar radiation, H2O2 is higher in the afternoon compared with the morning for the same light intensity. Elevated detoxifying ROS activity is one of the prime strategies plants often possess in response to abiotic stress. Though the POD antioxidant activity nearly follows the variation of H2O2, the CAT and APX activities are delayed nearly 3 h (Tables 5, 6). The delay of scavenging activity seems to allow the high H2O2 in the afternoon.
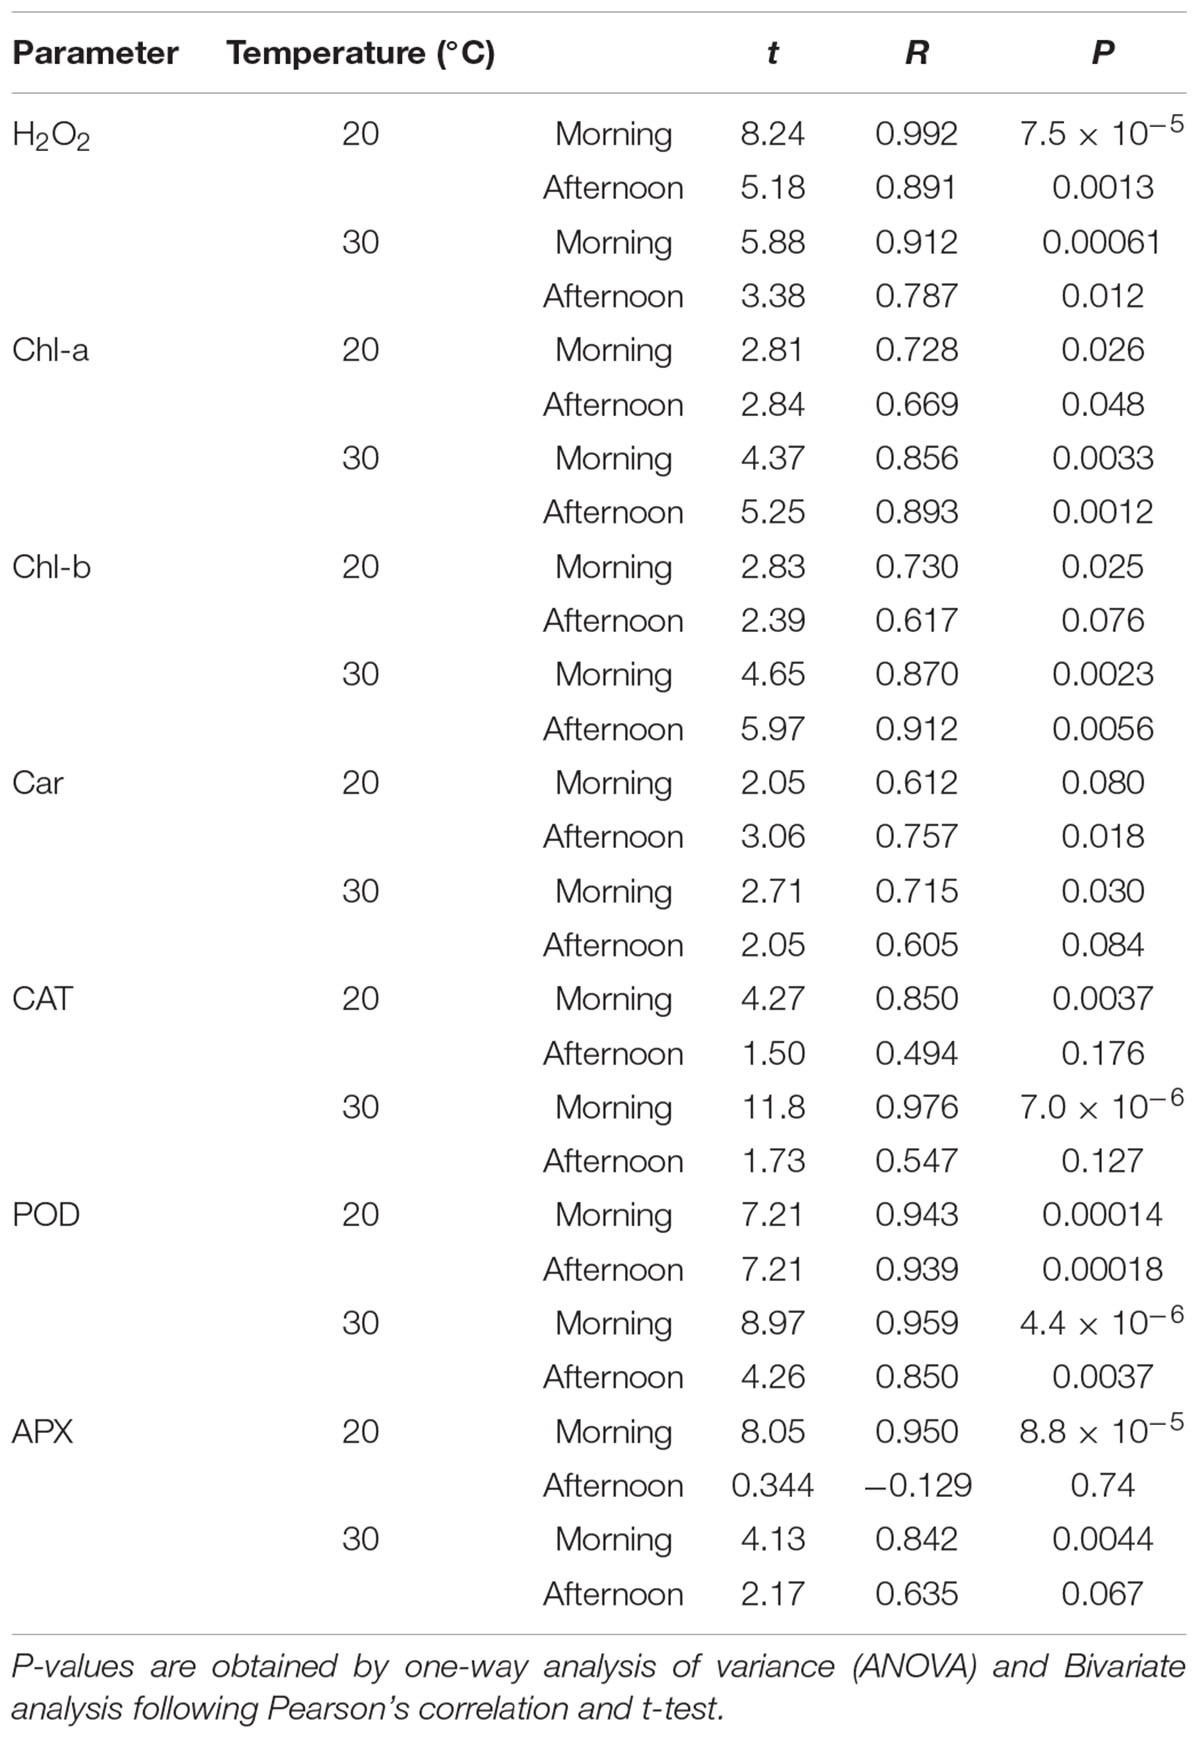
Table 5. The relation of parameters with the diurnal solar radiation.
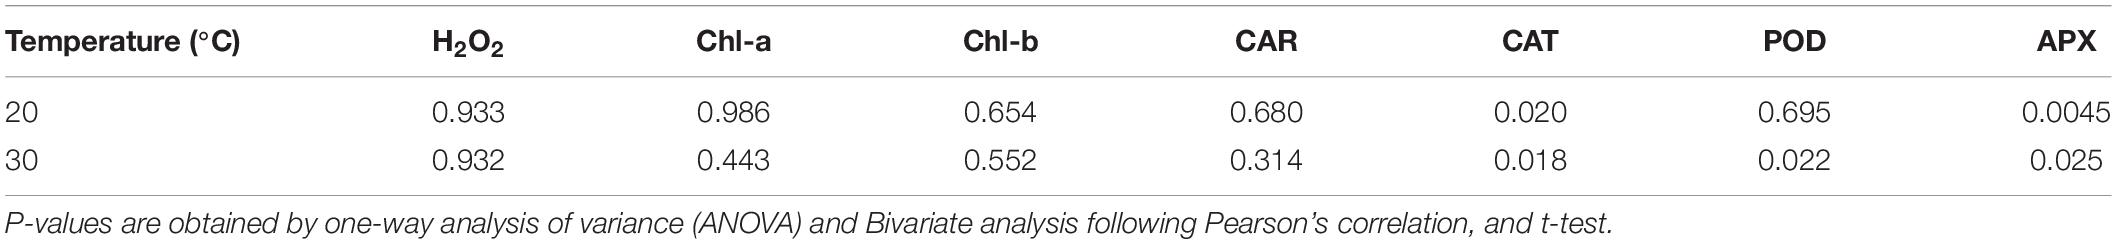
Table 6. p-values for the difference between morning and afternoon.
Effects of Stress Combination: Light and Iron
E. densa also exhibited a highly negative responsive to Fe exposure. Fe is an essential nutrient for plants and is the major metal involved in electron transfer chains, both accepting and donating electrons of photosynthesis and respiration, respectively (Michalak, 2006). However, Fe is toxic when it accumulates to high levels (Michalak, 2006). An excess amount of Fe in a plant leads to an increased formation of ROS (Hell and Stephan, 2003). The antioxidation process, mainly prominent in the tolerant genotype, is achieved by controlling antioxidant enzymes (de Pinto and de Gara, 2004; Halliwell, 2006; Kumar et al., 2014). At higher concentrations, Fe can replace essential metals in pigments and enzymes, disrupting their function; high iron concentrations also reduce the activities of CAT, APX, and other antioxidants (Bielawski and Joy, 1986). In addition to the enzymatic defense, certain amino acids and sulfur metabolites also possess antioxidant properties that reduce ROS damage in Fe-toxic plants, which may reduce the antioxidant enzyme activity (Freeman et al., 2004; Kumar et al., 2014).
In the present study, the Fe toxicity is clearly exhibited. With an increasing Fe concentration in the substrate, the CAT and APX antioxidant levels decreased, which led to an increase in H2O2 accumulation in the plant tissues. On the other hand, the increased POD activity was proportionate to H2O2 accumulation, suggesting the low-Fe independent nature of POD. CAT protects cell walls from the destruction caused by H2O2 production due to iron stress. CAT also plays an important role in the co-degradation of H2O2 in association with POD (Khan et al., 2018; Figure 8). Due to the inhibiting effect of excess ROS production and damage caused by a massive concentration of free Fe ions, significant decreasing results were observed in CAT, POD, and APX (Khan et al., 2018).
The influence of high Fe content on plants is enhanced with increased light intensity. The plants survived a 10 mg L–1 Fe exposure under 30 and 100 μmol m–2 s–1 PAR intensities, but deteriorated under a 200 μmol m–2 s–1 PAR intensity, confirming the strong influence of light intensity on the condition of plants.
There is an enhanced correlation between H2O2 and Fe when controlling the PAR intensity effect, and there are significantly enhanced correlation between H2O2 and PAR when controlling the Fe effect. This suggests that the accumulation of H2O2 is caused by both Fe content and high light intensity, independently of the other stressor, in the present experimental range.
The highest accumulation of H2O2 in the tissues under Fe toxicity and high PAR exposure might exceed the tolerance level—although it is likely species-specific and causes extensive damage to cells (Cheeseman, 2007; Quan et al., 2008; Asaeda et al., 2021).
Many studies have been conducted on the inhibition effect of strong light intensity on photosynthesis (Öquist et al., 1992; Madsen and Sandjensen, 1994; Hanelt, 1998, 1996; Morrissey and Guerinot, 2009). Photoinhibition leads to a decrease in photosynthetic pigments (Chl-a and Chl-b), which is shown in the present results. The presence of H2O2 in plant tissues is negatively correlated with photosynthetic pigments. However, regardless of the stress source, the Chl-a concentration declines under lower stress intensities than with H2O2 in the plant tissues. Increasing H2O2 can lead to Chl-a and Chl-b declines after an 8-hr elevation of Arabidopsis thaliana (Rao et al., 1997). The optimum light-harvesting antenna for plants is a Chl a and b ratio of 5 (Wu et al., 2020). However, there was not clear difference in the ratio in the present experiment.
In the present study, the Fv Fm–1, which explains the photosystem’s efficiency, proportionately decreased with H2O2 accumulation rather than Chl-a concentration.
Reduced photosynthesis efficiency negatively influences the prosperity and vigor of plants. This was reflected in the reduced SGR and IAA concentration, which regulated the shoot elongation (Yang et al., 1993; Zhou et al., 2006).
Possibility of Hydrogen Peroxide Concentration as an Indicator of Environmental Stressors
Chlorophyll fluorescence (Fv Fm–1) indicates the efficiency of the photosynthesis rate at PSII, which is highly related to the environmental stress exerted on the plant body. Thus, it is often used to identify the condition of plants. The H2O2 concentration had a striking negative correlation with the Fv Fm–1, regardless of stressor type, in the present study. The exception is the presence of a very high Fe (∼10 mg L–1) concentration and high PAR intensity (∼200 μmol m–2 s–1), under which plants nearly died. There is a similar relationship between H2O2 and temperature rise in both laboratory and field experiments (Asaeda et al., 2020) in terms of different temperatures and light intensities (Riis et al., 2012). H2O2 values were slightly higher (∼10 μmol g–1FW) with the experiments compared with the field samples, likely because the plants were exposed to radiation only at the tissue’s upper side in the field. Therefore, the difference is considered the result of a possible fluctuation in the field measurements.
The Chl-a and Chl-b concentrations also had a clear unique negative correlation with the H2O2 concentration in the plant tissue, regardless of stressor types. The type of growth rate parameter, shown by the extension rate, also indicates these unique negative trends. The oxidative stress intensity is based on the activities of H2O2, as well as other ROS, such as singlet oxygen and hydroxyl radicals, although superoxide is closely related to H2O2.
However, H2O2 is the major ROS generated in various organelles; thus, its concentration predominantly implies the level of environmental stress on the plants (Mittler, 2002; Miller and Mittler, 2006; Sharma et al., 2012; Czarnocka and Karpiński, 2018). The present study’s results indicate that H2O2 concentration has negative but unique correlations with plant growth, photosynthetic pigment content, IAA concentration, and Fv Fm–1, regardless of the stressor type. Yet, the H2O2 response was slightly delayed compared with the photosynthetic pigment concentration.
Plants have opposite trends in their responses to some types of stressors, such as drought and salinity, drought and heat, and drought and high light (Rizhsky et al., 2002; Giraud et al., 2008; Ahmed et al., 2013; Suzuki et al., 2014; Choudhury et al., 2017). However, as for positively interacting stressors, the H2O2 concentration has the potential to be a good indicator of overall plant condition, at least at a practical management level (Asaeda et al., 2018).
Photoinhibition of Egeria densa in Natural Conditions
The H2O2 concentration substantially increased in the natural river samples when exposed to high light intensities (Asaeda et al., 2020). Excessive light intensity overloaded electrons generated at PSII. These electrons are transported to PSI, where super oxides are produced from oxygen and then undergo dismutation to H2O2. They are toxic and damage the PSII protein D1, which otherwise repairs PSII (Leitsch et al., 1994). In this process, photoinhibition is activated more readily under higher light intensities and damages the plant. In the case of submerged plants, normal subjected light intensity is not high; it is several hundred μmol m–2s–1 PAR at most, which is low compared with that of terrestrial or emergent species (Asaeda and Barnuevo, 2019). At the present study’s sites, the light intensity was approximately 100–200 μmol m–2s–1 PAR at 0.5 m deep. E. densa grew mostly at 0.5–1.0 m deep, and plants grew at depressed sites on the river bottom. Canopy top shoots located less than 10 cm deep were often dying, although the deep shoots were healthy. These results indicate that this species seems to prefer the relatively low light intensity of 100–200 μmol m–2s–1 PAR to higher light intensities. Thus, exposure to high light intensity could be an efficient method of reducing the community.
Conclusion
For the management of aquatic plants, growth monitoring after the administration of treatments is usually used; however, this takes a long time to obtain the results. The present study indicates that H2O2, the most abundant ROS, increases in concentration with the combined stress of high light intensity and Fe concentration, almost independently. Light and Fe stressors originally affect different organelles, but both present similar symptoms of oxidative stress, through H2O2 generation. With low levels of PAR or Fe, Chl-a and Chl-b negatively correlated with the H2O2 concentration, while, when exposed to higher levels of stress, the chlorophyll content along with H2O2 significantly declined.
Increased Fe concentration destroys the activity of CAT and APX, indicating plant tissue damage. Except for 200 μmol m–2s–1 of PAR, SGR, and IAA also have a negative relationship with Fe concentration. Therefore, with the present results and the previous findings, we suggest that the H2O2 concentration could be a suitable marker of environmental stress intensity, at least at a practical management level. It also has the potential for monitoring combined stressors if they have positive interaction trends, although more studies are required.
Data Availability Statement
The raw data supporting the conclusions of this article will be made available by the authors, without undue reservation.
Author Contributions
TA contributed the conceptualization, filed works, and wrote the manuscript together with other members. MR edited throughout the manuscript. XL made experiments and analysis the manuscript. JS reviewed and commented the manuscript. All authors contributed to the article and approved the submitted version.
Funding
This work was financially supported by the Grant-in-Aid for Scientific Research (B) (19H02245) and the Fund for the Promotion of Joint International Research (18KK0116) of Japan Society for the Promotion of Science (JSPS).
Conflict of Interest
TA was employed by the company Hydro Technology Institute Co, Ltd.
The remaining authors declare that the research was conducted in the absence of any commercial or financial relationships that could be construed as a potential conflict of interest.
Publisher’s Note
All claims expressed in this article are solely those of the authors and do not necessarily represent those of their affiliated organizations, or those of the publisher, the editors and the reviewers. Any product that may be evaluated in this article, or claim that may be made by its manufacturer, is not guaranteed or endorsed by the publisher.
References
Aebi, H. (1984). Catalase in vitro. Method. Enzymol. 105, 121–126. doi: 10.1016/s0076-6879(84)05016-3
Ahmed, I. M., Dai, H., Zheng, W., Cao, F., Zhang, G., Sun, D., et al. (2013). Genotypic differences in physiological characteristics in the tolerance to drought and salinity combined stress between Tibetan wild and cultivated barley. Plant Physiol. Biochem. 63, 49–60. doi: 10.1016/j.plaphy.2012.11.004
Asada, K. (1999). The water-water cycle in chloroplasts: scavenging of active oxygens and dissipation of excess photons. Annu. Rev. Plant Biol. 50, 601–639. doi: 10.1146/annurev.arplant.50.1.601
Asaeda, T., and Barnuevo, A. (2019). Oxidative stress as an indicator of niche-width preference of mangrove Rhizophora stylosa. Forest Ecol. Manage. 432, 73–82. doi: 10.1016/j.foreco.2018.09.015
Asaeda, T., and Rashid, M. H. (2017). Effects of turbulence motion on the growth and physiology of aquatic plants. Limnologica 62, 181–187. doi: 10.1016/j.limno.2016.02.006
Asaeda, T., Rashid, M. H., and Schoelynck, J. (2021). Tissue hydrogen peroxide concentration can explain the invasiveness of aquatic macrophytes: a modeling perspective. Front. Environ. Sci. 8:516301. doi: 10.3389/fenvs.2020.516301
Asaeda, T., Sanjaya, K., and Kaneko, Y. (2017). Effects of mechanical stressors caused by mean flow and turbulence on aquatic plants with different morphologies. Ecohydrology 10:e1873. doi: 10.1002/eco.1873
Asaeda, T., Senavirathna, M. D. H. J., and Vamsi-Krishna, L. (2020). Evaluation of habitat preferance of invasive macrophyte Egeria densa in different channel slopes using hydrogen peroxide as an indicator. Front. Plant Sci. 11:422. doi: 10.3389/fpls.2020.00422
Asaeda, T., Senavirathna, M. D. H. J., Xia, L., and Barnuevo, A. (2018). Application of hydrogen peroxide as an environmental stress indicator for vegetation management. Engineering 4, 610–616. doi: 10.1016/j.eng.2018.09.001
Bakker, E. S., Van Donk, E., and Immers, A. K. (2016). Lake restoration by in-lake iron addition: a synopsis of iron impact on aquatic organisms and shallow lake ecosystems. Aquat. Ecol. 50, 121–135. doi: 10.1007/s10452-015-9552-1
Becana, M., Moran, J. F., and Iturbe-Ormaetxe, I. (1998). Iron-dependent oxygen free radical generation in plants subjected to environmental stress: toxicity and antioxidant protection. Plant Soil 201, 137–147. doi: 10.1023/A:1004375732137
Bielawski, W., and Joy, K. W. (1986). Reduced and oxidised glutathione and glutathione-reductase activity in tissues of Pisum sativum. Planta 169, 267–272. doi: 10.1007/BF00392324
Caverzan, A., Passaia, G., Rosa, S. B., Ribeiro, C. W., Lazzarotto, F., and Margis-Pinheiro, M. (2012). Plant responses to stresses: role of ascorbate peroxidase in the antioxidant protection. Genet. Mol. Biol. 35. 4, 1011–1019. doi: 10.1590/S1415-47572012000600016
Cheeseman, J. M. (2006). Hydrogen peroxide concentrations in leaves under natural conditions. J. Exp. Bot. 57, 2435–2444. doi: 10.1093/jxb/erl004
Cheeseman, J. M. (2007). Hydrogen peroxide and plant stress: a challenging relationship. Plant Stress 1, 4–15.
Choudhury, F. K., Rivero, R. M., Blumwald, E., and Mittler, R. (2017). Reactive oxygen species, abiotic stress and stress combination. Plant J. 90, 856–867. doi: 10.1111/tpj.13299
Connolly, E. L., and Guerinot, M. (2002). Iron stress in plants. Genome Biol. 3, 1–4. doi: 10.1186/gb-2002-3-8-reviews1024
Czarnocka, W., and Karpiński, S. (2018). Friend or foe? reactive oxygen species production, scavenging and signaling in plant response to environmental stresses. Free Radic. Biol. Med. 122, 4–20. doi: 10.1016/j.freeradbiomed.2018.01.011
de Pinto, M. C., and de Gara, L. (2004). Changes in the ascorbate metabolism of apoplastic and symplastic spaces are associated with cell differentiation. J. Exp. Bot. 55, 2559–2569. doi: 10.1093/jxb/erh253
De Silva, H., and Asaeda, T. (2017a). Effects of heat stress on growth, photosynthetic pigments, oxidative damage and competitive capacity of three submerged macrophytes. J. Plant Interact. 12, 228–236. doi: 10.1080/17429145.2017.1322153
De Silva, H., and Asaeda, T. (2017b). Stress response and tolerance of the submerged macrophyte Elodea nuttallii (Planch) St. John to heat stress: a comparative study of shock heat stress and gradual heat stress. Plant Biosyst. 153, 787–794. doi: 10.1080/11263504.2017.1338628
Einset, J., Winge, P., and Bones, A. (2007). ROS signaling pathways in chilling stress. Plant Signal. Behav. 2, 365–367. doi: 10.4161/psb.2.5.4461
Ellawala, C., Asaeda, T., and Kawamura, K. (2011). Influence of flow turbulence on growth and indole acetic acid and H2O2 metabolism of three aquatic macrophyte species. Aquat. Ecol. 45, 417–426. doi: 10.1007/s10452-011-9364-x
Freeman, J. L., Persans, M. W., Nieman, K., Albrecht, C., Peer, W., Pickering, I. J., et al. (2004). Increased glutathione biosynthesis plays a role in nickel tolerance in thlaspi nickel hyperaccumulators. Plant Cell 16, 2176–2191. doi: 10.1105/tpc.104.023036
Gapper, C., and Dolan, L. (2006). Control of plant development by reactive oxygen species. Plant Physiol. 141, 341–345. doi: 10.1104/pp.106.079079
Gill, S. S., and Tuteja, N. (2010). Reactive oxygen species and antioxidant machinery in abiotic stress tolerance in crop plants. Plant Physiol. Biochem. 48, 909–930. doi: 10.1016/j.plaphy.2010.08.016
Giraud, E., Ho, L. H. M., Clifton, R., Carroll, A., Estavillo, G., Tan, Y.-F., et al. (2008). The absence of ALTERNATIVE OXIDASE1a in Arabidopsis results in acute sensitivity to combined light and drought stress. Plant Physiol. 147, 595–610. doi: 10.1104/pp.107.115121
Goel, A., Goel, A. K., and Sheoran, I. S. (2003). Changes in oxidative stress enzymes during artificial ageing in cotton (Gossypium hirsutum L.) seeds. J. Plant Physiol. 160, 1093–1100. doi: 10.1078/0176-1617-00881
Gordon, S. A., and Weber, R. P. (1951). Colorimetric estimation of inodoleacetic acid. Plant Physiol. 26, 192–195. doi: 10.1104/pp.26.1.192
Graf, E., Mahoneys, J. R., Bryant, R. G., and Eaton, J. W. (1984). Iron-catalyzed hydroxyl radical formation. J. Biol. Chem. 259, 3620–3624. doi: 10.1016/s0021-9258(17)43139-5
Halliwell, B. (2006). Reactive species and antioxidants. Redox biology is a fundamental theme of aerobic life. Plant Physiol. 141, 312–322. doi: 10.1104/pp.106.077073
Hanelt, D. (1996). Photoinhibition of photosynthesis in marine macroalgae. Sci. Mar. Suppl. 1, 243–248. doi: 10.3354/meps082199
Hanelt, D. (1998). Capability of dynamic photoinhibition in arctic macroalgae is related to their depth distribution. Mar. Biol. 131, 361–369. doi: 10.1007/s002270050329
Hell, R., and Stephan, U. W. (2003). Iron uptake, trafficking and homeostasis in plants. Planta 216, 541–551. doi: 10.1007/s00425-002-0920-4
Hubbart, S., Ajigboye, O. O., Horton, P., and Murchie, E. H. (2012). The photoprotective protein PsbS exerts control over CO(2) assimilation rate in fluctuating light in rice. Plant J. 71, 402–412. doi: 10.1111/j.1365-313X.2012.04995.x
Imamoto, H., Matsumoto, J., Furusato, E., and Washitani, I. (2008). Light and water temperature parameters of 6 species of submerged macrophytes in Lake Biwa. Ecol. Civ. Eng. 11, 1–12. doi: 10.3825/ece.11.1
Khalid, M. F., Hussain, S., Anjum, M. A., Ahmad, S., Ali, M. A., Ejaz, S., et al. (2020). Better salinity tolerance in tetraploid vs diploid volkamer lemon seedlings is associated with robust antioxidant and osmotic adjustment mechanisms. J. Plant Physiol. 244:153071. doi: 10.1016/j.jplph.2019.153071
Khalid, M. F., Vincent, C., Morillon, R., Anjum, M. A., Ahmad, S., and Hussain, S. (2021). Different strategies lead to a common outcome: different water-deficit scenarios highlight physiological and biochemical strategies of water-deficit tolerance in diploid versus tetraploid Volkamer lemon. Tree Physiol. 41, 2359–2374. doi: 10.1093/treephys/tpab074
Khan, S., Lv, J., Iqbal, A., and Fu, P. (2018). Morphophysiological and transcriptome analysis reveals a multiline defense system enabling cyanobacterium Leptolyngbya strain JSC-1 to withstand iron induced oxidative stress. Chemosphere 20, 93–200. doi: 10.1016/j.chemosphere.2018.02.100
Kovalchuk, I. (2010). “Multiple roles of radicals in plants,” in Reactive Oxygen Species and Antioxidants in Higher Plants, ed Dutta Gupta, S. (New York, NY: Science Publishers).
Kumar, A., Dwivedi, S., Singh, R. P., Chakrabarty, D., Mallick, S., Trivedi, P. K., et al. (2014). Evaluation of amino acid profile in contrasting arsenic accumulating rice genotypes under arsenic stress. Biol. Plant. 58, 733–742. doi: 10.1007/s10535-014-0435-4
Kuźniak, E., and Urbanek, H. (2000). The involvement of hydrogen peroxide in plant responses to stresses. Acta Physiol. Plant 22, 195–123. doi: 10.1007/s11738-000-0076-4
Leitsch, J., Schnettger, B., Critchley, C., and Krause, G. H. (1994). Two mechanisms of recovery from photoinhibition in vivo: reactivation of photosystem II related and unrelated to D1-protein turnover. Planta 194, 15–21. doi: 10.1007/BF00201029
Liu, L., Guan, Y.-T., Qin, T.-J., Wang, Y.-Y., Li, H.-L., and Zhi, Y.-B. (2018). Effects of water regime on the growth of the submerged macrophyte Ceratophyllum demersum at different densities. J. Freshw. Ecol. 33, 45–56. doi: 10.1080/02705060.2017.1422043
Madsen, T. V., and Sandjensen, K. (1994). The interactive effects of light and inorganic carbon on aquatic plant-growth. Plant Cell Environ. 17, 955–962. doi: 10.1111/j.1365-3040.1994.tb00324.x
Michalak, A. (2006). Phenolic compounds and their antioxidant activity in plants growing under heavy metal stress. Pol. J. Environ. Stud. 15, 523–530. doi: 10.1016/j.fitote.2011.01.018
Miller, G., and Mittler, R. (2006). Could heat shock transcription factors function as hydrogen peroxide sensors in plants? Ann. Bot. 98, 279–288. doi: 10.1093/aob/mcl107
Mittler, R. (2002). Oxidative stress, antioxidants and stress tolerance. Trends Plant Sci. 7, 405–410. doi: 10.1016/S1360-1385(02)02312-9
Morrissey, J., and Guerinot, M. L. (2009). Iron uptake and transport in plants: the good, the bad, and the ionome. Chem. Rev. 109, 4553–4567. doi: 10.1021/cr900112r
Nakano, Y., and Asada, K. (1981). Hydrogen peroxide is scavenged by ascorbate-specific peroxidase in spinach chloroplasts. Plant Cell Physiol. 22, 867–880. doi: 10.1093/oxfordjournals.pcp.a076232
Niu, L., and Liao, W. (2016). Hydrogen peroxide signaling in plant development and abiotic responses: crosstalk with nitric oxide and calcium. Front. Plant Sci. 7:230. doi: 10.3389/fpls.2016.00230
Öquist, G., Anderson, J. M., McCaffery, S., and Chow, W. S. (1992). Mechanistic differences in photoinhibition of sun and shade plants. Planta 188, 422–431. doi: 10.1007/BF00192810
Parveen, M., Asaeda, T., and Rashid, M. H. (2017). Biochemical adaptations of four submerged macrophytes under combined exposure to hypoxia and hydrogen sulphide. PLoS One 12:e0182691. doi: 10.1371/journal.pone.0182691
Parveen, M., Miyagib, A., Yamadab, M. K., Rashid, M. H., and Asaeda, T. (2019). Metabolic and biochemical responses of Potamogeton anguillanus Koidz (Potamogetonaceae) to low oxygen conditions. J. Plant Physiol. 232, 171–179. doi: 10.1016/j.jplph.2018.11.023
Pinto, E., Sigaud-Kutner, T. C. S., Leitão, M. A. S., Okamoto, O. K., Morse, D., and Colepicolo, P. (2003). Heavy metal-induced oxidative stress in algae. J. Phycol. 39, 1008–1018. doi: 10.1111/j.0022-3646.2003.02-193.x
Porra, R. J., Thompson, W. A., and Kriedemann, P. E. (1989). Determination of accurate extinction coefficients and simultaneous equations for assaying chlorophylls a and b extracted with four different solvents: verification of the concentration of chlorophyll standards by atomic absorption spectroscopy. Biochim. Biophys. Acta. Bioenerg. 975, 384–394. doi: 10.1016/S0005-2728(89)80347-0
Pospíšil, P. (2016). Production of reactive oxygen species by photosystem II as a response to light and temperature stress. Front. Plant Sci. 7:1950. doi: 10.3389/fpls.2016.01950
Prasad, A., Kumar, A., Suzuki, M., Kikuchi, H., Sugai, T., Kobayashi, M., et al. (2015). Detection of hydrogen peroxide in photosystem II (PSII) using catalytic amperometric biosensor. Front. Plant Sci. 6:862. doi: 10.3389/fpls.2015.00862
Prasad, T. K., Anderson, M. D., Martin, B. A., and Stewart, C. R. (1994). Evidence for chilling-induced oxidative stress in maize seedlings and a regulatory role for hydrogen peroxide. Plant Cell 6, 65–74. doi: 10.1105/tpc.6.1.65
Quan, L. J., Zhang, B., Shi, W. W., and Li, H. Y. (2008). Hydrogen peroxide in plants: a versatile molecule of the reactive oxygen species network. J. Integr. Plant Biol. 50, 2–18. doi: 10.1111/j.1744-7909.2007.00599.x
Queval, G., Hager, J., Gakiere, B., and Noctor, G. (2008). Why are litreature data for H2O2 contents so variable? a discussion of potential difficulties in the quantitative assay for leaf extracts. J. Exp. Biol. 59, 135–146. doi: 10.1093/jxb/erm193
Rabotti, G., De Nisi, P., and Zocchi, G. (1995). Metabolic implications in the biochemical responses to iron deficiency in cucumber (Cucumis sativus L.) roots. Plant Physiol. 107, 1195–1199. doi: 10.1104/pp.107.4.1195
Rae, R., Hanelt, D., and Hawes, I. (2001). Sensitivity of freshwater macrophytes to UV radiation: relationship to depth zonation in an oligotrophic New Zealand lake. Mar. Freshw. Res. 52, 1023–1032. doi: 10.1071/MF01016
Rao, M. V., Paliyath, G., Ormrod, D. P., Murr, D. P., and Watkins, C. B. (1997). Influence of salicylic acid on H2O2 production, oxidative stress, and H2O2-metabolizing enzymes (salicylic acid-mediated oxidative damage requires H2O2). Plant Physiol. 115, 137–149. doi: 10.1104/pp.115.1.137
Riis, T., Olesen, B., Clayton, J. S., Lambertini, C., Brix, H., and Sorrell, B. K. (2012). Growth and morphology in relation to temperature and light availability during the establishment of three invasive aquatic plant species. Aquat. Bot. 102, 56–64. doi: 10.1016/j.aquabot.2012.05.002
Rizhsky, L., Liang, H., and Mittler, R. (2002). The combined effect of drought stress and heat shock on gene expression in tobacco. Plant Physiol. 130, 1143–1151. doi: 10.1104/pp.006858
Salleh, F. M., Mariotti, L., Spadafora, N. D., Price, A. M., Picciarelli, P., Wagstaff, C., et al. (2016). Interaction of plant growth regulators and reactive oxygen species to regulate petal senescence in wallflowers (Erysimum linifolium). BMC Plant Biol. 16:77. doi: 10.1186/s12870-016-0766-8
Satterfield, C. N., and Bonnell, A. H. (1955). Interferences in the titanium sulfate method for hydrogen peroxide. Anal. Chem. 27, 1174–1175. doi: 10.1021/ac60103a042
Scandalios, J. G., Guan, L., and Alexios, N. (1997). Polidoros catalases in plants: gene structure, properties, regulation, and expression. oxidative stress and the molecular biology of antioxidant defenses. Cold Spring Harbor Monograph Series 34, 343–406.
Sharma, P., Jha, A. B., Dubey, R. S., and Pessarakli, M. (2012). Reactive oxygen species, oxidative damage, and antioxidative defense mechanism in plants under stressful conditions. J. Bot. 2012:217037. doi: 10.1155/2012/217037
Shetty, N. P., Jørgensen, H. J. L., Jensen, J. D., Collinge, D. B., and Shetty, H. S. (2008). Roles of reactive oxygen species in interactions between plants and pathogens. Eur. J. Plant Pathol. 121, 267–280. doi: 10.1007/s10658-008-9302-5
Suzuki, N., Rivero, R. M., Shulaev, V., Blumwald, E., and Mittler, R. (2014). Abiotic and biotic stress combinations. New Phytol. 203, 32–43. doi: 10.1111/nph.12797
Vettori, D., and Rice, S. P. (2019). Implications of environmental conditions for health status and biomechanics of freshwater macrophytes in hydraulic laboratories. J. Ecohydraulics 5, 71–83. doi: 10.1080/24705357.2019.1669496
Wu, G., Ma, L., Sayre, R. T., and Lee, C. H. (2020). Identification of the optimal light harvesting antenna size for high-light stress mitigation in plants. Front. Plant Sci. 11:505. doi: 10.3389/fpls.2020.00505
Yang, T., Law, D. M., and Davies, P. J. (1993). Magnitude and kinetics of stem elongation induced by exogenous indole-3-acetic acid in intact light-crown pea seedlings. Plant Physiol. 102, 717–724. doi: 10.1104/pp.102.3.717
Zhang, L., Ma, H., Chen, T., Pen, J., Yu, S., and Zhaoe, X. (2014). Morphological and physiological responses of cotton (Gossypium hirsutum L.) plants to salinity. PLoS One 9:e112807. doi: 10.1371/journal.pone.0112807
Keywords: abiotic stress, hydrogen peroxide, stress responses, stress indicator, macrophyte management, Egeria densa, photoinhibition, iron stress
Citation: Asaeda T, Rahman M, Liping X and Schoelynck J (2022) Hydrogen Peroxide Variation Patterns as Abiotic Stress Responses of Egeria densa. Front. Plant Sci. 13:855477. doi: 10.3389/fpls.2022.855477
Received: 18 January 2022; Accepted: 16 February 2022;
Published: 16 May 2022.
Edited by:
Allan Lobato, Federal Rural University of the Amazon, BrazilReviewed by:
Muhammad Fasih Khalid, Bahauddin Zakariya University, PakistanMohammad Abass Ahanger, Northwest A&F University, China
Copyright © 2022 Asaeda, Rahman, Liping and Schoelynck. This is an open-access article distributed under the terms of the Creative Commons Attribution License (CC BY). The use, distribution or reproduction in other forums is permitted, provided the original author(s) and the copyright owner(s) are credited and that the original publication in this journal is cited, in accordance with accepted academic practice. No use, distribution or reproduction is permitted which does not comply with these terms.
*Correspondence: Takashi Asaeda, asaeda@mail.saitama-u.ac.jp