Round goby [Neogobius melanostomus (Pallas, 1814)], gudgeon (Gobio gobio L.) and bullhead (Cottus gobio L.) show distinct swimming patterns in a vertical slot fish pass
 Joschka Wiegleb
 Philipp E. Hirsch2
  Georg Rauter
- 1Program Man-Society-Environment, Department of Environmental Sciences, University of Basel, Basel, Switzerland
- 2University of Applied Sciences and Arts Northwestern Switzerland (FHNW), Windisch, Switzerland
- 3Institute for Water and River Basin Management, Karlsruhe Institute of Technology, Karlsruhe, Germany
- 4BIROMED-Lab, Department of Biomedical Engineering, University of Basel, Allschwil, Switzerland
The vertical slots of fish passes represent bottlenecks that must be passed by every fish migrating upstream. The hydraulics in fish passes are well investigated but less is known about the small scale behaviour of fish while passing the vertical slot. Understanding the species-specific swimming behaviour during the passage could allow for creation of future fish passes with hydraulics adapted to the swimming requirements of desired target species. We recorded the swimming trajectories of three fish species as point coordinates per video frame using cameras. Then, two common machine learning algorithms were used to identify species characteristic swimming patterns in the trajectories. A Random Forest model trained on 21 trajectory features revealed that water discharge, the spatial trajectory position, and the trajectory length were most distinct trajectory features among species. The model identified the species with a mean F1 score of 0.86 ± 0.08 SD for round goby [Neogobius melanostomus (Pallas, 1814)], 0.81 ± 0.12 SD for gudgeon (Gobio L.), and 0.58 ± 0.20 SD for bullhead (Cottus gobio L.). A Convolutional Neural Network achieved a mean F1 score of 0.89 ± 0.03 SD for round goby, 0.76 ± 0.05 SD for gudgeon, and 0.67 ± 0.02 SD for bullhead if exclusively trained on the point coordinates of the swimming trajectories. These results demonstrate that fish species exhibit distinct swimming patterns when passing through a vertical slot, and how these patterns can be used for species identification using machine learning algorithms. Because round goby achieved the highest F1 scores, we conclude that round goby showed the most characteristic swimming trajectories among the species tested. Future fish passage research should account for the individual swimming patterns of the fish in these bottleneck flow fields and on adapting the flow to the individual swimming patterns of the target fish. Flow conditions being supportive for swimming patterns of the desired fish could have the potential to improve the river connectivity and thereby support the aquatic biodiversity.
1 Introduction
More than 1.2 million instream barriers fragment European rivers (Belletti et al., 2020) and the majority of the world’s river systems is fragmented (Nilsson et al., 2005). Fish passes are frequently used to enable passage of fish across river obstacles (Katopodis and Williams, 2012), but how the fish behave to overcome the critical flow fields in such fish passes is widely unknown. Mechanistic studies on the performance of fish in fish passes, aiming at understanding why fish may succeed or fail passage, are needed to enable passage for a wide species spectrum, (Roscoe and Hinch, 2010). Roscoe and Hinch (2010) further reported that studies about fish passage behaviour in different hydraulic environments would be applicable to other passage facilities and expand the knowledgebase of fish pass science in general. Numerous types of fish passes have been developed after a trial-and-error approach, predominantly for salmonid species, while smaller, bottom dwelling fish were out of focus (Katopodis and Williams, 2012). The need to reduce river barriers to all species in aquatic ecosystems was raised by the Convention on Biological Diversity (United Nations, 1992).
Fish pass assessments can be based on numerous biological dimensions, which describe passage success quantitatively (Castro-Santos, Cotel, and Webb, 2009). Catching the migrating fish (such as Benitez et al., 2015), description of the hydraulics (Puertas et al., 2004; Wang et al., 2010; Fuentes-Pérez et al., 2018), and modelling approaches (Plesiński et al., 2018; Sanchez et al., 2020) can be used to assess the functionality of fish passes. Nevertheless, knowledge about the fine scale swimming behaviour of migrating fish in fish passes is scarce. Such insight about preferred swimming routes, behaviour response to flow fields, and differences in the swimming behaviour among species, might provide important mechanistic insight to understand how fish behave in specific flow regimes and how fish passes can be modified to support selected species.
Only few studies have recorded the passage behaviour on a trajectory level of fish migrating upstream the vertical slot (Rodríguez et al., 2015; Tan et al., 2018; Li et al., 2021; Wiegleb et al., 2022a). Schizothorax prenanti (Tchang 1930) preferred areas in the flow field with lowest velocity and turbulent kinetic energy (TKE), near the side walls (Li et al., 2021), which corresponds to the findings of (Rodríguez et al., 2015), who reported that four tracked fish species preferred low velocity areas near the side walls while passing a vertical slot. Rodríguez et al. (2015) reported further that all of the assessed fish species (Iberian barbell (Luciobarbus bocagei (Steindachner 1864), Mediterranean barbell (Luciobarbus guiraonis (Steindachner 1866)), Iberian straightmouth nase (Pseudochondrostoma polylepsis (Steindachner, 1864)), and brown trout (Salmo trutta L.) followed similar trajectories and crossed the same flow regions while swimming through the vertical slot. In general, all species increased swimming speed immediately before the vertical slot, while the speed was decreased if the vertical slot was passed. Rodríguez et al. (2015) did not provide a deeper description of the swimming behaviour between species. Another comparison of swimming trajectories in a vertical slot fish pass has been performed by Wiegleb et al. (2022a), who tested a protective barrier for invasive fish and were able to predict the fish species using Artificial Intelligence based on information about the swimming trajectories of migrating fish.
Swimming behaviour of fish differs among species and depends on the individual species biology (Cano-Barbacil et al., 2020; Lothian and Lucas, 2021). Whether fish can handle the complex flow conditions and have the capacity to overcome fish passes depends on swimming capacities (Tudorache et al., 2008), fish body shape, and fish size (Ohlberger et al., 2006). In addition, personal traits, such as boldness and exploration activity can determine whether a fish passes a fish pass or not (Hirsch et al., 2017; Lothian and Lucas, 2021). Fish can prefer specific flow conditions (Liang et al., 2021) and assess flow fields for suitability prior deciding for or against passage (Williams et al., 2012). While vertical slot fish passes are designed to create standardized flow fields passable by desired fish species (Katopodis and Williams, 2012) and the flow conditions created in vertical slot fish passes are well described (e.g., Wu, Rajaratnam, and Katopodis, 1999; Liu, Rajaratnam, and Zhu, 2006; Quaranta et al., 2017), less is known about swimming behaviour and the swimming trajectories of individual fish species in such fish passes.
Fish create thrust by inducing vortices using their fins in the liquid environment (Sfakiotakis et al., 1999; Lauder and Madden, 2007). For propulsion, some fish move their body and their caudal fin, or propulse using their pectoral fins (Sfakiotakis et al., 1999). In flowing water, fish species experience different hydraulic forces, depending on their body shape (Wiegleb et al., 2022a) and different strategies have been developed to overcome flow. For instance, adaptation of body shape to increased flow (Imre et al., 2002; Pennuto and Rupprecht, 2016), the use of microhabitats (Facey and Grossman, 1992; Davey et al., 2005), and usage of specific turbulence conditions allow for reduced energetic costs when swimming in flowing water (Facey and Grossman, 1992; Liao et al., 2003). Salmonid fish can make use of vortex structures to propulse passively (Beal et al., 2006). Nevertheless, fish have to leave flow sheltering structures and move actively through the high velocity region of passing vertical slots. Thereby, they can assess flow fields prior passage and choose routes allowing passage corresponding their individual swimming performance requirements (Williams et al., 2012). Which routes fish choose to overcome specific flow conditions, and how these routes differ among species, is presently unknown. We fill this knowledge gap in the present study by comparison of the swimming behaviour of three different and comparable fish species (round goby Neogobius melanostomus (Pallas, 1814), gudgeon Gobio gobio L., and bullhead Cottus gobio L.).
Round goby is an aquatic invasive species, native in the Ponto-Caspian Sea, that is a prominent invader in the Laurentian Great Lakes in America and European river systems, as well as the Baltic Sea (Kornis et al., 2012). Round goby is a bottom dwelling fish with a characteristic burst-and-hold swimming style that improves its critical swimming speed (Tierney et al., 2011; Gilbert et al., 2016). A specialized strategy for overcoming flow resistance via station holding at the bottom at higher flow using pectoral fins has been described for the round goby (Hoover et al., 2003; Carlson and Lauder, 2011; Tierney et al., 2011). A similar flow resistance strategy has been reported for bullhead (Tudorache et al., 2008; Egger et al., 2020), which inhabits a similar ecological niche as the round goby (Roje et al., 2021). Bullhead live in smaller tributaries with strong water velocities, which are potential invasion areas for the round goby. Compared to round goby, bullhead was reported to orient to higher velocity areas in laboratory experiments (Roje et al., 2021), while bullhead was listed as “weak” swimmer together with gudgeon (Tudorache et al., 2008). Gudgeon also occurs in such tributaries but has a different, subcarangiform swimming style and is described a semi-pelagic swimmer (Egger et al., 2020; Wiegleb et al., 2022a). In the present study, we questioned whether the species show different swimming patterns when swimming upstream in a vertical slot 1), how the swimming patterns differ among species 2), and how the fish adapt their behaviour at higher water discharge in the vertical slot 3). We compared the swimming trajectories displayed by round goby, gudgeon, and bullhead at three different water discharge rates in a vertical slot fish pass using two common machine learning approaches. Different features from the trajectories were computed and used to train a Random Forest model to predict the fish species using trajectory features and identify the features most important for discrimination between species. Then, we trained Convolutional Neural Networks (CNNs) on the trajectory coordinates to test whether the CNNs can use more complex patterns in the trajectories for discrimination among species, which were not accounted by the Random Forest analysis. With this approach, we expected to identify swimming patterns characteristic for the different species to understand how fish differently overcome flow fields with such ecological relevance as a vertical slot in a fish pass that represents the river connectivity bottleneck.
2 Materials and methods
The present study reports data obtained from an experiment conducted in spring 2019 at the Theodor-Rehbock Hydraulic Engineering Laboratory at the Karlsruher Institute of Trechnology, Karlsruhe, Germany (KIT). The swimming behaviour of 39–45 live round goby, gudgeon, and bullhead (species were tested separately, see Supplementary Material S1 for individual numbers per trial) was tested in a nearly full scale (1:1.6) vertical slot fish pass. After releasing the fish at the downstream end of the test rig, the fish were free to swim upstream through the first vertical slot, which had a width of 28.0 cm. Fish swimming further upstream encountered a prototype hydraulic barrier, which was installed in the second vertical slot. In previous publications we compared frequencies of specific behaviours of the fish between first slot and barrier (Egger et al., 2020), described the performance of the prototype hydraulic barrier (Wiegleb et al., 2022a, and described the impact of hydraulic forces of the passage success of the fish in the first vertical slot (Wiegleb et al., 2022b) with data from the same experiment. In the present study, we compare the swimming behaviour among fish species when swimming through the vertical slot on a trajectory level and focus on understanding the small scale swimming behaviour of the fish. In the following, “trajectories” are understood as time series of fish location observations (Cartesian coordinates) and “swimming routes” describe the prevailing course across the vertical slot of multiple trajectories.
2.1 Fish catch, maintenance, and ethical approval
Bullhead and gudgeon were sampled in the River Alb in Karlsruhe, Germany, in March 2019 by means of electrofishing and transported to the KIT immediately. Round goby were caught between 22 and 29 March 2019 in the High Rhine in Basel, Switzerland, using minnow traps. We used dog food (Frolic ®) as bait. Details about the fish catchments and maintenance are reported in Egger et al. (2020). All animal experiments were approved by the Swiss cantonal authorities (permits Nr. 2,934 and 2,846) and the German regional authorities (permit Nr. G217_17-IWG).
2.2 The swimming experiment
One of the most challenging tasks in training machine learning models for discrimination between species on swimming trajectories is obtaining sufficient training data (trajectories displayed by fish of doubtlessly known species). Fish species identification by eye from a real fish pass can be challenging and some species can only be identified reliably using DNA analysis approaches, such as Atlantic salmon (Salmo salar L.). The most accurate approach for obtaining training data of fish with known species was to separate a section in a fish pass and release only fish of one species. This species was released in the downstream end of the test rig and was immediately free to swim in the fish pass for 2 hours, unaffected by human presence. A camera (Security-Center IR CCTV-Camera, 380 TV-lines, Abus, Wetter, Germany) was installed vertically above the vertical slot with submerged lens. This camera recorded the area of the vertical slot, between the partition walls, which had to be crossed by every fish migrating upstream. After the experimentation period of 2 h, we reduced the water supply and collected all fish by nets, placed them in the flow through aquatic system for regeneration and continued the experiment with the next species. All three species were once tested at 80 L/s water discharge. Then, we increased the water discharge and tested all three fish species once at 105 L/s. Finally, we tested the fish at 130 L/s for three times each species because this water discharge was assumed representative for real fish passes (Bombač et al., 2017). The same fish individuals were used across the entire experiment, wherefore learning effects in the fish may have supported passage at the higher water discharges. The fish were tested once a day with at least one night regeneration time between trials. Because increasing the water discharge between the trials reduced the water level downstream from the vertical slot slightly, which reduced the camera view, there was a need to readjust the camera slightly at the 130 L/s water discharge. The water level downstream the vertical slot was 38 cm at 130 L/s water discharge, 47 cm at 105 L/s and 56 cm at 80 L/s. The water level upstream the vertical slot was 48 cm at 130 L/s water discharge, 53 cm at 105 L/s and 56 cm at 80 L/s.
After the experiment, the videos were undistorted in Blender (v.2.79) (Blender Community, 2017) and the fish trajectories were recorded by hand using the integrated object tracking tool in Blender (see Supplementary Material S2 for the trajectory data). The generated trajectories were imported in R v4.0.2 and a palette of 21 features describing these trajectories was computed using the “trajr” (McLean and Skowron Volponi, 2018) package to obtain simple numerical descriptions of the trajectories that could be used for training the Random Forest model (Table 1). Similar to Egger et al. (2020) and Wiegleb et al. (2022a), the trajectories were assigned to categories: “Passage” (the fish entered the camera view from downstream and left in upstream direction), “Return” (the fish entered the camera view from upstream and left in downstream direction), and “Approach” (the fish entered the camera view from downstream and left in downstream direction again). These event types were included in the features data set. Code used to analyse the data is provided in Supplementary Material S3.
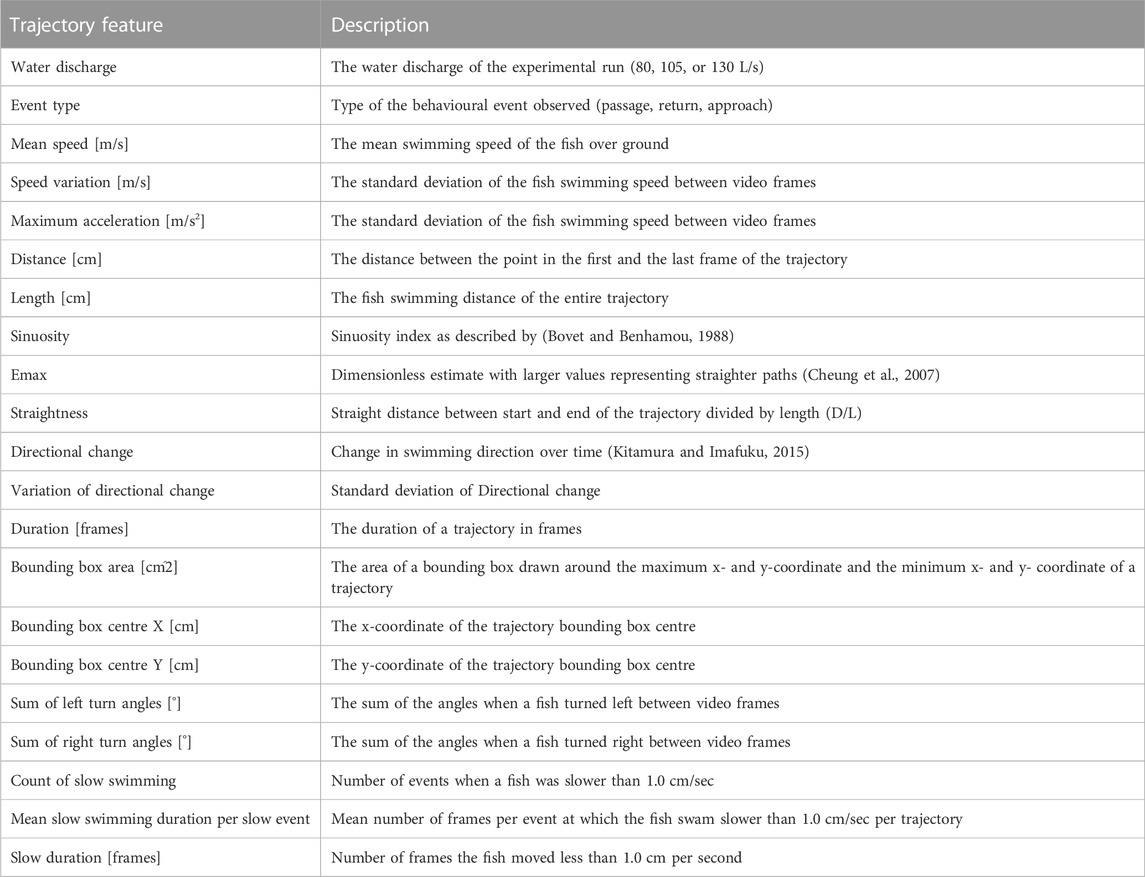
TABLE 1. Features describing the trajectories that were computed for the random forest analysis.
2.3 Predicting the species using a random forest model
Random forests represent powerful machine learning classifiers, which were chosen in the present study because of their high prediction accuracy and the ability to determine the importance of the different features for the prediction (Cutler et al., 2007). To test the Random Forest prediction accuracy on all trajectories of the data set, we performed cross validation. The fish were free to swim through the slot voluntarily and especially bullhead showed generally a small number of voluntary trajectories during the experiment, resulting in a small number of available training data for the Random Forest model (Table 2). Similar to Wiegleb et al. (2022a), we created three data sets with equal species proportion to ensure that similar proportions of species trajectories were present in the cross validation data sets (Figure 1). After computing the trajectory features (Table 1, see Supplementary Material S4 for the features data), we used the “randomForest” package (Liaw and Wiener, 2002) in R to train random forest models, which consisted of 1,000 trees and 10 variables randomly sampled at each split:
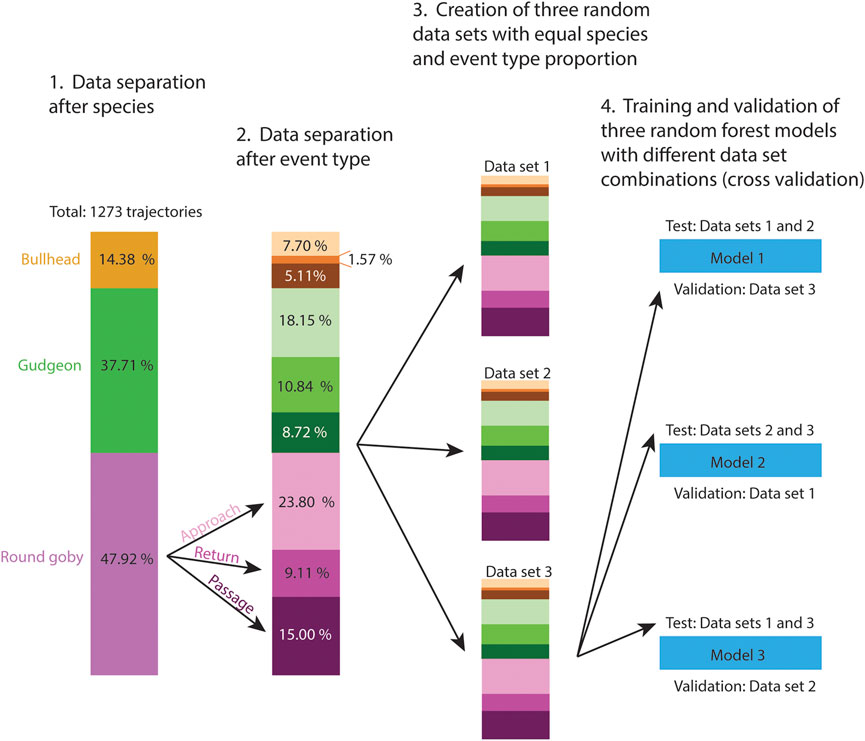
FIGURE 1. Pre-processing (1.–3.) of the trajectory features data set prior cross validation of the random forest model (4.). Three data sets of similar size were created for cross validation. Because we recorded different amounts of trajectories per fish species and event types, we distributed the trajectories of these categories with equal proportion between data sets to ensure the categories were represented in the training data as well as in the validation data sets.
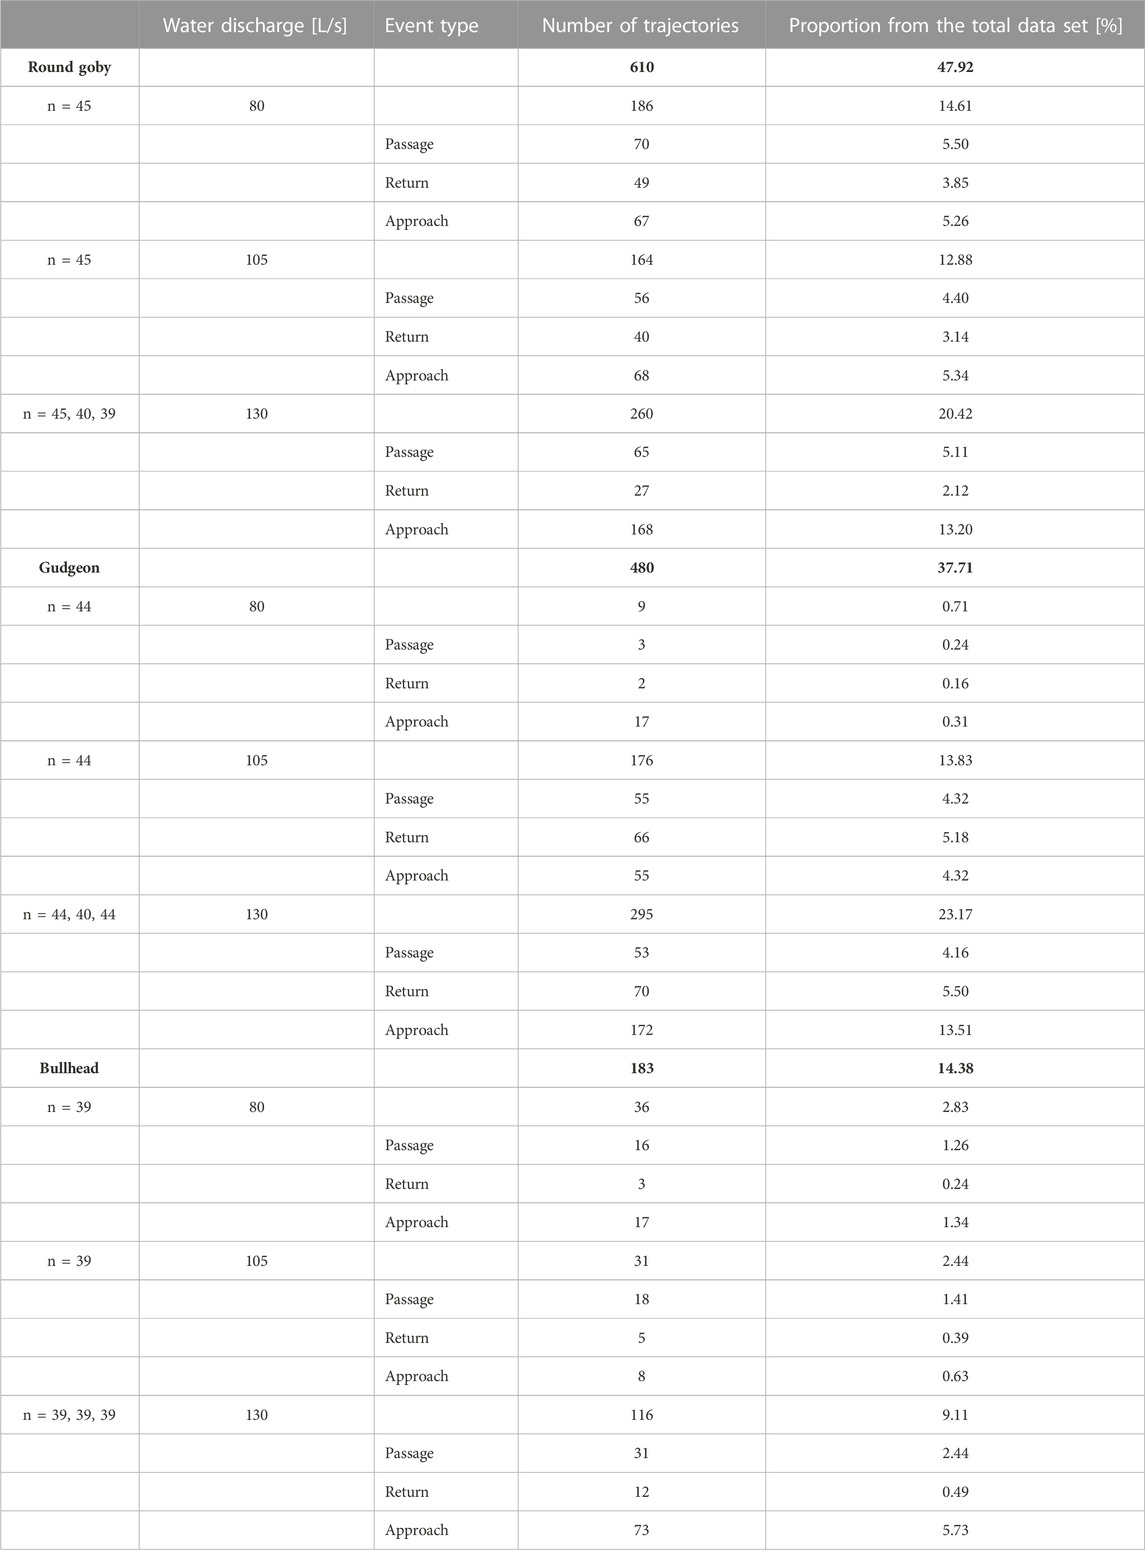
TABLE 2. Number of trajectories and their proportion from the total data set (1,273) for the different species, water discharges, and event types. The total numbers and percentages of trajectories per species are highlighted in bold.
Cross validation was performed with the three balanced data sets to determine the mean prediction accuracy of the species with inclusion of all recorded trajectories. The mean prediction accuracy per species (Aca) among the three models was computes as follows:
With Cpreda being the number of correct predictions of species a, Fpredb being the number of false predictions to be species a although it is actually species b, and Fpredc being the number of false predictions to be species a although it is actually species c. Because the prediction accuracy is a measure for the amount of correctly predicted trajectories of a category and does not account for the amount of false positive predictions, we computed the F1 score following Tharwat (2018):
With the number of true postitive (TP), false positive (FP) and false negative (FN) predictions. The F1 score ranges from 0 (bad model performance) to 1 (perfect model performance). To describe the importance of the variables for the species prediction, we computed the mean decrease of accuracy if training the model without this variable (MDA).
2.4 Species prediction using convolutional neural networks
The Random Forest model accounted for multiple features of the trajectories. Nevertheless, it is possible that more complex patterns exist between species than included by the features of the Random Forest model. For instance, the species showing a burst-and-hold swimming style (round goby and bullhead) might interact with gravel at the bottom, while meso-pelagic species, such as gudgeon, might choose different routes. To account for these complex patterns, we trained a Convolutional Neural Network for predicting the fish species on the raw trajectory coordinates. To focus our analysis on the swimming behaviour while passage of the vertical slot, the CNN was trained on “passage” trajectories only and we excluded “returns” and “approaches”.
Convolutional Neural Networks are inspired by the structure of the visual cortex of animals and are able to recognize complex patterns from data on their own with minimal data pre-processing, such as raw pixels (Gu et al., 2018). We designed a simple CNN network architecture (Figure 2), consisting of three convolutional blocks and a fully connected block. Every convolutional layer (Conv1D) provides filters (convolutions) that can be activated (we used the common “relu” activation function) if specific patterns are identified in the trajectory. The higher the level of the layer, the more complex can be the patterns, which lead to an activation. The number of filters increases with the level of the convolutional block, which allows for recognition of a higher number of patterns in the trajectories. The combinations of activated filters in the third convolutional block are further combined within the fully connected block. This fully connected block consists of a layer (Flatten) that reduces the filters to one dimension, Dense, and Dropout layers, which reduce the information until the network provides three output values in the output layer (softmax activation function). Every value of this output layer provides a prediction score for one species. The length of the trajectory is reduced along the entire network to condense the trajectory information from 250 input values (125 x- and y-coordinates) to these output values. We implemented MaxPooling layers at the end of every convolutional block and Dropout layers in the fully connected part of the model to prevent the model from overfitting while training. Please see Gu et al. (2018) for further details about the design of CNNs. The model provided in total 870,467 trainable parameters.
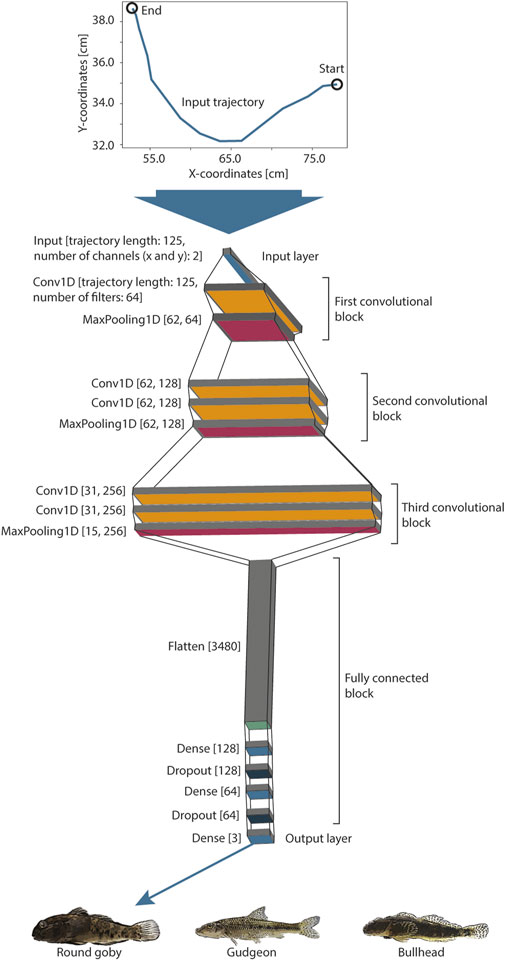
FIGURE 2. A convolutional neural network was designed and trained on the passage swimming trajectories to predict the fish species. The trajectories of standardized length (125 point coordinates) were rescaled and fed to the input layer, which was followed by three convolutional blocks. These convolutional blocks were followed by a fully connected block and three model output nodes, which provide the classification signal for the three fish species.
Because the recorded trajectories had different length and CNNs require input of the same size, we trained the model on the last 5 seconds of the trajectories, which was the time frame when the fish commonly passed the vertical slot. All shorter trajectories were filled up with zeros and we only used trajectories longer than six frames. Under these conditions, we obtained a data set of 914 swimming trajectories.
Training CNNs on larger data sets improves the model performance. We applied data augmentation, a common approach to increase the amount of training data if small original data sets are available. The trajectory coordinates were transformed using a slight random scatter using the numpy.random.normal () function (random numbers were sampled from normal distribution with Standard Deviation around a point coordinate of 0.3 cm), which changed the trajectories slightly but did not affect the overall appearance of the trajectory course (please see Gu et al. (2018) for details about data augmentation), until we obtained a balanced data set of 1800 trajectories per prediction category (fish species). We assessed the prediction accuracy of the trained CNN on all original (unaugmented) trajectories using cross validation. We split the data set to three training sets of the same size and split only the original trajectories to three test sets of the same size (Figure 3). Now, cross validation was performed by combining two training sets, training the model on these sets, and predicting the species or water discharge on the third test set, whose trajectories have not been included in training. The trained weights of the CNNs are provided in Supplementary Material S5.
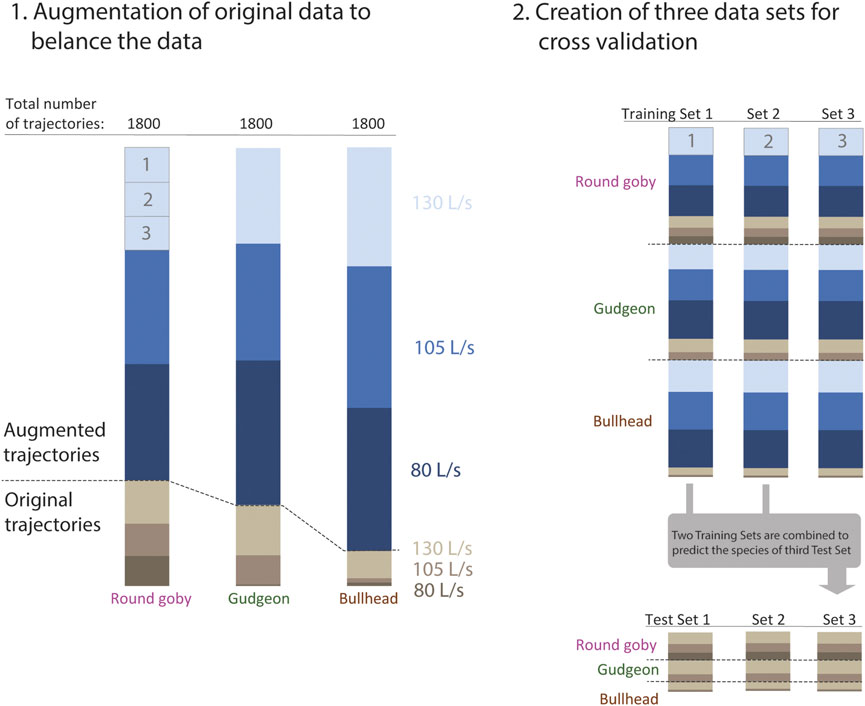
FIGURE 3. 1.: The passage trajectories were used for training and validation of the convolutional neural network. The data were separated after categories (fish species and water discharge). Data augmentation was applied to create three data sets for every species of same size (1800 trajectories). 2.: The species data sets were combined and split to create three balanced training data sets with equal proportion of augmented trajectories, species, and water discharge categories. In addition, we created three test sets from the original trajectories to validate the models only on original data. For every cross validation, two training sets were combined and used for training the network. This network was then validated on the third test set, whose trajectories have not been seen by the model while training.
2.5 Ground elevation
Because we observed resting of especially round goby and bullhead behind the gravel, predominantly when they approached the vertical slot, we described the ground structure in the vertical slot area. We therefore took 70 pictures of the vertical slot area with a camera (Nikon D3500) and triangulated these pictures to a 3D model of the vertical slot area using Regard 3D (x64 1.0.0). The generated 3D model was imported in Blender, where the scale was adjusted and the 3D coordinates of the point cloud were exported to.csv files. An elevation chart (x and y dimension representing spatial coordinates and z dimension representing the ground elevation) was then created in R v4.0.2. The data of the 3D ground elevation model are provided in Supplementary Material S6.
3 Results
3.1 The trajectories of fish swimming across the vertical slot
The video tracking analysis revealed one passage route (prevailing course of multiple fish) across the vertical slot for all species and across all water discharges (Figure 4). The fish frequently entered the camera view from the downstream right side, swam along the right partition wall, and left the camera view in the right, upstream direction (Figure 4). Especially gudgeon and bullhead followed this route. Beside to this general route, especially round goby displayed an alternative passage route: some round goby (13 fish at 80 L/s, 11 at 105 L/s, 4 at 130 L/s) entered the screen from the left side, crossed the slot area and passed the slot at the right side close to the partition wall (see Figures 4B, F). Bullhead (5 fish at 80 L/s, 2 at 105 L/s, and 3 at 130 L/s) and gudgeon (2 fish at 105 L/s and 2 at 130 L/s) sometimes made use of this alternative route. In general, round goby showed the tendency to swim along the centre of the vertical slot across all water discharge rates, while gudgeon and bullhead oriented more to the right. Round goby predominantly returned at the left side while predominantly passing at the right in the vertical slot. This was not observed for gudgeon, which returned where they passed, at the right side of the slot. Also in approaches gudgeon oriented to the right, while round goby approaches were generally distributed over the slot area at 80 and 105 L/s with a slight tendency to the right half of the slot area at 130 L/s water discharge. These swimming patterns in the spatial course of the swimming trajectories (Figure 4) were predominantly accounted by the Random Forest model in the trajectory features describing the location of trajectories (such as “Bounding box centre X”, “Bounding box centre Y”) and features describing the course of a trajectory (such as “Length”).
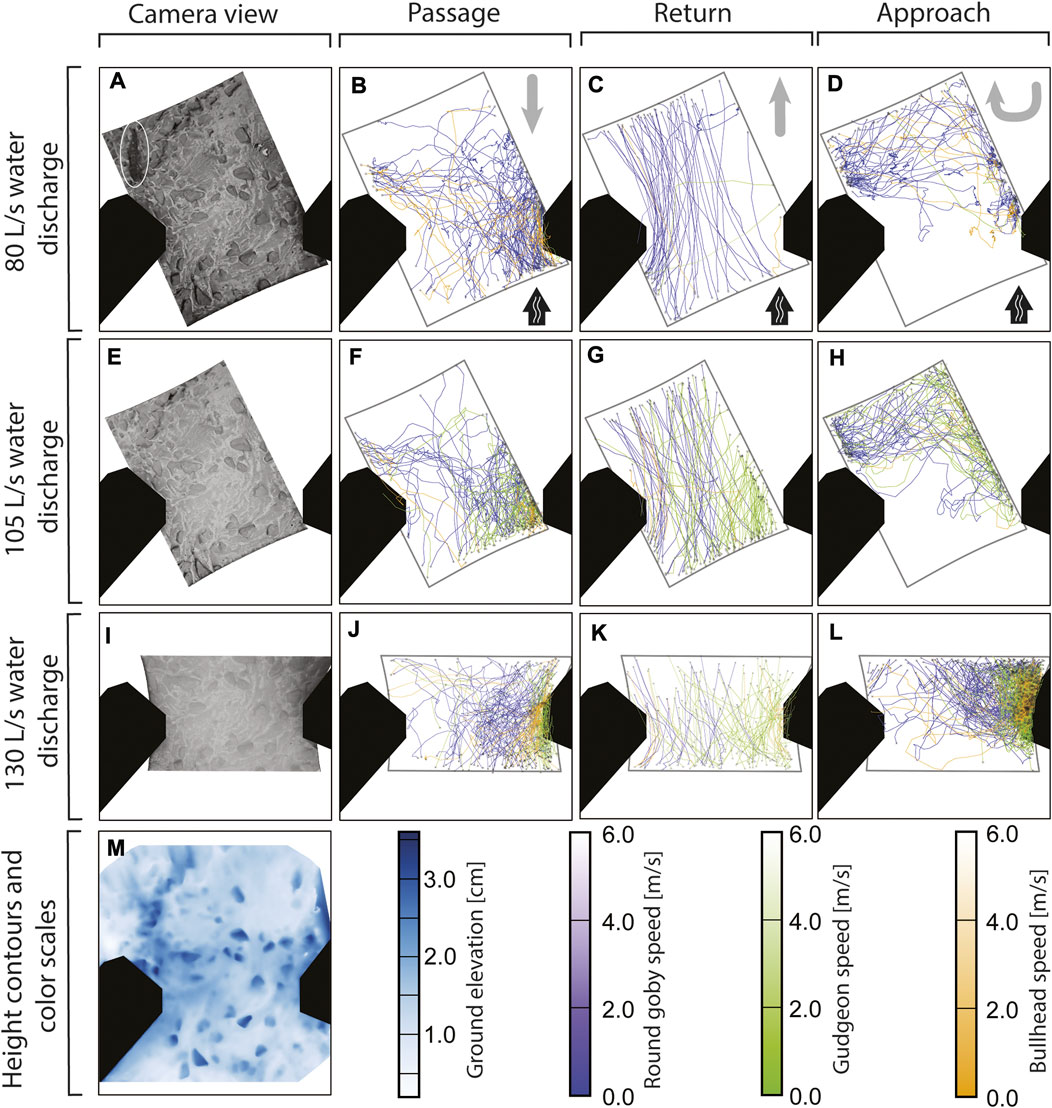
FIGURE 4. Fish trajectories of round goby, gudgeon, and bullhead recorded with a camera above a vertical slot at different water discharges (B–D,F–H,J–L). The swimming direction for the corresponding event (passage, return, or approach) is provided in (B–D) by grey arrows in the upper right corner, with black arrows indicating the water flow direction. The camera view is provided at the left side (A,E,I) with one round goby displayed (white ellipse in A). Ground elevation in the vertical slot area (M) was determined using triangulation of 70 camera images of the slot area.
Most round goby trajectories were recorded at lower water discharge (186 trajectories at 80 L/s water discharge, 164 at 105 L/s, and mean 91.00 trajectories ±48.22 SD at 130 L/s), while most trajectories for gudgeon were recorded at the intermediate water discharge (9 trajectories at 80 L/s water discharge, 176 at 105 L/s, and mean 109.67 ± 14.29 SD at 130 L/s), and there was no clear change in the amounts of bullhead trajectories across all water discharges (36 trajectories at 80 L/s water discharge, 31 at 105 L/s, and mean 44.00 ± 3.61 SD at 130 L/s) (Table 2).
3.2 Fish species prediction based on trajectory features using a random forest model
The Random Forest was trained on trajectory features that were extracted from the trajectories, which allowed for identification of the features being most important for species prediction. Cross validation revealed that the model performed best for prediction of round goby, as revealed by the highest mean F1 score (mean F1 score 0.86 ± 0.08 SD), whilst the mean F1 score for gudgeon (0.81 ± 0.12) was slightly lower, and the mean F1 for bullhead (0.58 ± 0.20) was lowest (Figure 5). The water discharge, the position of the trajectory in the slot area, and the length of the trajectories were the most important features for the fish species identification using the random forest model. The variable “water discharge” showed 82.98 MDA (mean decrease of accuracy if training the model without this variable) ± 32.50 SD, the “centre of the bounding box in x-direction” showed 72.58 MDA ±10.67 SD, the “centre of the bounding box in y-direction” showed 68.46 MDA ±1.78 SD, and the “trajectory length” showed (32.64MDA ±6.32 SD). The least important variables for species prediction were the “count of station holding in a trajectory” 18.56 MDA ±4.12 SD, “Emax” (20.95 MDA ±5.83 SD), and “sinuosity” (23.00 MDA ±5.94 SD) (Figure 6).
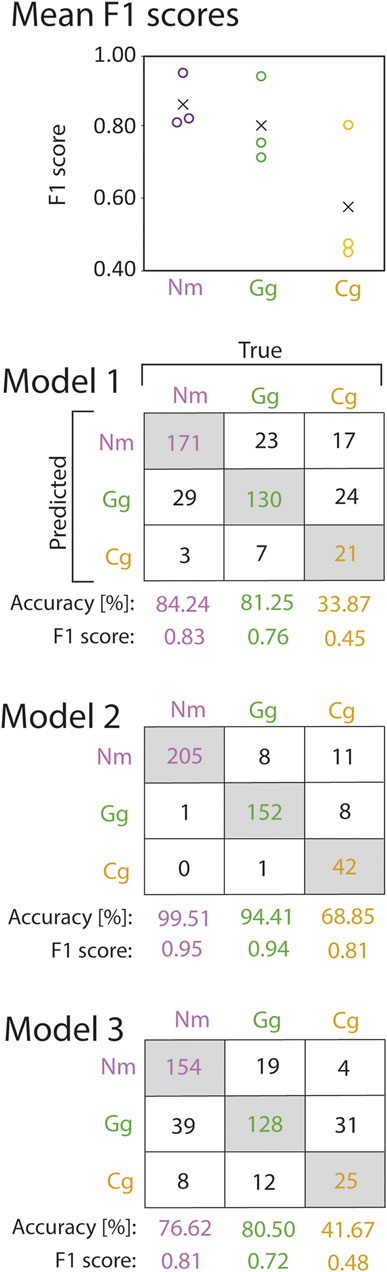
FIGURE 5. F1 scores (circles) and mean F1 scores across all cross validation models (crosses) of round goby (Nm), gudgeon (Gg), and bullhead (Cg) species prediction from the random forest cross validation (top). Corresponding confusion matrices are provided below. Numbers in the grey shaded boxes represent the number of correctly predicted trajectories for the corresponding fish species. Numbers in white boxes represent false predictions.
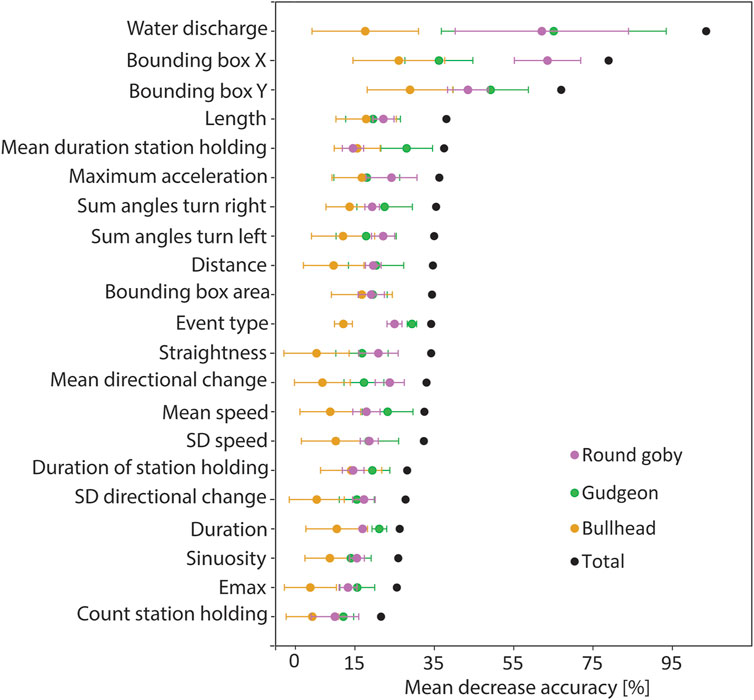
FIGURE 6. Prediction importance for the trajectory features (abszissa) measured as mean accuracy decrease when predicting without the corresponding feature (ordinate). Error bars indicate the standard deviation between the models of the cross validation.
3.3 Trajectory metrics being most and least important for species prediction
The features of high importance for the species prediction (X- and Y-coordinates of the bounding box centre, the length of the trajectories) showed high variation between species and water discharges (Figure 7). “Mean duration of station holding” was on rank number five for features being most important for species prediction but showed predominantly low values. Only bullhead (mean 33.56 s ± 60.92 SD) and round goby (mean 7.25 s ± 10.73 SD) showed extended station holding behaviour at the vertical slot at lower water discharge (80 L/s), while station holding was remarkably decreased for these species at 105 and 130 L/s and nearly played no role in gudgeon swimming (Figure 7). Contrary, the features with small impact on prediction of the species showed similar behaviour response between species to increased water discharge. We observed for all species remarkable increases in mean swimming speed (round goby 200.00%, gudgeon 51.11%, and bullhead 463.63%) and variation in swimming speed (round goby increase: 72.22%, gudgeon 74.55%, and bullhead 168.57%) (Figure 7). Round goby were the fastest swimmers through the vertical slot at 130 L/s (mean swimming speed 1.59 m/s ±0.68 SD), while gudgeon passed with a mean swimming speed of 1.36 m/s ±0.76 SD and bullhead was the slowest fish while passage with 1.24 m/s ±0.74 SD.
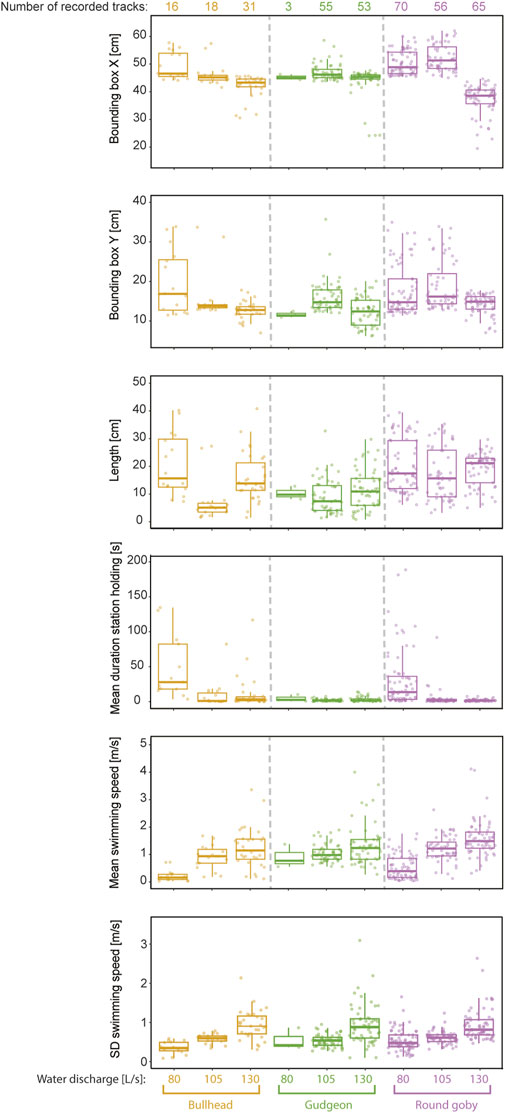
FIGURE 7. Selection of features for fish passage trajectories recorded in the vertical slot at different water discharges.
3.4 Species prediction using a convolutional neural network
The CNNs were trained on exclusively the trajectory coordinates. Therefore, the CNNs were able learn complex patterns within the trajectories, and able to use these patterns for fish species identification. The high F1 scores of the trained CNNs on the validation data sets revealed that it is possible to predict the species on trajectory coordinates. We observed the highest F1 scores for round goby (mean F1 0.89 ± 0.03SD), whilst the gudgeon F1 score was slightly lower (0.76 ± 0.05SD). Bullhead showed the lowest F1 score across all species (0.67 ± 0.02SD) (Figure 8).
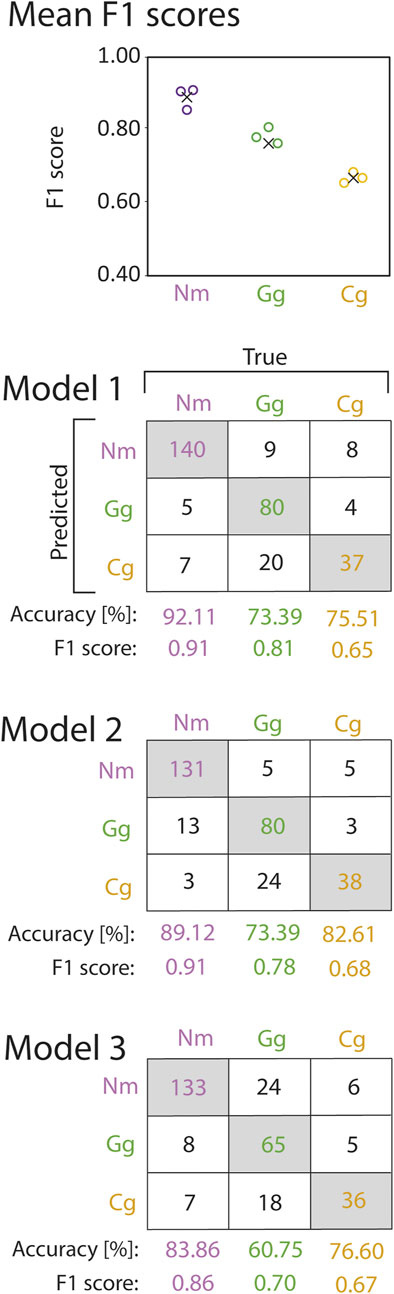
FIGURE 8. F1 scores (circles) and mean F1 scores across all cross validation models (crosses) of round goby (Nm), gudgeon (Gg), and bullhead (Cg) species prediction from the convolutional neural network cross validation (top). Corresponding confusion matrices are provided below. Numbers in the grey shaded boxes represent the number of correctly predicted trajectories for the corresponding fish species. Numbers in white boxes represent false predictions.
Because the CNN was trained on the trajectory coordinates and not on features extracted from the trajectories, such as the Random Forest, the CNN was able to generalize across patterns within the trajectories that the CNN identified itself and that might be more complex than the features applied at the Random Forest. The relevance of such complex patterns was especially relevant at the prediction of bullhead, when the F1 score was 15.51% higher at the CNN compared to the Random Forest prediction.
4 Discussion
4.1 Swimming patterns of the fish species in the vertical slot: Filling the research gap
The prediction of the Random Forest models and the Convolutional Neural Networks revealed distinct swimming patterns among species when they challenged the flow in a vertical slot. The number of trajectories per species recorded at the different water discharges, the spatial position of the trajectories, and trajectory length made the most important difference in the swimming patterns among species. There might be various reasons why the fish displayed these different swimming patterns as the behaviour of fish is complex and depends on the individual species’ biology (Cano-Barbacil et al., 2020; Lothian and Lucas, 2021). Flow regimes can have supportive, as well as disadvantageous energetic effects on the swimming fish (Liao, 2007) and we therefore assume that the fish chose the most advantageous swimming behaviour, corresponding to their individual requirements. The flow field of a vertical slot has been shown to differently affect the fish species physically as different hydraulic burden the fish have to overcome in a vertical slot have been reported by Wiegleb et al. (2022a) and Wiegleb et al. (2022b). These findings, together with the present study, suggests that the flow induced by vertical slots affect the swimming behaviour of fish differently. Because fish passes function as bottlenecks and must be passed by every fish migrating upstream, we conclude they have the potential to act as ecological filters and impact the species composition in ecosystems (Rahel and McLaughlin, 2018).
4.2 Differences and similarities in the swimming patterns between species
One of the two general passage routes (fish swam along the right partition wall) was favoured across all water discharges by several fish of all species. This observation agrees with Rodríguez et al. (2015) who observed that fish [they tested Iberian barbell (Luciobarbus bocagei Steindachner, 1864), Mediterranean barbell (Luciobarbus guiraonis Steindachner, 1866), Iberian straightmouth nase (Pseudochondrostoma polylepsis Steindachner, 1864), and brown trout (Salmo trutta L.)] exploited similar flow regions when passing a vertical slot and displayed similar trajectories. It is possible that the fish of the present study chose specific routes because they provide the most supportive conditions for fish to overcome flow field in the vertical slot. This route along the right partition wall represented the shortest way across the vertical slot and flow velocities were reported lower near the side walls than in the centre of the vertical slot (Wiegleb et al., 2022b). Li et al. (2021) observed a similar orientation of Schizothorax prenanti Tchang (1930) to areas of reduced water velocity and increased Turbulent Kinetic Energy near the partition wall while passage of a vertical slot.
One alternative passage route was observed for predominantly round goby, which frequently swam from the left separation wall to the right wall prior passage, especially at 80 and 105 L/s water discharge. Potentially, round goby explored the flow field by swimming from the left to the right, while deciding for or against passage. One important factor for the decision whether to pass the slot or not might be the hydraulic force experienced by the fish. We observed a reduction of the passage probability of live round goby and bullhead when the fish experienced larger hydraulic burden at the higher water discharge (Wiegleb et al., 2022b). This would explain the high number of round goby which approached the slot from the left, and then left the camera view on the right, after deciding against or being prevented from passage.
In general, round goby showed an orientation to pass through the vertical in the centre of the vertical slot, where round goby rested at the bottom frequently while showing the typical burst-and-hold swimming style (Hoover et al., 2003; Carlson and Lauder, 2011; Tierney et al., 2011). Some bottom-dwelling fish can use specialized body postures and fin adjustments adapted to the bottom substrate to resist the water flow (Carlson and Lauder, 2010; Carlson and Lauder, 2011). Potentially, round goby found conditions supporting this station holding behaviour in the vertical slot centre when following this characteristic passage route. Bullhead showed a similar station-holding behaviour (Egger et al., 2020) but oriented, contrary to round goby, strictly to the right partition wall. Overall, bullhead showed least trajectories across the vertical slot of all species tested, but single individuals rested for extended periods at specific locations until an individual passed. The free place was then quickly occupied by another fish, which stayed there for a long period until passage. This suggests that bullhead is quite specialized in the conditions that allow for passage, follows specific routes and waits for supportive flow conditions. Based on this observation we raise the question whether such “queueing” effects have the potential to limit the passage of bullhead across fish passes. If fish are limited in the number of potential routes across a flow field and fish wait for supportive flow in the entrance of such routes, the overall passage of a population may be limited by the fish pass hydraulics.
It should be noted that the fish were able to learn the most advantageous passage routes in our experiment because the same fish were tested for multiple times and at the different water discharges. The experiment was started at the lower water discharge. The higher water discharge was tested later, wherefore the fish were more experienced in passage at the higher water discharge. In addition, the fish were tested in groups, which means that the fish may affected each other while swimming and shoaling effects could affect the swimming behaviour as shown by de Bie et al. (2020) and Magnhagen. (2012). This was especially observed for gudgeon, which passed the vertical slot in groups of multiple fish frequently.
Gudgeon has a bentho-pelagic swimming style and was reported as “weak” swimmer, together with loach and bullhead in comparison to trout, roach, and carp (Tudorache et al., 2008). Egger et al. (2020) reported a low swimming activity at lower water velocity, while gudgeon increased swimming at higher flow velocities. This was also observed in the present study, when gudgeon displayed least trajectories at the smallest water discharge tested. Most gudgeon trajectories were recorded at 105 L/s, while the number of trajectories was lower at 130 L/s, together with an expressed orientation of the trajectories to the right partition wall and shorter trajectories. These observations support that gudgeon experienced more unsupportive flow for passage at 130 L/s and reacted on this unsupportive flow with orientation to the partition wall to reduce the length of the passage trajectories.
Overall, our observations agree with reports that fish can prefer specific flow conditions, supporting their individual swimming styles (Liang et al., 2021) and that corridors of specific turbulence conditions, supporting individual swimming styles can reduce energetic costs (Facey and Grossmann, 1992; Liao et al., 2003). Potentially, the own motivation for passage, the possibility to wait for supportive conditions, and the ability to explore the flow field during the multiple trials allowed for the remarkable swimming performance of all three tested species when passing the vertical slot at the highest water discharge. With mean swimming speeds of 1.59 m/s over ground for round goby, 1.36 m/s for gudgeon, and 1.24 m/s for bullhead, every species achieved much higher speeds than observed during Usprint tests (round goby Usprint: 0.43 m/s, gudgeon: 0.56 m/s, bullhead: 0.55 m/s) (Egger et al., 2020) and Ucrit tests [round goby Ucrit: 0.21 m/s (Hoover et al., 2003), round goby Ucrit: 0.36 m/s (Tierney et al., 2011)]. Beside the individual species swimming behaviour and the hydraulics the fish encounter, further factors like motivation or personality traits can affect fish passage (Hirsch et al., 2017; Lothian and Lucas, 2021). Here, further research is needed to understand how personality, motivation, learning, and further factors affect the swimming trajectories of fish to understand how much the behaviour is determined by the flow conditions the fish encounter while passage.
4.3 Fish species identification based on swimming trajectories using artificial intelligence
We achieved high F1 scores for the fish species prediction based on swimming trajectories in a vertical slot using machine learning approaches, such as Random Forest and Convolutional Neural Networks (CNN). The CNN predicted the species on the trajectories with higher accuracy than the Random Forest model, although it was trained on a smaller data set of trajectories (CNN data set size with the original, unaugmented trajectories was 71.0% of the Random Forest data set) and the feature most important for the Random Forest prediction (water discharge) was not included in the CNN prediction. That the CNN was nevertheless able to achieve such high accuracies if trained on trajectory coordinates shows, the model was able to use species specific patterns in the trajectories for its prediction. Because the prediction accuracy of the CNN was highest for round goby and lowest for gudgeon, we conclude that round goby showed the most characteristic swimming patterns within their trajectories, whilst the swimming trajectories of gudgeon were least characteristic among the tested species.
Because the CNN requires input trajectories of the same length, we trained the CNN on trajectories with a maximum length of 125 frames (5 s). The patterns learned and used to discriminate between species do not become evident from the CNN due to the methodical properties. Indeed, CNNs find relevant patterns themselves and are able to make use more complex patterns than the features computed for the Random Forest (such as mean swimming speed, trajectory length, or maximum acceleration). An example for such a pattern is the potential variable use of the ground structure of the fish. The species swam predominantly at the bottom and round goby, as well as bullhead, make use of the reduced velocity between rocks and gravel. The measurement of the bottom elevation shows several small rocks in the vertical slot area with elevation up to 3 cm. We observed round goby and bullhead at station holding between these rocks frequently and therefore included station holding when training the Random Forest. To account for more complex patterns in the swimming trajectories, such as multiple fish swimming around the same rocks, we performed the Neural Network analysis and trained the CNN on the swimming trajectories. This inclusion of complex patterns in the prediction is one important advantage of the CNN, which led on the one hand side to the better prediction accuracy of the CNN compared to the Random Forest. On the other hand, the feature importance for the classification became evident only from the Random Forest, while it is not possible to determine which exact patterns in the swimming trajectories allowed for the species identification of the CNN.
Similar to the present study, Wiegleb et al. (2022a) predicted the species of round goby, gudgeon, and bullhead with trajectories from the same experiment but from an upstream hydraulic barrier. Wiegleb et al. (2022a) trained their model with a smaller data set (131 trajectories) and with fewer trajectory features (8 features), which should lead to lower prediction accuracy. Indeed, Wiegleb et al. (2022a) achieved higher prediction accuracies (round goby: 85.24%, gudgeon: 92.16%) with the same Random Forest model configuration. One important difference between both studies, which might have improved the prediction in the Wiegleb et al. (2022a), was that the fish were forced to swim across a hydraulic barrier. Because of the barrier, the fish were longer exposed to the camera and longer trajectories were recorded, which may have led to more precise trajectory features. Due to the diagonal camera configuration at the lower water discharges (80 and 105 L/s) in the present study, some fish were visible for only 2 frames while passage and less precise features were recorded. For future applications of fish species identification based on swimming trajectories, structures that lead to longer trajectories recorded, such as hydraulic barriers, can improve the prediction accuracy.
Bullhead achieved a small prediction accuracy compared to the other species at the Random Forest prediction, similar to Wiegleb et al. (2022a). This comparable low prediction accuracy probably resulted from the small amount of bullhead trajectories, which imbalanced our data set (Mirus et al., 2020). At the CNN prediction, we supplemented underrepresented groups with augmented trajectories to balance our data and also increased the amount of training data (Basheer and Hajmeer, 2000; Mirus et al., 2020), which resulted in a high prediction accuracy for bullhead.
4.4 Application of artificial intelligence in fish ecology
Artificial Intelligence applications are already applied in fish abundance estimation (Mandal et al., 2018), and fish pass monitoring (Kandimalla et al., 2022). Commonly, such fish detection approaches are based on species identification using the fish shape contours, which requires high quality footage of the fish (Rodríguez et al., 2015; Kandimalla et al., 2022). Furthermore, such footage is commonly taken from lateral view, which impedes the detection of benthic fish which commonly swim at the bottom, outside of the camera view. Our study demonstrates that recording the fish from bird’s perspective allows for identification of benthic species based on the fish swimming trajectories. This approach also works at lower image quality, as no sharp contours of the fish are required. Nevertheless, we examined this approach only for three species under realistic, but laboratory conditions. Further research is required to test our approach on more species and under field conditions.
4.5 Swimming trajectories in a vertical slot–lessons for fish pass design
The species specific swimming patterns, the dependency of the swimming behaviour on hydraulic conditions, the importance of the bottom substratum for passage, and the improved passage at the vertical slot compared to the homogenous flow over the prototype hydraulic barrier (Wiegleb et al., 2022a) highlight the importance to create variable flow conditions in fish pass areas that must be passed by the migrating fish in fish passes (Franklin and Bartels, 2012). These variable flow conditions allow fish of different species and various size to choose ideal passage routes, corresponding to the individual fish’s requirements (Li et al., 2021). Such variable flow conditions could be created by use of gravel substrate or insertion of additional structures near the vertical slot, such as vertical cylinders (Franklin and Bartels, 2012; Calluaud et al., 2014). Fish passage research frequently focus on flow conditions in the basin. Nevertheless, together with Wiegleb et al. (2022a) and Wiegleb et al. (2022b), we show that the flow in the vertical slot is an important factor for passage success. Therefore, future fish passage research should focus on improving bottleneck flow fields to improve passage of various fish species and fish sizes to follow the Convention on Biological Diversity and reduce barriers to all species in aquatic ecosystems (United Nations, 1992).
Data availability statement
The original contributions presented in the study are included in the article/Supplementary Material, further inquiries can be directed to the corresponding author.
Ethics statement
The animal study was reviewed and approved by the Kantonal Veterinary Office Basel Stadt.
Author contributions
All authors listed have made substantial, direct and intellectual contribution to the work, and approved publication.
Funding
This work was funded by the Federal Office for the Environment (FOEN; Contract-Nr. Q493-0660); Kantons Basel Stadt, as well as the Lotteriefunds of Basel Land, Aargau and Solothurn.
Acknowledgments
We gratefully thank Bernd Egger for fundamental help with the experiments, Hans-Peter Jermann, Kantonal Fisheries Officer, Basel Stadt, and Frank Hartmann and Stephan Hüsgen for help with catching the fish; and Michael Ritzmann, Christopher Ulrich and Adeline Pöschl, technical staff at the KIT, for their kind assistance. We also thank Franziska Wiegleb for providing vital support.
Conflict of interest
The authors declare that the research was conducted in the absence of any commercial or financial relationships that could be construed as a potential conflict of interest.
Publisher’s note
All claims expressed in this article are solely those of the authors and do not necessarily represent those of their affiliated organizations, or those of the publisher, the editors and the reviewers. Any product that may be evaluated in this article, or claim that may be made by its manufacturer, is not guaranteed or endorsed by the publisher.
Supplementary material
The Supplementary Material for this article can be found online at: https://www.frontiersin.org/articles/10.3389/fenvs.2023.1156248/full#supplementary-material
References
Basheer, I. A., and Hajmeer, M. (2000). Artificial neural networks: Fundamentals, computing, design, and application. J. Microbiol. Methods 43 (1), 3–31. doi:10.1016/S0167-7012(00)00201-3
Beal, D. N., Hover, F. S., Triantafyllou, M. S., Liao, J. C., and Lauder, G. V. (2006). Passive propulsion in vortex wakes. J. Fluid Mech. 549, 385–402. doi:10.1017/S0022112005007925
Belletti, B., Garcia de Leaniz, C., Jones, J., Bizzi, S., Borger, L., Segura, G., et al. (2020). More than one million barriers fragment Europe’s rivers. Nature 588 (7838), 436–441. doi:10.1038/s41586-020-3005-2
Benitez, J. P., Nzau Matondo, B., Dierckx, A., and Ovidio, M. (2015). An overview of potamodromous fish upstream movements in medium-sized rivers, by means of fish passes monitoring. Aquat. Ecol. 49 (4), 481–497. doi:10.1007/s10452-015-9541-4
Blender Community (2017). Blender - a 3D modelling and rendering package. Amsterdam: Blender Foundation. Available at: https://www.blender.org/.
Bombač, M., Četina, M., and Novak, G. (2017). Study on flow characteristics in vertical slot fishways regarding slot layout optimization. Ecol. Eng. 107, 126–136. doi:10.1016/j.ecoleng.2017.07.008
Bovet, P., and Benhamou, S. (1988). Spatial analysis of animals’ movements using a correlated random walk model. J. Theor. Biol. 131 (4), 419–433. doi:10.1016/S0022-5193(88)80038-9
Calluaud, D., Pineau, G., Texier, A., and David, L. (2014). Modification of vertical slot fishway flow with a supplementary cylinder. J. Hydraul. Res. 52 (5), 614–629. doi:10.1080/00221686.2014.906000
Cano-Barbacil, C., Radinger, J., Argudo, M., Rubio-Garcia, F., Vila-Gispert, A., and Garcia-Berthou, E. (2020). Key factors explaining critical swimming speed in freshwater fish: A review and statistical analysis for iberian species. Sci. Rep. 10 (1), 18947–19012. doi:10.1038/s41598-020-75974-x
Carlson, R. L., and Lauder, G. V. (2011). Escaping the flow: Boundary layer use by the darter Etheostoma tetrazonum (Percidae) during benthic station holding. J. Exp. Biol. 214 (7), 1181–1193. doi:10.1242/jeb.051938
Carlson, R. L., and Lauder, G. V. (2010). Living on the bottom: Kinematics of benthic station-holding in darter fishes (percidae: Etheostomatinae). J. Morph. 271 (1), 25–35. doi:10.1002/jmor.10776
Castro-Santos, T., Cotel, A., and Webb, P. (2009). Fishway evaluations for better bioengineering: An integrative approach A framework for fishway. Am. Fish. Soc. Symp. 69, 557–575.
Cheung, A., Zhang, S., Stricker, C., and Srinivasan, M. V. (2007). Animal navigation: The difficulty of moving in a straight line. Biol. Cybern. 97 (1), 47–61. doi:10.1007/s00422-007-0158-0
Cutler, D. R., Edwards, T. C., Beard, K. H., Cutler, A., Hess, K. T., Gibson, J., et al. (2007). Random forests for classification in ecology. Ecology 88 (11), 2783–2792. doi:10.1890/07-0539.1
Davey, A. J. H., Hawkins, S. J., Turner, G. F., and Doncaster, C. P. (2005). Size-dependent microhabitat use and intraspecific competition in Cottus gobio. J. Fish. Biol. 67 (2), 428–443. doi:10.1111/j.0022-1112.2005.00736.x
de Bie, J., Manes, C., and Kemp, P. S. (2020). Collective behaviour of fish in the presence and absence of flow. Anim. Behav. 167, 151–159. doi:10.1016/j.anbehav.2020.07.003
Egger, B., Wiegleb, J., Seidel, F., Burkhardt-Holm, P., and Hirsch, P. E. (2020). Comparative swimming performance and behaviour of three benthic fish species: The invasive round goby (Neogobius melanostomus), the native bullhead (Cottus gobio), and the native gudgeon (Gobio gobio). Ecol. Freshw. Fish. 30 (3), 391–405. doi:10.1111/eff.12592
Facey, D. E., and Grossman, G. D. (1992). The relationship between water velocity, energetic costs, and microhabitat use in four North American stream fishes. Hydrobiologia 239 (1), 1–6. doi:10.1007/bf00027524
Franklin, P. A., and Bartels, B. (2012). Restoring connectivity for migratory native fish in a New Zealand stream: Effectiveness of retrofitting a pipe culvert. Aquat. Conserv. 22 (4), 489–497. doi:10.1002/aqc.2232
Fuentes-Pérez, J. F., Tuhtan, J. A., Branco, P., Eckert, M., Ferreira, M. T., and Kruusmaa, M. (2018). A 3D data-driven approach to study the hydrodynamic preferences of fish in fishways. Tokyo, Japan: ISE, 0–4.
Gilbert, M. J. H., Barbarich, J. M., Casselman, M., Kasurak, A. V., Higgs, D. M., and Tierney, K. B. (2016). The role of substrate holding in achieving critical swimming speeds: A case study using the invasive round goby (Neogobius melanostomus). Environ. Biol. Fishes 99 (10), 793–799. doi:10.1007/s10641-016-0514-9
Gu, J., Wang, Z., Kuen, J., Ma, L., Shuai, J., Liu, T., et al. (2018). Recent advances in convolutional neural networks. Pattern Recogn. 77, 354–377. doi:10.1016/j.patcog.2017.10.013
Hirsch, P. E., Thorlacius, M., Brodin, T., and Burkhardt-Holm, P. (2017). An approach to incorporate individual personality in modeling fish dispersal across in-stream barriers. Ecol. Evol. 7 (2), 720–732. doi:10.1002/ece3.2629
Hoover, J. J., Adams, S. R., and Killgore, K. J. (2003). Can hydraulic barriers stop the spread of the round goby? U.S.A: Environmental Laboratory. Available at: https://hdl.handle.net/11681/5086.
Imre, I., McLaughlin, R. L., and Noakes, D. L. G. (2002). Phenotypic plasticity in brook charr: Changes in caudal fin induced by water flow. J. Fish. Biol. 61 (5), 1171–1181. doi:10.1111/j.1095-8649.2002.tb02463.x
Kandimalla, V., Richard, M., Smith, F., Quirion, J., Torgo, L., and Whidden, C. (2022). Automated detection, classification and counting of fish in fish passages with deep learning. Front. Mar. Sci. 8, 2049. doi:10.3389/fmars.2021.823173
Katopodis, C., and Williams, J. G. (2012). The development of fish passage research in a historical context. Ecol. Eng. 48, 8–18. doi:10.1016/j.ecoleng.2011.07.004
Kitamura, T., and Imafuku, M. (2015). Behavioural mimicry in flight path of Batesian intraspecific polymorphic butterfly Papilio polytes. Proc. R. Soc. B 282 (1809), 20150483. doi:10.1098/rspb.2015.0483
Kornis, M. S., Mercado-Silva, N., and vander Zanden, M. J. (2012). Twenty years of invasion: A review of round goby Neogobius melanostomus biology, spread and ecological implications. J. Fish. Biol. 80 (2), 235–285. doi:10.1111/j.1095-8649.2011.03157.x
Lauder, G. V., and Madden, P. G. A. (2007). Fish locomotion: Kinematics and hydrodynamics of flexible foil-like fins. Exp. Fluids 43 (5), 641–653. doi:10.1007/s00348-007-0357-4
Li, G., Sun, S., Liu, H., and Zheng, T. (2021). Schizothorax prenanti swimming behavior in response to different flow patterns in vertical slot fishways with different slot positions. Sci. Total Environ. 754, 142142. doi:10.1016/j.scitotenv.2020.142142
Liang, Y., Hou, Y., Hu, W., Johnson, D., and Wang, J. (2021). Flow velocity preference of Schizothorax oconnori Lloyd swimming upstream. GECCO 32, e01902. doi:10.1016/j.gecco.2021.e01902
Liao, J. C. (2007). A review of fish swimming mechanics and behaviour in altered flows’, Philos. Trans. R. Soc. 362 , 1973–1993. doi:10.1098/rstb.2007.2082
Liao, J. C., Beal, D. N., Lauder, G. V., and Triantafyllou, M. S. (2003). Fish exploiting vortices decrease muscle activity. Science 302 (5650), 1566–1569. doi:10.1126/science.1088295
Liaw, A., and Wiener, M. (2002). Classification and regression by randomForest. R. News 2 (3), 18–22.
Liu, M., Rajaratnam, N., and Zhu, D. Z. (2006). Mean flow and turbulence structure in vertical slot fishways. J. Hydraul. Eng. 132 (8), 765–777. doi:10.1061/(asce)0733-9429(2006)132:8(765)(2006)132:8(765)
Lothian, A. J., and Lucas, M. C. (2021). The role of individual behavioral traits on fishway passage attempt behavior. Ecol. Evol. 11 (17), 11974–11990. doi:10.1002/ece3.7964
Magnhagen, C. (2012). Personalities in a crowd: What shapes the behaviour of Eurasian perch and other shoaling fishes? Curr. Zool. 58 (1), 35–44. doi:10.1093/czoolo/58.1.35
Mandal, R., Connoly, R. M., Schlacher, T. A., and Stantic, B. (2018). Assessing fish abundance from underwater video using deep neural networks. Proc. Int. Jt. Conf. Neural Netw. 2018, 1–6. doi:10.1109/IJCNN.2018.8489482
McLean, D. J., and Skowron Volponi, M. A. (2018). trajr: An R package for characterisation of animal trajectories. Ethology 124 (6), 440–448. doi:10.1111/eth.12739
Mirus, F., Stewart, T. C., and Conradt, J. (2020). The importance of balanced data sets: Analyzing a vehicle trajectory prediction model based on neural networks and distributed representations. Proc. Int. Jt. Conf. Neural Netw. 2020, 1–8. doi:10.1109/IJCNN48605.2020.9206627
Nilsson, C., Reidy, C. A., Dynesius, M., and Revenga, C. (2005). Fragmentation and flow regulation of the world’s large river systems. Science 308 (5720), 405–408. doi:10.1126/science.1107887
Ohlberger, J., Staaks, G., and Hölker, F. (2006). Swimming efficiency and the influence of morphology on swimming costs in fishes. J. Comp. Physiol. 176 (1), 17–25. doi:10.1007/s00360-005-0024-0
Pennuto, C. M., and Rupprecht, S. M. (2016). Upstream range expansion by invasive round gobies: Is functional morphology important? Aquat. Ecol. 50 (1), 45–57. doi:10.1007/s10452-015-9551-2
Plesiński, K., Bylak, A., Radecki-Pawlik, A., Mikołajczyk, T., and Kukuła, K. (2018). Possibilities of fish passage through the block ramp: Model-based estimation of permeability. Sci. Total Environ. 631, 1201–1211. doi:10.1016/j.scitotenv.2018.03.128
Puertas, J., Pena, L., and Teijeiro, T. (2004). Experimental approach to the hydraulics of vertical slot fishways. J. Hydraul. Eng. 130 (1), 10–23. doi:10.1061/(asce)0733-9429(2004)130:1(10)(2004)130:1(10)
Quaranta, E., Katopodis, C., Revelli, R., and Comoglio, C. (2017). Turbulent flow field comparison and related suitability for fish passage of a standard and a simplified low-gradient vertical slot fishway. River Res. Appl. 33 (8), 1295–1305. doi:10.1002/rra.3193
Rahel, F. J., and McLaughlin, R. L. (2018). Selective fragmentation and the management of fish movement across anthropogenic barriers. Ecol. Appl. 28 (8), 2066–2081. doi:10.1002/eap.1795
Rodríguez, Á., Bermudez, M., Rabunal, J. R., and Puertas, J. (2015). Fish tracking in vertical slot fishways using computer vision techniques. J. Hydroinformatics 17 (2), 275–292. doi:10.2166/hydro.2014.034
Roje, S., Drozd, B., Richter, L., Kubec, J., Polivka, Z., Worischka, S., et al. (2021). Comparison of behavior and space use of the European bullhead Cottus gobio and the round goby Neogobius melanostomus in a simulated natural habitat. Biology 10 (9), 821. doi:10.3390/biology10090821
Roscoe, D. W., and Hinch, S. G. (2010). Effectiveness monitoring of fish passage facilities: Historical trends, geographic patterns and future directions. Fish. Fish. 11 (1), 12–33. doi:10.1111/j.1467-2979.2009.00333.x
Sanchez, P. X., Leng, X., Von Brandis-Martini, J., and Chanson, H. (2020). Hybrid modelling of low velocity zones in an asymmetrical channel with sidewall longitudinal rib to assist fish passage. River Res. Appl. 36 (5), 807–818. doi:10.1002/rra.3600
Sfakiotakis, M., Lane, D. M., and Davies, J. B. C. (1999). Review of fish swimming modes for aquatic locomotion. IEEE J. Ocean. Eng. 24 (2), 237–252. doi:10.1109/48.757275
Tan, J., Tao, L., Gao, Z., Dai, H., and Shi, X. (2018). Modeling fish movement trajectories in relation to hydraulic response relationships in an experimental fishway. Water 10 (11), 1511. doi:10.3390/w10111511
Tharwat, A. (2018). Classification assessment methods. App. Comput. Inf. 17 (1), 168–192. doi:10.1016/j.aci.2018.08.003
Tierney, K. B., Kasurak, A. V., Zielinski, B. S., and Higgs, D. M. (2011). Swimming performance and invasion potential of the round goby. Environ. Biol. Fishes 92 (4), 491–502. doi:10.1007/s10641-011-9867-2
Tudorache, C., Viaene, P., Blust, R., Vereecken, H., and De Boeck, G. (2008). A comparison of swimming capacity and energy use in seven European freshwater fish species. Ecol. Freshw. Fish. 17 (2), 284–291. doi:10.1111/j.1600-0633.2007.00280.x
United Nations (1992). Convention on biological diversity. Available at: http://www.cbd.int/doc/legal/cbd-en.pdf.
Wang, R. W., David, L., and Larinier, M. (2010). Contribution of experimental fluid mechanics to the design of vertical slot fish passes. Knowl. Manag. Aquat. Ecosyst. 396, 2. doi:10.1051/kmae/2010002
Wiegleb, J., Hirsch, P. E., Seidel, F., Rauter, G., and Burkhardt-Holm, P. (2022a). Flow, force, behaviour: Assessment of a prototype hydraulic barrier for invasive fish. Hydrobiologia 849 (4), 1001–1019. doi:10.1007/s10750-021-04762-z
Wiegleb, J., Hirsch, P. E., Seidel, F., Rauter, G., and Burkhardt-Holm, P. (2022b). Impact of hydraulic forces on the passage of round goby (Neogobius melanostomus), gudgeon (Gobio gobio) and bullhead (Cottus gobio) in a vertical slot fish pass. Ecol. Freshw. Fish. 2022, 1–15. doi:10.1111/eff.12696
Williams, J. G., Armstrong, G., Katopodis, C., Larinier, M., and Travade, F. (2012). Thinking like a fish: A key ingredient for development of effective fish passage facilities at river obstructions. River Res. Appl. 28 (4), 407–417. doi:10.1002/rra.1551
Keywords: video tracking, convolutional neural network, machine learning (ML), hydrodynamics, fish pass
Citation: Wiegleb J, Hirsch PE, Seidel F, Rauter G and Burkhardt-Holm P (2023) Round goby [Neogobius melanostomus (Pallas, 1814)], gudgeon (Gobio gobio L.) and bullhead (Cottus gobio L.) show distinct swimming patterns in a vertical slot fish pass. Front. Environ. Sci. 11:1156248. doi: 10.3389/fenvs.2023.1156248
Received: 01 February 2023; Accepted: 06 March 2023;
Published: 22 March 2023.
Edited by:
Anthony Lehmann, University of Geneva, SwitzerlandReviewed by:
Weferson Júnio da Graça, State University of Maringá, BrazilYuhong Zeng, Wuhan University, China
Copyright © 2023 Wiegleb, Hirsch, Seidel, Rauter and Burkhardt-Holm. This is an open-access article distributed under the terms of the Creative Commons Attribution License (CC BY). The use, distribution or reproduction in other forums is permitted, provided the original author(s) and the copyright owner(s) are credited and that the original publication in this journal is cited, in accordance with accepted academic practice. No use, distribution or reproduction is permitted which does not comply with these terms.
*Correspondence: Joschka Wiegleb, j.wiegleb@soton.ac.uk